- Belcher homes for sale
- Benton homes for sale
- Bethany homes for sale
- Blanchard homes for sale
- Bossier City homes for sale
- Cotton Valley homes for sale
- Doyline homes for sale
- Eastwood homes for sale
- Elm Grove homes for sale
- Greenwood homes for sale
- Haughton homes for sale
- Hosston homes for sale
- Lakeview homes for sale
- Mooringsport homes for sale
- Oil City homes for sale
- Plain Dealing homes for sale
- Princeton homes for sale
- Red Chute homes for sale
- Shreveport homes for sale
- Waskom homes for sale
71111, LA - homes for sale
300 of 306 results displayed
- New
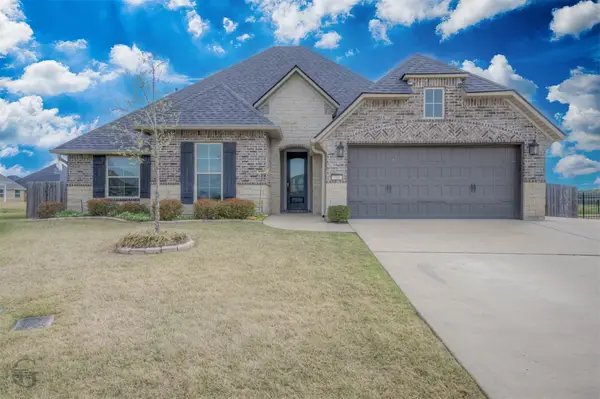
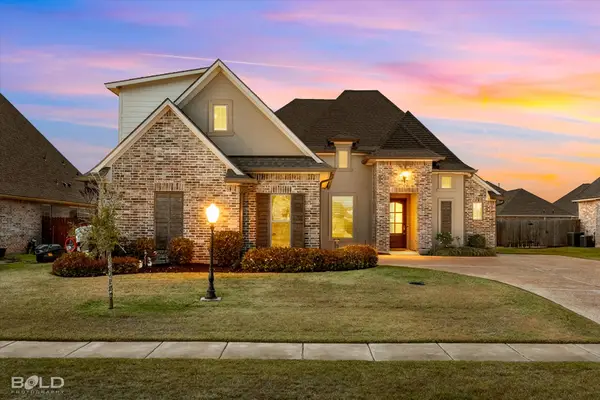
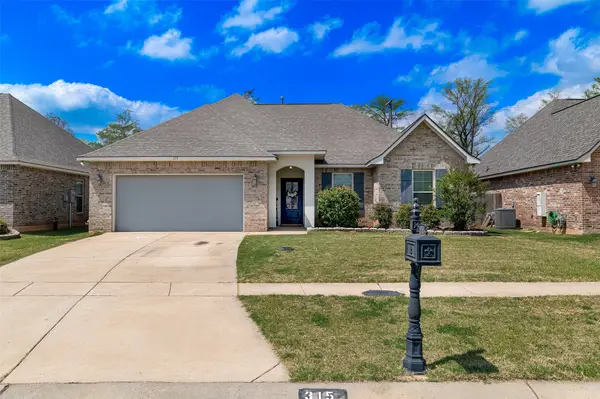 $287,500Active4 beds 2 baths1,892 sq. ft.
315 Coppice Place, Bossier City, LA 71111
MLS# 21223862Listed by: PELICAN REALTY ADVISORS - New
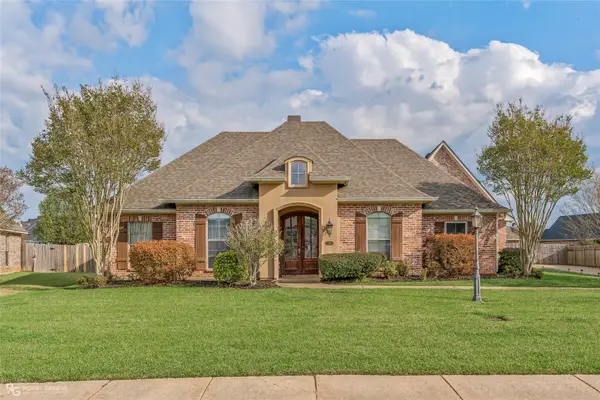 $439,000Active4 beds 3 baths2,564 sq. ft.
125 Horseguards Avenue, Bossier City, LA 71111
MLS# 21222183Listed by: BERKSHIRE HATHAWAY HOMESERVICES ALLY REAL ESTATE - New
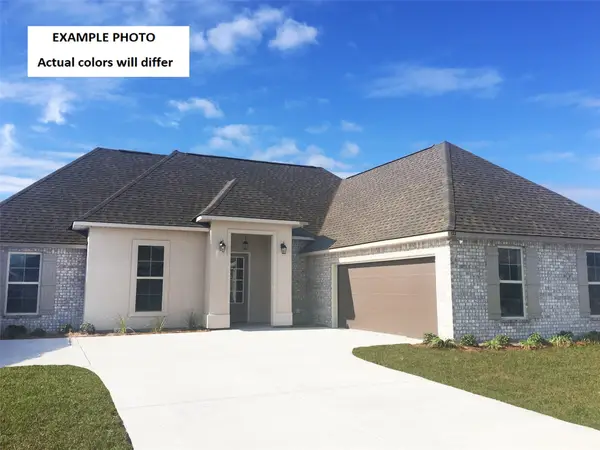
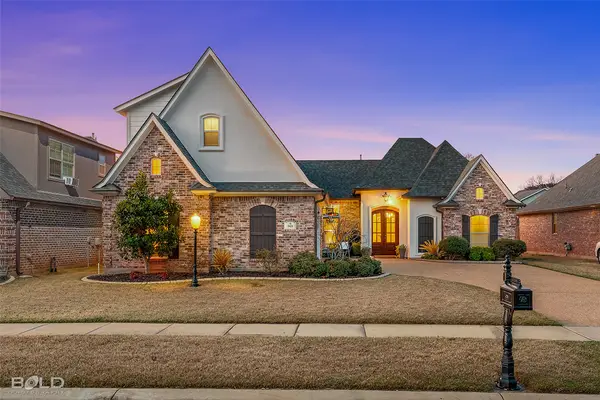
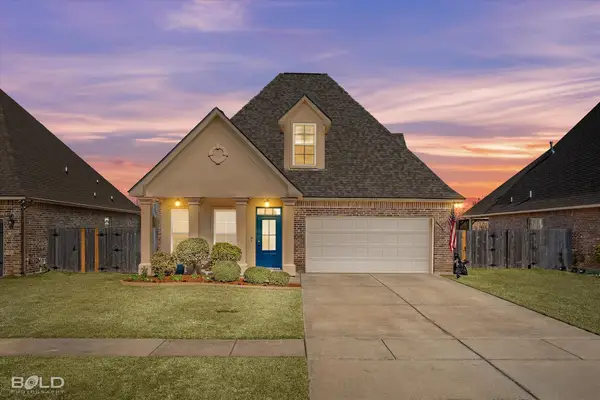
 $350,000Active4 beds 3 baths2,065 sq. ft.
2012 Regent Circle, Bossier City, LA 71111
MLS# 21214609Listed by: KELLER WILLIAMS NORTHWEST - New
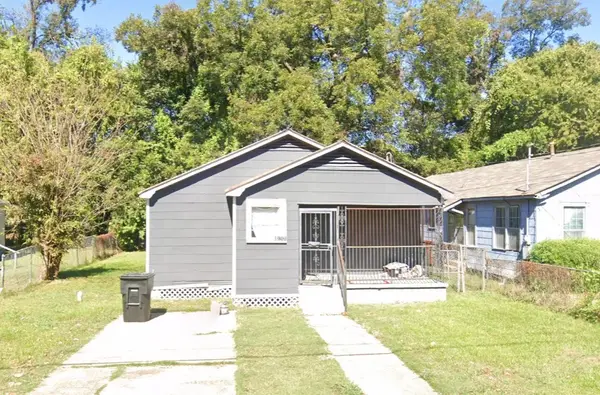 $64,900Active3 beds 1 baths1,335 sq. ft.
323 Kelly Street, Bossier City, LA 71111
MLS# 21223458Listed by: PINNACLE REALTY ADVISORS - New
 $279,000Active4 beds 3 baths2,610 sq. ft.
220 Walnut Lane, Bossier City, LA 71111
MLS# 21222389Listed by: COLDWELL BANKER APEX, REALTORS - New
 $318,961Active4 beds 2 baths1,885 sq. ft.
733 Crewe Lane, Bossier City, LA 71111
MLS# 21219538Listed by: CICERO REALTY LLC - New
 $315,000Active4 beds 2 baths1,961 sq. ft.
949 Maize Street, Bossier City, LA 71111
MLS# 21219134Listed by: DIAMOND REALTY & ASSOCIATES - New
 $579,900Active4 beds 4 baths2,654 sq. ft.
776 Duckwater Landing, Bossier City, LA 71111
MLS# 21219211Listed by: DIAMOND REALTY & ASSOCIATES - New
 $399,900Active4 beds 3 baths2,290 sq. ft.
516 Secret Cove, Bossier City, LA 71111
MLS# 21218742Listed by: KELLER WILLIAMS NORTHWEST - New
 $459,000Active5 beds 3 baths2,416 sq. ft.
700 Abita Chase, Bossier City, LA 71111
MLS# 21218777Listed by: DIAMOND REALTY & ASSOCIATES - New
 $199,000Active3 beds 2 baths1,688 sq. ft.
2113 Mockingbird Lane, Bossier City, LA 71111
MLS# 21218662Listed by: KELLER WILLIAMS NORTHWEST 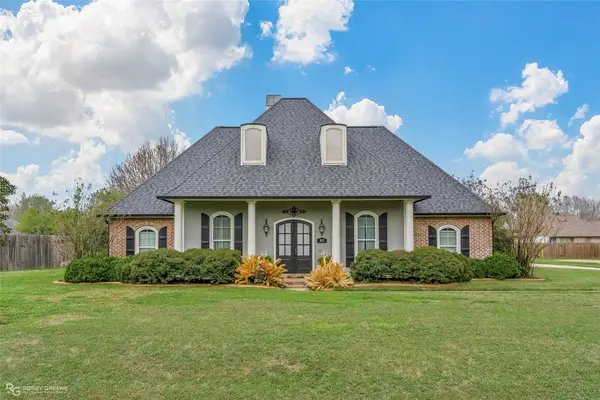 $550,000Pending4 beds 4 baths3,517 sq. ft.
503 Secret Cove, Bossier City, LA 71111
MLS# 21206393Listed by: DIAMOND REALTY & ASSOCIATES $326,176Pending4 beds 2 baths2,204 sq. ft.
748 Crewe Lane, Bossier City, LA 71111
MLS# 21217451Listed by: CICERO REALTY LLC- New
 $251,235Active3 beds 2 baths1,578 sq. ft.
779 Venecia Drive, Bossier City, LA 71111
MLS# 21217358Listed by: CICERO REALTY LLC - New
 $248,930Active3 beds 2 baths1,564 sq. ft.
771 Venecia Drive, Bossier City, LA 71111
MLS# 21217029Listed by: CICERO REALTY LLC - New
 $434,900Active4 beds 3 baths2,449 sq. ft.
918 Royal Circle, Bossier City, LA 71111
MLS# 21174729Listed by: PINNACLE REALTY ADVISORS 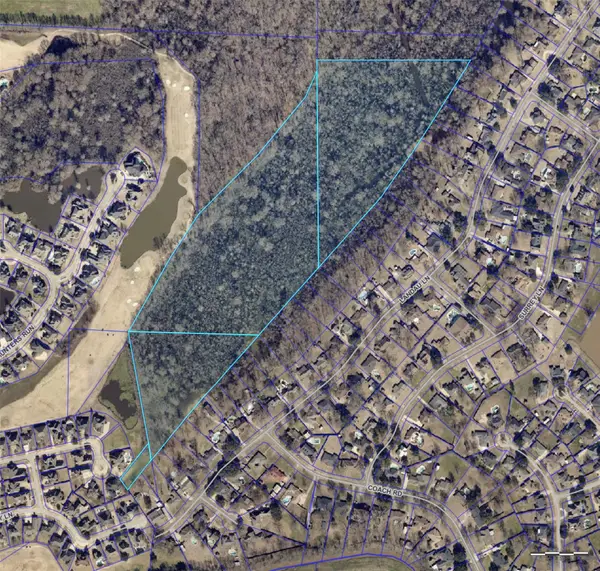
 $50,000Pending28.8 Acres
0 Landau Lane, Bossier City, LA 71111
MLS# 21213251Listed by: CENTURY 21 ELITE- New
 $510,000Active4 beds 3 baths2,442 sq. ft.
605 Dumaine Drive, Bossier City, LA 71111
MLS# 21210356Listed by: PINNACLE REALTY ADVISORS  $285,000Active3 beds 2 baths1,848 sq. ft.
325 Coppice Place, Bossier City, LA 71111
MLS# 21214461Listed by: BERKSHIRE HATHAWAY HOMESERVICES ALLY REAL ESTATE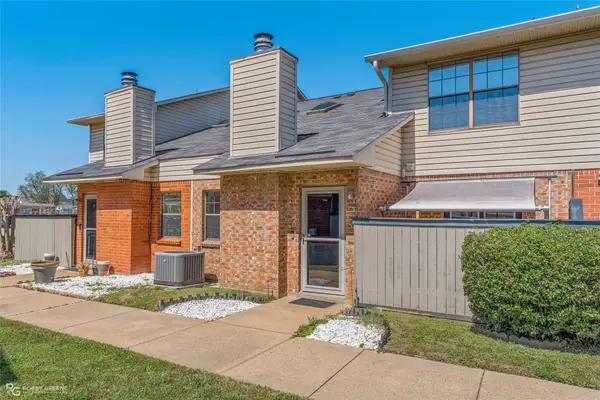 $179,000Active2 beds 2 baths1,297 sq. ft.
3636 Greenacres Place Drive #161, Bossier City, LA 71111
MLS# 21213813Listed by: EXP REALTY, LLC $299,999Active3 beds 3 baths2,923 sq. ft.
2309 Arlington Place, Bossier City, LA 71111
MLS# 21194291Listed by: BERKSHIRE HATHAWAY HOMESERVICES ALLY REAL ESTATE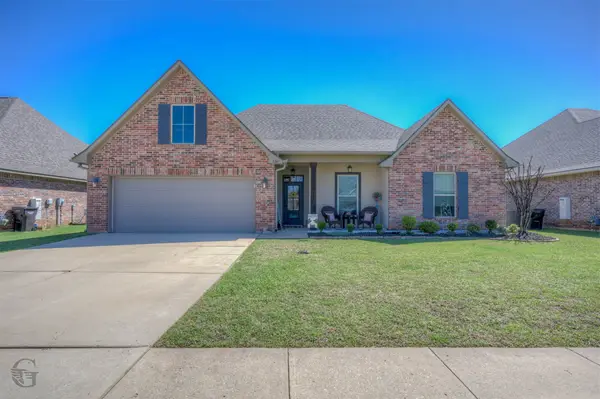 $325,000Pending4 beds 2 baths2,204 sq. ft.
320 Coppice Place, Bossier City, LA 71111
MLS# 21209183Listed by: 318 REAL ESTATE L.L.C. $519,900Active5 beds 4 baths2,826 sq. ft.
136 Autumn Creek, Bossier City, LA 71111
MLS# 21213851Listed by: PINNACLE REALTY ADVISORS $63,000Active0.19 Acres
214 Overbrook Lane, Bossier City, LA 71111
MLS# 21213468Listed by: COLDWELL BANKER APEX, REALTORS $89,000Active0.99 Acres
5020 Swan Lake Road, Bossier City, LA 71111
MLS# 21213483Listed by: CENTURY 21 UNITED $63,000Active0.19 Acres
216 Overbrook Lane, Bossier City, LA 71111
MLS# 21213515Listed by: COLDWELL BANKER APEX, REALTORS $434,900Pending4 beds 4 baths2,293 sq. ft.
570 Chinquipin Drive, Bossier City, LA 71111
MLS# 21201181Listed by: BERKSHIRE HATHAWAY HOMESERVICES ALLY REAL ESTATE $57,000Active3 beds 2 baths1,069 sq. ft.
4903 Dahlia Drive, Bossier City, LA 71111
MLS# 21212470Listed by: INFINITY REALTY GROUP OF TEXAS $445,000Active3 beds 3 baths2,408 sq. ft.
61 Turnbury Drive, Bossier City, LA 71111
MLS# 21212324Listed by: RE/MAX REAL ESTATE SERVICES $49,999Active2 beds 1 baths1,050 sq. ft.
1011 Eastside Street, Bossier City, LA 71111
MLS# 21212151Listed by: PRIMEAUX REALTY, LLC $240,625Pending3 beds 2 baths1,461 sq. ft.
773 Venecia Drive, Bossier City, LA 71111
MLS# 21212153Listed by: CICERO REALTY LLC $199,900Active1 beds 1 baths2,120 sq. ft.
416 Colquitt Street, Bossier City, LA 71111
MLS# 21210316Listed by: DIAMOND REALTY & ASSOCIATES $141,000Active2 beds 2 baths1,380 sq. ft.
500 Mccormick Street, Bossier City, LA 71111
MLS# 21211491Listed by: DIAMOND REALTY & ASSOCIATES $385,000Pending4 beds 2 baths2,044 sq. ft.
125 Crosscreek Drive, Bossier City, LA 71111
MLS# 21211535Listed by: COLDWELL BANKER APEX, REALTORS $1,250,000Active6 beds 8 baths5,985 sq. ft.
207 N Beach Drive, Bossier City, LA 71111
MLS# 21210919Listed by: PINNACLE REALTY ADVISORS $384,900Active4 beds 3 baths2,197 sq. ft.
610 Glenshire Drive, Bossier City, LA 71111
MLS# 21209358Listed by: PELICAN REALTY ADVISORS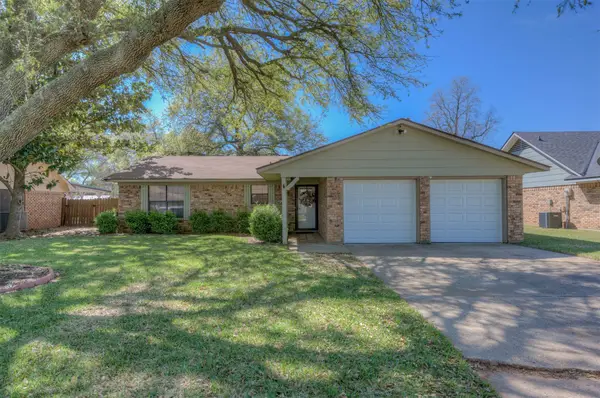 $237,500Active3 beds 2 baths1,712 sq. ft.
2645 Brown Street, Bossier City, LA 71111
MLS# 21208871Listed by: DIAMOND REALTY & ASSOCIATES $459,900Pending4 beds 3 baths2,918 sq. ft.
803 Brittany Lane, Bossier City, LA 71111
MLS# 21206389Listed by: PINNACLE REALTY ADVISORS $725,000Active4 beds 3 baths3,116 sq. ft.
102 Chesterton Court, Bossier City, LA 71111
MLS# 21208617Listed by: RE/MAX REAL ESTATE SERVICES $133,000Active3 beds 1 baths1,200 sq. ft.
4720 Okeefe Street, Bossier City, LA 71111
MLS# 21184796Listed by: RE/MAX EXECUTIVE REALTY $242,820Active3 beds 2 baths1,278 sq. ft.
3722 Sabine Pass Drive, Bossier City, LA 71111
MLS# 21184827Listed by: RE/MAX EXECUTIVE REALTY $229,000Active3 beds 3 baths2,446 sq. ft.
2329 Belmont Boulevard, Bossier City, LA 71111
MLS# 21206237Listed by: OSBORN HAYS REAL ESTATE, LLC $496,206Pending5 beds 4 baths2,885 sq. ft.
346 Prien Lake Loop, Bossier City, LA 71111
MLS# 21206979Listed by: PINNACLE REALTY ADVISORS $139,999Active3 beds 1 baths1,000 sq. ft.
1033 Norris Drive, Bossier City, LA 71111
MLS# 21205144Listed by: BERKSHIRE HATHAWAY HOMESERVICES ALLY REAL ESTATE $399,000Active3 beds 3 baths2,181 sq. ft.
27 Chez Moi Drive, Bossier City, LA 71111
MLS# 21205016Listed by: COLDWELL BANKER APEX, REALTORS $610,000Active4 beds 4 baths3,738 sq. ft.
101 Chesterton Court, Bossier City, LA 71111
MLS# 21205248Listed by: RE/MAX REAL ESTATE SERVICES $239,900Active3 beds 2 baths1,744 sq. ft.
2210 Stockwell Road, Bossier City, LA 71111
MLS# 21194990Listed by: BERKSHIRE HATHAWAY HOMESERVICES ALLY REAL ESTATE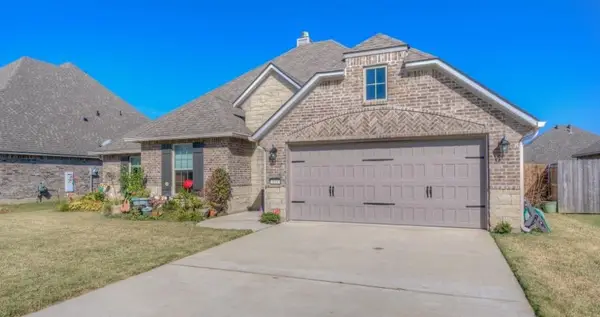 $335,000Active4 beds 2 baths1,922 sq. ft.
819 Abita Chase, Bossier City, LA 71111
MLS# 21203274Listed by: BETTER HOMES AND GARDENS RE LINDSEY REALTY- Open Thu, 1:30 to 3pm
 $636,174Active4 beds 3 baths2,754 sq. ft.
584 Corinth Circle, Bossier City, LA 71111
MLS# 21203061Listed by: RE/MAX REAL ESTATE SERVICES 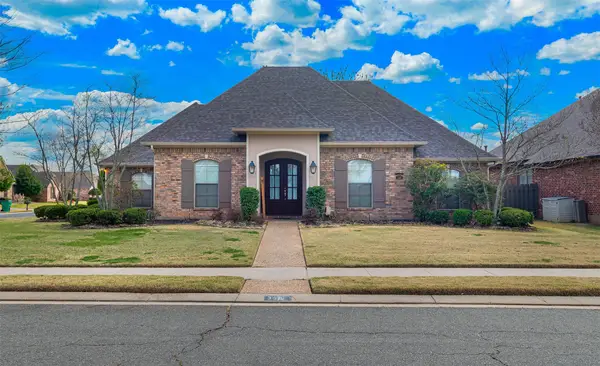 $465,000Active4 beds 4 baths2,840 sq. ft.
336 Briars Court, Bossier City, LA 71111
MLS# 21202517Listed by: CENTURY 21 ELITE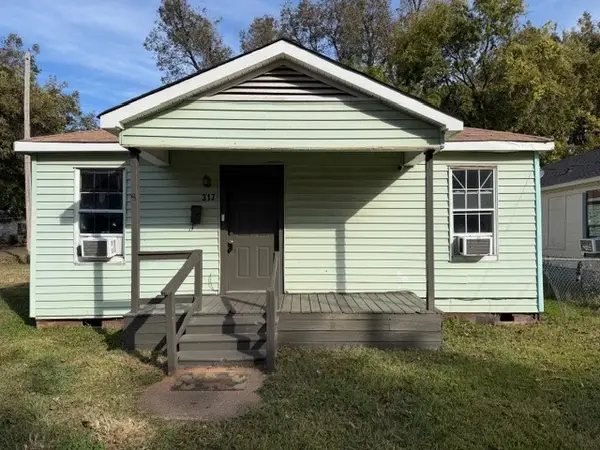 $77,000Active3 beds 1 baths1,276 sq. ft.
317 Kelly Street, Bossier City, LA 71111
MLS# 21201955Listed by: PINNACLE REALTY ADVISORS $82,000Active3 beds 1 baths1,016 sq. ft.
504 Yarborough Street, Bossier City, LA 71111
MLS# 21201957Listed by: PINNACLE REALTY ADVISORS $484,900Pending4 beds 3 baths2,457 sq. ft.
1113 Calle Lago Court, Bossier City, LA 71111
MLS# 21201500Listed by: PINNACLE REALTY ADVISORS $249,900Active3 beds 2 baths1,639 sq. ft.
5106 Venecia Drive, Bossier City, LA 71111
MLS# 21201199Listed by: RE/MAX ADVANTAGE $430,000Active4 beds 3 baths2,277 sq. ft.
438 Stacey Lane, Bossier City, LA 71111
MLS# 21199315Listed by: SHELLY WAGNER & ASSOCIATES + JPAR REAL ESTATE $29,000Active2 beds 1 baths936 sq. ft.
416 Yarborough Street, Bossier City, LA 71111
MLS# 21200563Listed by: COLDWELL BANKER APEX, REALTORS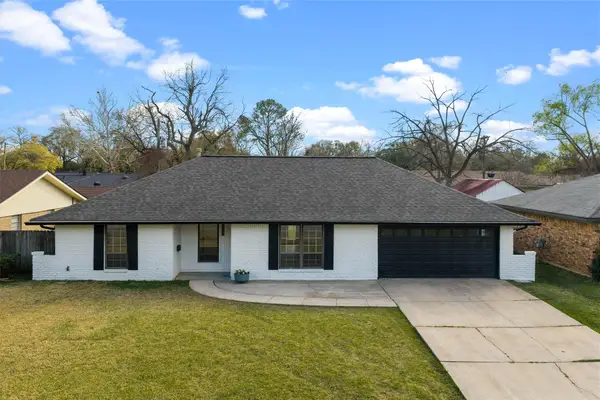 $239,900Active4 beds 2 baths1,730 sq. ft.
2426 Melrose Avenue, Bossier City, LA 71111
MLS# 21177606Listed by: RACHEL & CO. REALTY $352,483Pending4 beds 3 baths2,211 sq. ft.
436 Blanchard Loop, Bossier City, LA 71111
MLS# 21195171Listed by: CENTURY 21 ELITE $326,000Active3 beds 2 baths1,891 sq. ft.
712 Abita, Bossier City, LA 71111
MLS# 21195775Listed by: PINNACLE REALTY ADVISORS $42,000Active3 beds 1 baths1,615 sq. ft.
1805 Traffic Street, Bossier City, LA 71111
MLS# 21199837Listed by: DIAMOND REALTY & ASSOCIATES $464,000Active4 beds 3 baths2,334 sq. ft.
462 Stacey Lane, Bossier City, LA 71111
MLS# 21198063Listed by: RE/MAX REAL ESTATE SERVICES $290,000Active4 beds 2 baths2,400 sq. ft.
2201 Hickory Ridge Drive, Bossier City, LA 71111
MLS# 21199403Listed by: CONGRESS REALTY, INC. $241,795Active3 beds 2 baths1,482 sq. ft.
769 Venecia Drive, Bossier City, LA 71111
MLS# 21197424Listed by: CICERO REALTY LLC $325,000Active3 beds 2 baths1,761 sq. ft.
1107 Creole Drive, Bossier City, LA 71111
MLS# 21196752Listed by: PELICAN REALTY ADVISORS $70,000Pending2 beds 2 baths1,259 sq. ft.
3634 Greenacres Place Drive #261, Bossier City, LA 71111
MLS# 21196690Listed by: KELLER WILLIAMS NORTHWEST $249,000Active3 beds 2 baths1,466 sq. ft.
3306 Colonial Drive, Bossier City, LA 71111
MLS# 21196694Listed by: DIAMOND REALTY & ASSOCIATES $349,900Active4 beds 3 baths2,461 sq. ft.
2005 Surrey Lane, Bossier City, LA 71111
MLS# 21192187Listed by: CENTURY 21 ELITE $309,900Active4 beds 3 baths2,226 sq. ft.
103 Lakewood Point Drive, Bossier City, LA 71111
MLS# 21195608Listed by: TOP BROKERAGE LLC $425,000Pending3 beds 3 baths2,482 sq. ft.
42 Waterbury Drive, Bossier City, LA 71111
MLS# 21189756Listed by: PINNACLE REALTY ADVISORS $470,000Pending5 beds 3 baths2,484 sq. ft.
602 Glenshire Drive, Bossier City, LA 71111
MLS# 21195228Listed by: COLDWELL BANKER APEX, REALTORS $369,900Active4 beds 2 baths2,400 sq. ft.
2213 Shumark Trail, Bossier City, LA 71111
MLS# 21195302Listed by: 1 PERCENT LISTS NWLA $427,000Active5 beds 3 baths3,037 sq. ft.
2207 Landau Lane, Bossier City, LA 71111
MLS# 21194571Listed by: PINNACLE REALTY ADVISORS $314,900Active3 beds 2 baths1,680 sq. ft.
701 Perfect Place, Bossier City, LA 71111
MLS# 21194396Listed by: STERLING & SOUTHERN REAL ESTATE CO. LLC $111,900Pending3 beds 1 baths1,248 sq. ft.
4603 Okeefe Street, Bossier City, LA 71111
MLS# 21188536Listed by: KELLER WILLIAMS NORTHWEST $570,000Pending4 beds 3 baths2,480 sq. ft.
214 Conti Way, Bossier City, LA 71111
MLS# 21193378Listed by: CENTURY 21 ELITE $285,000Active3 beds 2 baths1,552 sq. ft.
4177 Grassy Lake Drive, Bossier City, LA 71111
MLS# 21194068Listed by: PINNACLE REALTY ADVISORS $499,999Active4 beds 3 baths4,068 sq. ft.
106 Fairmont Drive, Bossier City, LA 71111
MLS# 21192826Listed by: COLDWELL BANKER APEX, REALTORS $769,900Pending4 beds 5 baths3,374 sq. ft.
217 Evangeline Walk, Bossier City, LA 71111
MLS# 21193544Listed by: RE/MAX ADVANTAGE $359,999Active4 beds 3 baths2,265 sq. ft.
946 Maize Street, Bossier City, LA 71111
MLS# 21192245Listed by: BERKSHIRE HATHAWAY HOMESERVICES ALLY REAL ESTATE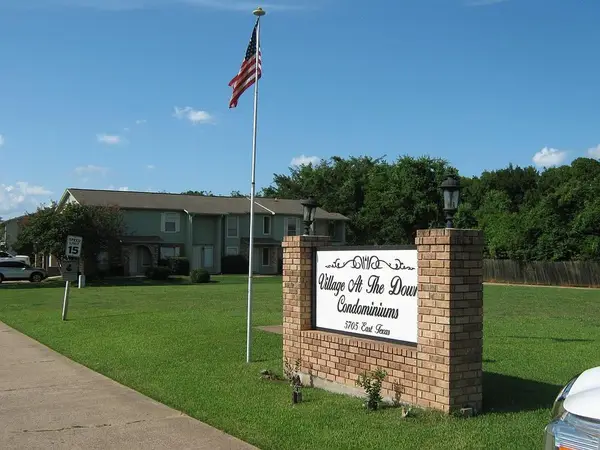 $84,900Active2 beds 2 baths1,044 sq. ft.
5705 E Texas Street #47, Bossier City, LA 71111
MLS# 21193219Listed by: EAST BANK REAL ESTATE $220,000Active3 beds 2 baths1,610 sq. ft.
2103 Sandhurst Street, Bossier City, LA 71111
MLS# 21191768Listed by: EPIQUE INC $549,500Active5 beds 4 baths3,919 sq. ft.
304 Tealwood Drive, Bossier City, LA 71111
MLS# 21191604Listed by: DIAMOND REALTY & ASSOCIATES $59,900Pending3 beds 2 baths1,080 sq. ft.
305 Edge Brook, Bossier City, LA 71111
MLS# 21190806Listed by: CENTURY 21 UNITED $619,990Active4 beds 3 baths2,785 sq. ft.
613 Danube Circle, Bossier City, LA 71111
MLS# 21188067Listed by: COLDWELL BANKER APEX, REALTORS $244,445Pending3 beds 2 baths1,490 sq. ft.
811 Venecia Drive, Bossier City, LA 71111
MLS# 21189887Listed by: CICERO REALTY LLC $100,000Active2 beds 1 baths939 sq. ft.
119 Thompson Street, Bossier City, LA 71111
MLS# 21188178Listed by: BERKSHIRE HATHAWAY HOMESERVICES ALLY REAL ESTATE $68,500Active1 beds 1 baths784 sq. ft.
219 1/2 Colquitt Street #5, Bossier City, LA 71111
MLS# 21188260Listed by: BERKSHIRE HATHAWAY HOMESERVICES ALLY REAL ESTATE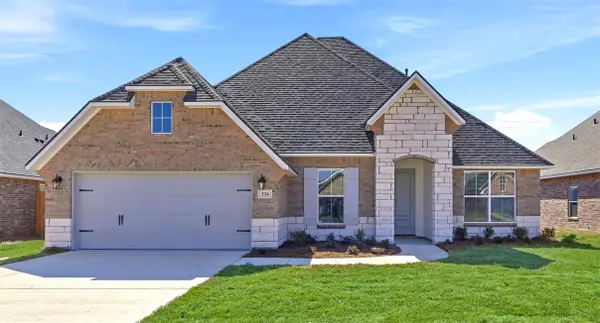 $403,849Active4 beds 3 baths2,387 sq. ft.
334 Prien Lake Loop, Bossier City, LA 71111
MLS# 21189715Listed by: PINNACLE REALTY ADVISORS $234,900Active3 beds 2 baths1,678 sq. ft.
2126 Middle Creek Boulevard, Bossier City, LA 71111
MLS# 21189742Listed by: PINNACLE REALTY ADVISORS $285,000Active4 beds 2 baths1,845 sq. ft.
3301 Colonial Drive, Bossier City, LA 71111
MLS# 21189452Listed by: PINNACLE REALTY ADVISORS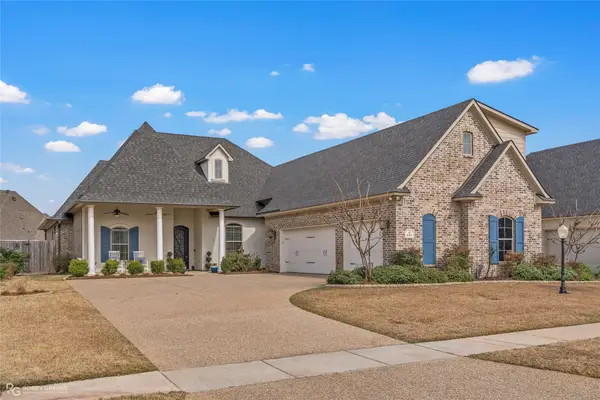 $579,900Pending5 beds 3 baths3,118 sq. ft.
604 Dumaine Drive, Bossier City, LA 71111
MLS# 21184548Listed by: KELLER WILLIAMS NORTHWEST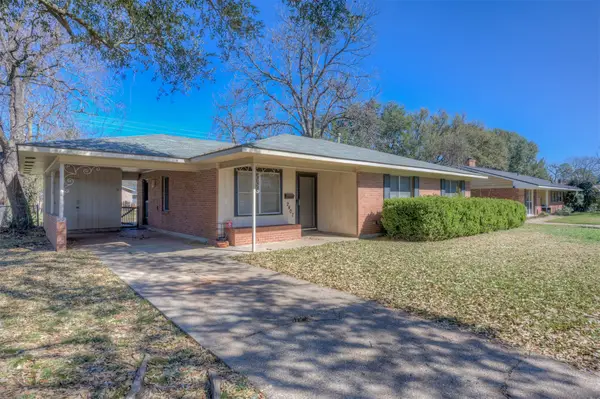 $179,900Pending3 beds 2 baths1,486 sq. ft.
2407 Douglas Drive, Bossier City, LA 71111
MLS# 21187993Listed by: COLDWELL BANKER APEX, REALTORS $249,900Pending3 beds 2 baths1,658 sq. ft.
2502 Downs Street, Bossier City, LA 71111
MLS# 21182561Listed by: TONY DOAN $439,900Pending3 beds 4 baths2,707 sq. ft.
1019 Spanish Moss Circle, Bossier City, LA 71111
MLS# 21184410Listed by: BERKSHIRE HATHAWAY HOMESERVICES ALLY REAL ESTATE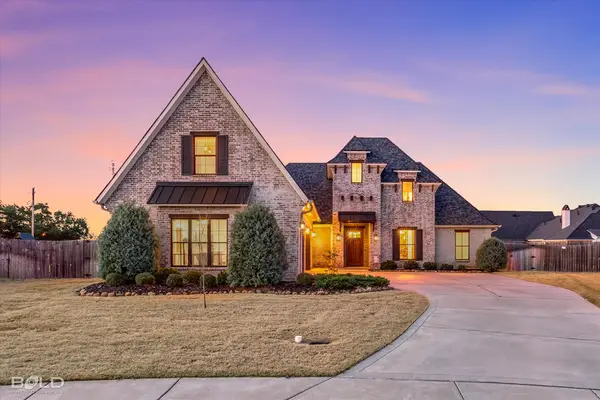 $589,900Active4 beds 3 baths2,800 sq. ft.
612 Corinth Circle, Bossier City, LA 71111
MLS# 21170287Listed by: BERKSHIRE HATHAWAY HOMESERVICES ALLY REAL ESTATE $565,000Active4 beds 3 baths3,679 sq. ft.
520 Canterbury Lane, Bossier City, LA 71111
MLS# 21185459Listed by: RACHEL & CO. REALTY $295,000Active3 beds 2 baths2,655 sq. ft.
1510 Lexington, Bossier City, LA 71111
MLS# 21186599Listed by: CENTURY 21 ELITE $110,000Active3 beds 1 baths1,152 sq. ft.
1316 Lampkin Street, Bossier City, LA 71111
MLS# 21186479Listed by: KELLER WILLIAMS NORTHWEST $128,000Pending3 beds 1 baths1,022 sq. ft.
4517 Donnie Avenue, Bossier City, LA 71111
MLS# 21186252Listed by: IIM REALTY INC $345,000Active3 beds 2 baths1,925 sq. ft.
214 Apalachee Way, Bossier City, LA 71111
MLS# 21185531Listed by: RACHEL & CO. REALTY $314,900Active4 beds 2 baths1,960 sq. ft.
307 Briars Court, Bossier City, LA 71111
MLS# 21183111Listed by: RE/MAX UNITED $105,820Active2 beds 1 baths962 sq. ft.
2567 Broadway Drive, Bossier City, LA 71111
MLS# 21184845Listed by: COLDWELL BANKER APEX, REALTORS $49,999Active3 beds 1 baths1,274 sq. ft.
202 Kelly Street, Bossier City, LA 71111
MLS# 21183557Listed by: BERKSHIRE HATHAWAY HOMESERVICES ALLY REAL ESTATE $167,500Pending2 beds 2 baths1,297 sq. ft.
3636 Greenacres Place #5, Bossier City, LA 71111
MLS# 21182600Listed by: COLDWELL BANKER APEX, REALTORS $375,475Pending4 beds 3 baths2,941 sq. ft.
220 Paisley Drive, Bossier City, LA 71111
MLS# 21182228Listed by: CICERO REALTY LLC $380,000Pending4 beds 2 baths2,035 sq. ft.
5126 Tensas Drive, Bossier City, LA 71111
MLS# 21166688Listed by: BERKSHIRE HATHAWAY HOMESERVICES ALLY REAL ESTATE $365,000Pending3 beds 2 baths1,869 sq. ft.
800 Durango Drive, Bossier City, LA 71111
MLS# 21181795Listed by: PINNACLE REALTY ADVISORS $785,000Active5 beds 4 baths4,014 sq. ft.
105 Esplanade Court, Bossier City, LA 71111
MLS# 21181398Listed by: COLDWELL BANKER APEX, REALTORS $485,000Active4 beds 3 baths2,818 sq. ft.
153 Southwood Drive, Bossier City, LA 71111
MLS# 21180415Listed by: RACHEL & CO. REALTY $352,483Pending4 beds 3 baths2,211 sq. ft.
214 Paisley Lane, Bossier City, LA 71111
MLS# 21178163Listed by: CICERO REALTY LLC $216,500Active3 beds 2 baths1,547 sq. ft.
3120 Stockwell Road, Bossier City, LA 71111
MLS# 21174208Listed by: INFINITY REALTY GROUP OF TEXAS $565,000Active4 beds 3 baths2,854 sq. ft.
586 Corinth Circle, Bossier City, LA 71111
MLS# 21179608Listed by: BERKSHIRE HATHAWAY HOMESERVICES ALLY REAL ESTATE $250,000Active3 beds 2 baths1,601 sq. ft.
5908 Stockwood Street, Bossier City, LA 71111
MLS# 21162500Listed by: CENTURY 21 ELITE $599,900Active3 beds 4 baths2,813 sq. ft.
112 Vieux Carre, Bossier City, LA 71111
MLS# 21175869Listed by: EAST BANK REAL ESTATE $299,000Active3 beds 2 baths1,892 sq. ft.
370 Coppice Place, Bossier City, LA 71111
MLS# 21175645Listed by: DIAMOND REALTY & ASSOCIATES- $258,000Pending4 beds 2 baths1,718 sq. ft.
6012 Whitney Drive, Bossier City, LA 71111
MLS# 21177830Listed by: EPIQUE INC  $559,900Pending4 beds 3 baths2,916 sq. ft.
250 Piccadilly Circle, Bossier City, LA 71111
MLS# 21177583Listed by: PINNACLE REALTY ADVISORS $199,900Active0.4 Acres
1230 Barksdale Boulevard, Bossier City, LA 71111
MLS# 21164700Listed by: BERKSHIRE HATHAWAY HOMESERVICES ALLY REAL ESTATE $379,000Active4 beds 3 baths2,941 sq. ft.
711 Esau Avenue, Bossier City, LA 71111
MLS# 21170872Listed by: PINNACLE REALTY ADVISORS $315,000Active3 beds 2 baths1,640 sq. ft.
119 Andrew Place, Bossier City, LA 71111
MLS# 21175908Listed by: CALL IT CLOSED INTERNATIONAL, INC. $492,000Active17.8 Acres
4950 Benton Road, Benton, LA 71111
MLS# 21173193Listed by: BERKSHIRE HATHAWAY HOMESERVICES ALLY REAL ESTATE $70,000Active3 beds 1 baths1,284 sq. ft.
1509 James Street, Bossier City, LA 71111
MLS# 21174668Listed by: DREAM HOME REALTY, LLC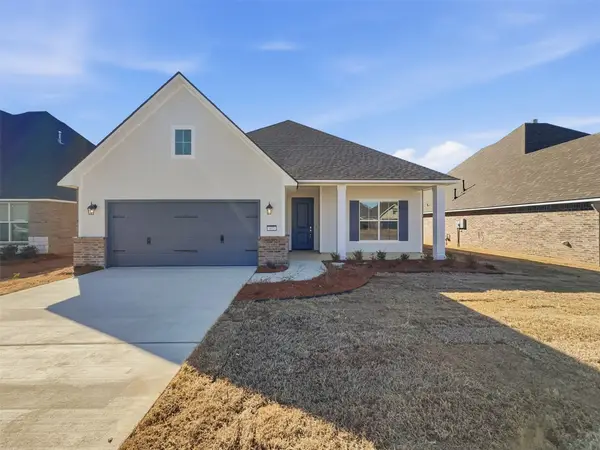 $350,123Active4 beds 2 baths1,957 sq. ft.
332 Prien Lake Loop, Bossier City, LA 71111
MLS# 21174311Listed by: PINNACLE REALTY ADVISORS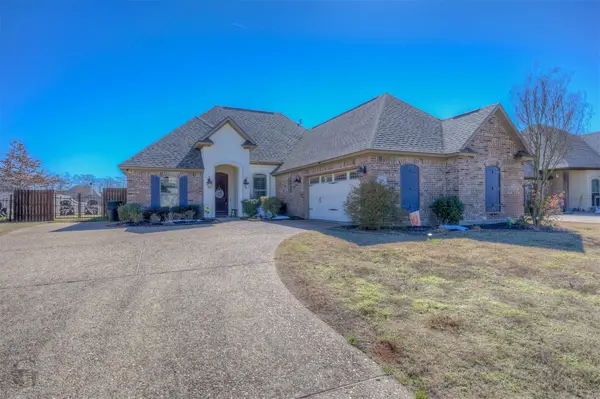 $349,000Active3 beds 2 baths1,842 sq. ft.
234 Arrowhead Drive, Bossier City, LA 71111
MLS# 21174106Listed by: LA STATE REALTY, LLC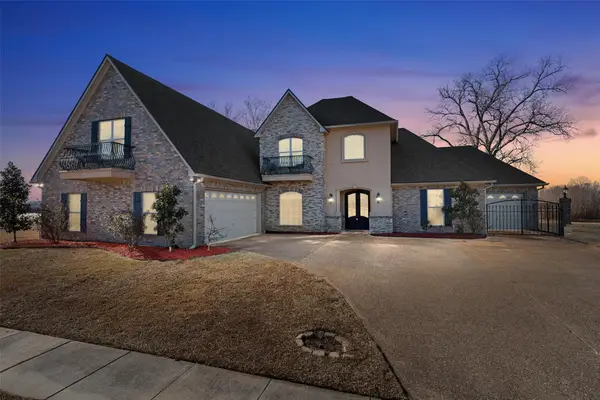 $529,900Pending5 beds 3 baths3,411 sq. ft.
504 Belle Rouge Circle, Bossier City, LA 71111
MLS# 21160016Listed by: RACHEL & CO. REALTY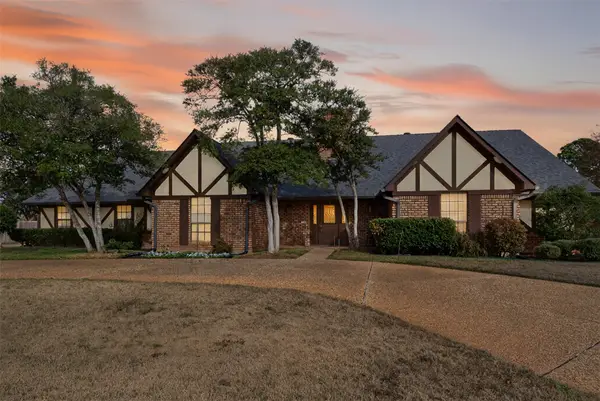 $469,500Active4 beds 4 baths3,776 sq. ft.
110 Southwood Drive, Bossier City, LA 71111
MLS# 21172199Listed by: PINNACLE REALTY ADVISORS $389,900Active4 beds 3 baths2,139 sq. ft.
619 Bitter Pecan Drive, Bossier City, LA 71111
MLS# 21171959Listed by: BERKSHIRE HATHAWAY HOMESERVICES ALLY REAL ESTATE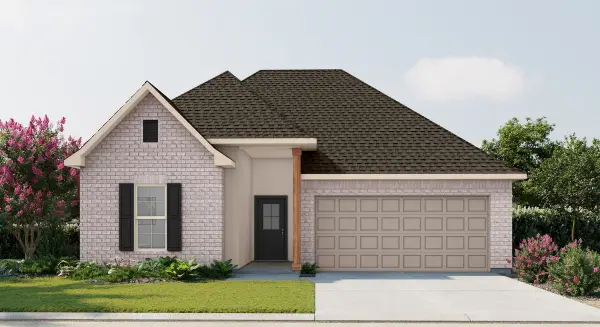 $293,610Active3 beds 2 baths1,848 sq. ft.
746 Crewe Lane, Bossier City, LA 71111
MLS# 21172665Listed by: CICERO REALTY LLC- $139,900Pending2 beds 1 baths1,197 sq. ft.
1308 Becky Street, Bossier City, LA 71111
MLS# 21172065Listed by: BERKSHIRE HATHAWAY HOMESERVICES ALLY REAL ESTATE 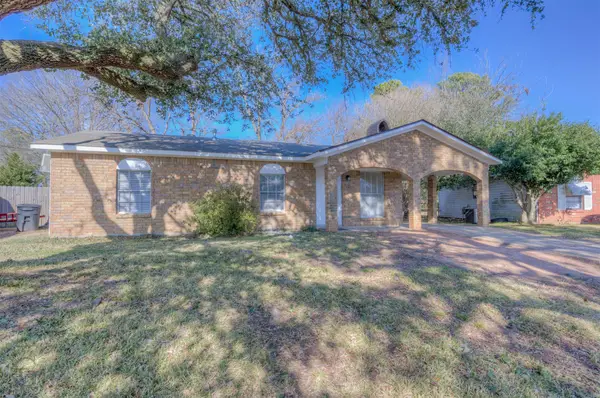 $135,000Active2 beds 2 baths1,330 sq. ft.
4833 Sheryl Street, Bossier City, LA 71111
MLS# 21171413Listed by: 318 REAL ESTATE L.L.C. $270,000Active3 beds 2 baths1,704 sq. ft.
204 Hyperion Street, Bossier City, LA 71111
MLS# 21171625Listed by: RE/MAX REAL ESTATE SERVICES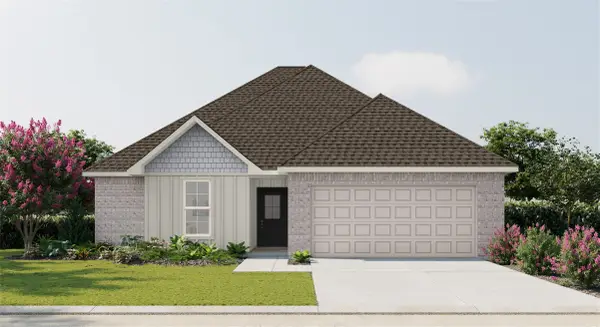 $248,235Active3 beds 2 baths1,564 sq. ft.
757 Venecia Drive, Bossier City, LA 71111
MLS# 21170316Listed by: CICERO REALTY LLC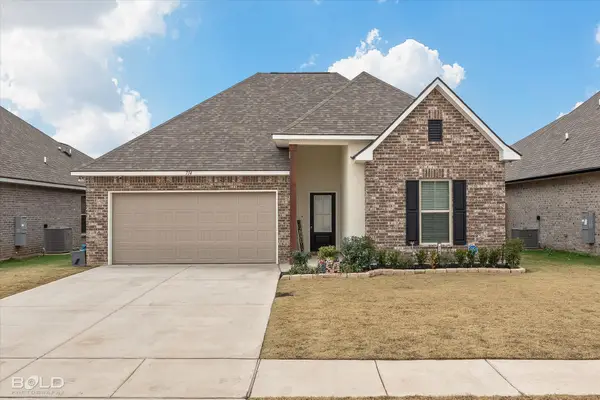 $282,500Active3 beds 2 baths1,848 sq. ft.
714 Crozier Drive, Bossier City, LA 71111
MLS# 21168681Listed by: BERKSHIRE HATHAWAY HOMESERVICES ALLY REAL ESTATE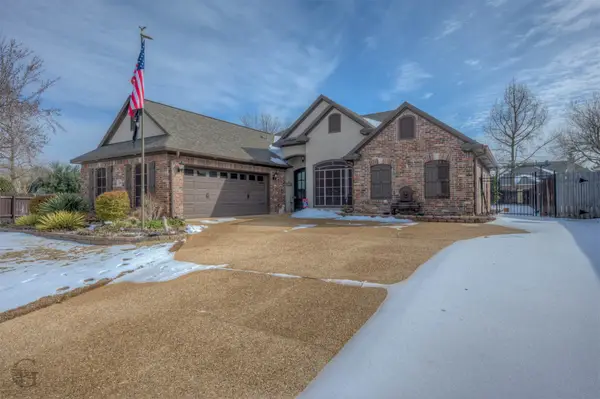 $314,000Active3 beds 2 baths1,787 sq. ft.
201 Ixworth Avenue, Bossier City, LA 71111
MLS# 21169100Listed by: DIAMOND REALTY & ASSOCIATES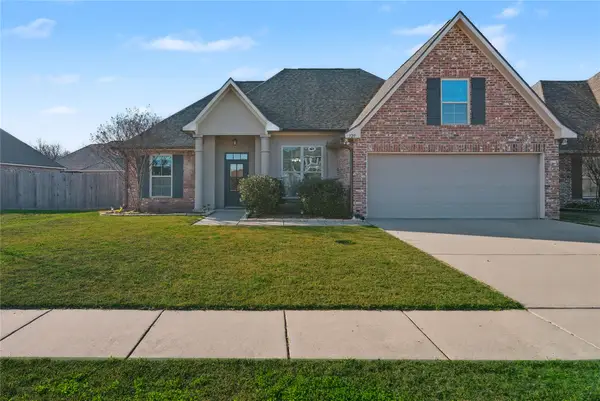 $309,900Active3 beds 2 baths1,925 sq. ft.
329 Camelback Drive, Bossier City, LA 71111
MLS# 21168486Listed by: DIAMOND REALTY & ASSOCIATES $355,500Active4 beds 3 baths3,044 sq. ft.
5516 Hickory Ridge Drive, Bossier City, LA 71111
MLS# 21162558Listed by: DIAMOND REALTY & ASSOCIATES $585,000Active4 beds 3 baths2,848 sq. ft.
168 N Canal Drive, Bossier City, LA 71111
MLS# 21157146Listed by: CALL IT CLOSED INTERNATIONAL, INC. $95,000Active2 beds 1 baths913 sq. ft.
2579 Broadway Drive, Bossier City, LA 71111
MLS# 21161469Listed by: COLDWELL BANKER APEX, REALTORS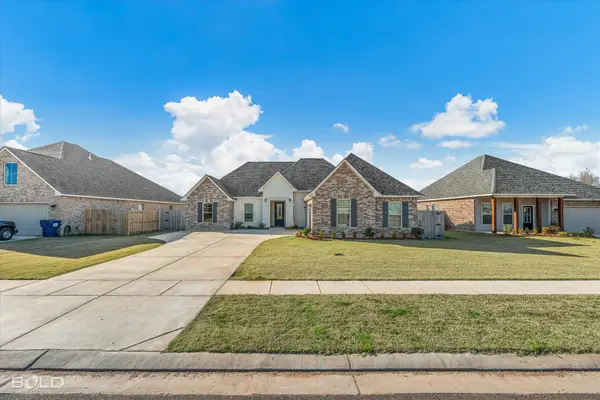 $321,500Pending4 beds 2 baths1,954 sq. ft.
209 Saint Edmunds Way, Bossier City, LA 71111
MLS# 21158665Listed by: BERKSHIRE HATHAWAY HOMESERVICES ALLY REAL ESTATE $399,900Active4 beds 3 baths2,755 sq. ft.
2119 Surrey Lane, Bossier City, LA 71111
MLS# 21159419Listed by: RE/MAX UNITED $73,500Pending4 beds 2 baths1,670 sq. ft.
3126 Malvern Street, Bossier City, LA 71111
MLS# 21159983Listed by: FRIESTAD REALTY $189,000Pending3 beds 2 baths1,356 sq. ft.
3318 Cane Break, Bossier City, LA 71111
MLS# 21160022Listed by: 1 PERCENT LISTS NWLA $425,000Active3 beds 2 baths1,880 sq. ft.
222 Jasmine Walk, Bossier City, LA 71111
MLS# 21144648Listed by: RE/MAX REAL ESTATE SERVICES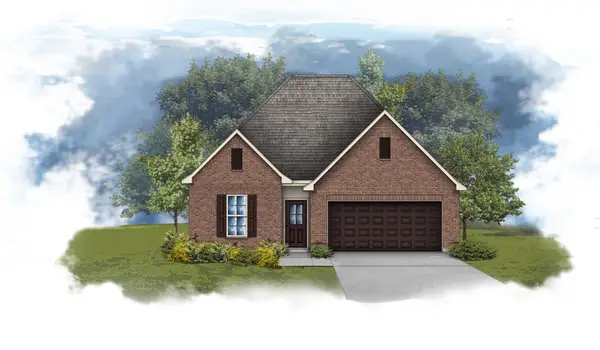 $310,631Pending4 beds 3 baths2,092 sq. ft.
903 Hackberry Drive, Bossier City, LA 71111
MLS# 21157863Listed by: CICERO REALTY LLC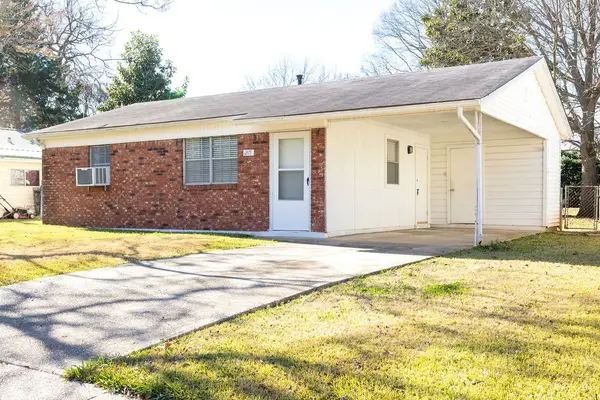 $85,000Active2 beds 1 baths841 sq. ft.
1215 Becky Street, Bossier City, LA 71111
MLS# 21155200Listed by: KELLER WILLIAMS NORTHWEST $389,250Active3 beds 2 baths1,816 sq. ft.
111 Katy Lane, Bossier City, LA 71111
MLS# 21153912Listed by: DIAMOND REALTY & ASSOCIATES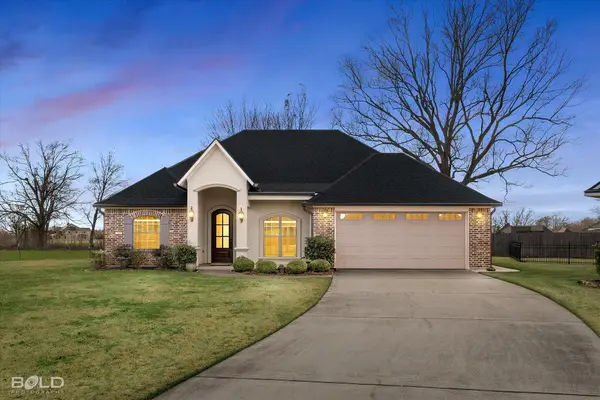 $319,900Active3 beds 2 baths1,809 sq. ft.
240 Rachel Lane, Bossier City, LA 71111
MLS# 21152645Listed by: BERKSHIRE HATHAWAY HOMESERVICES ALLY REAL ESTATE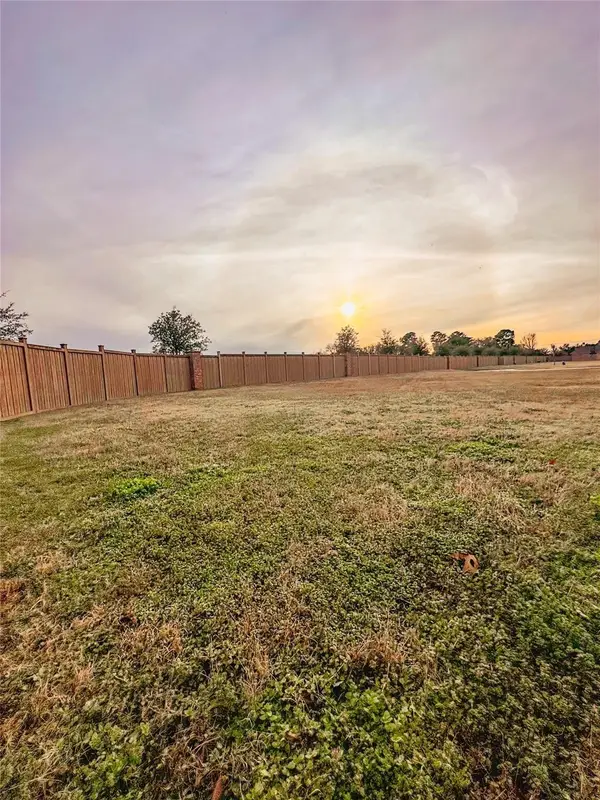 $100,000Active0.29 Acres
100 Heron Walk, Bossier City, LA 71111
MLS# 21199096Listed by: OSBORN HAYS REAL ESTATE, LLC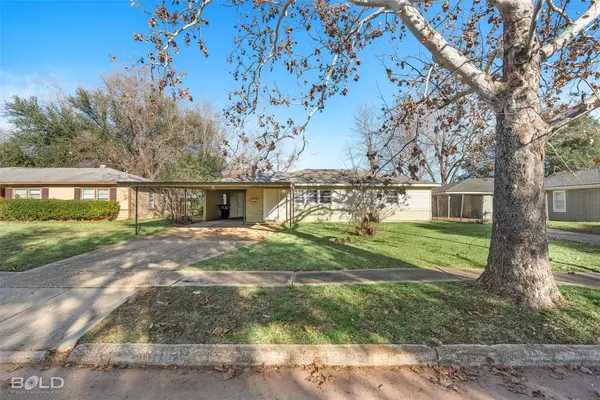 $127,386Pending3 beds 1 baths1,250 sq. ft.
1536 James Street, Bossier City, LA 71111
MLS# 21154342Listed by: PINNACLE REALTY ADVISORS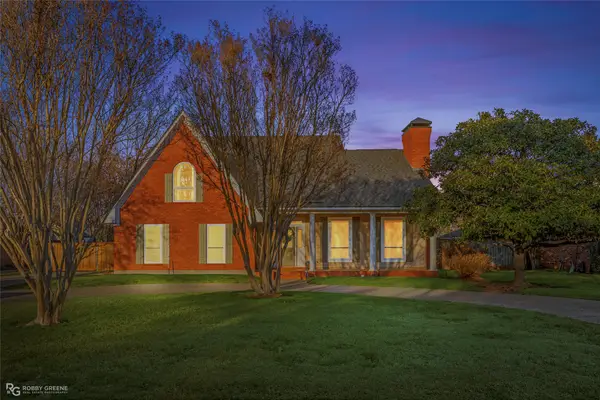 $419,900Active4 beds 3 baths2,724 sq. ft.
339 Greenacres Boulevard, Bossier City, LA 71111
MLS# 21151308Listed by: BERKSHIRE HATHAWAY HOMESERVICES ALLY REAL ESTATE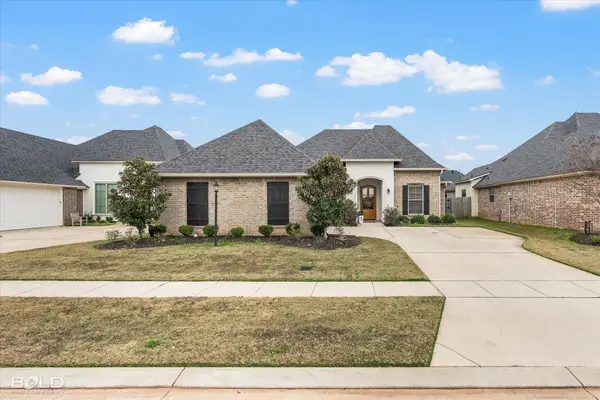 $325,900Active3 beds 2 baths1,812 sq. ft.
5118 Tensas Drive, Bossier City, LA 71111
MLS# 21153126Listed by: PINNACLE REALTY ADVISORS $303,194Active3 beds 2 baths1,848 sq. ft.
300 Bostick Court, Bossier City, LA 71111
MLS# 21152728Listed by: CICERO REALTY LLC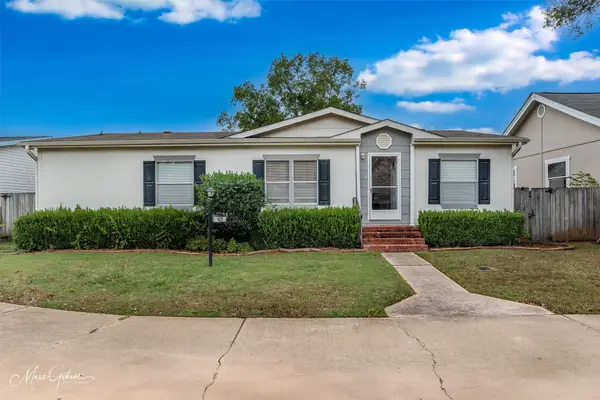 $145,000Pending3 beds 2 baths1,536 sq. ft.
409 Glen Harbor, Bossier City, LA 71111
MLS# 21143042Listed by: EAST BANK REAL ESTATE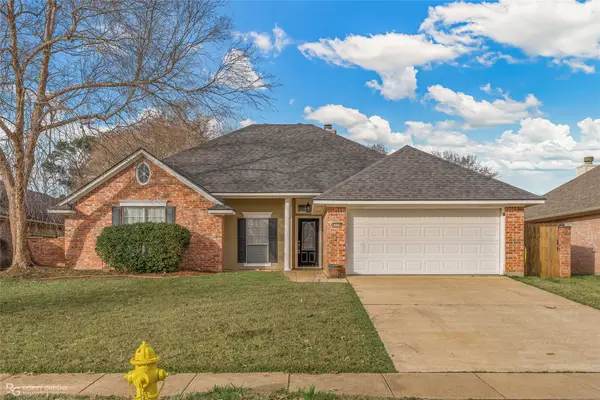 $254,900Active3 beds 2 baths1,671 sq. ft.
6009 Pepperwood Circle, Bossier City, LA 71111
MLS# 21147665Listed by: 318 REAL ESTATE L.L.C.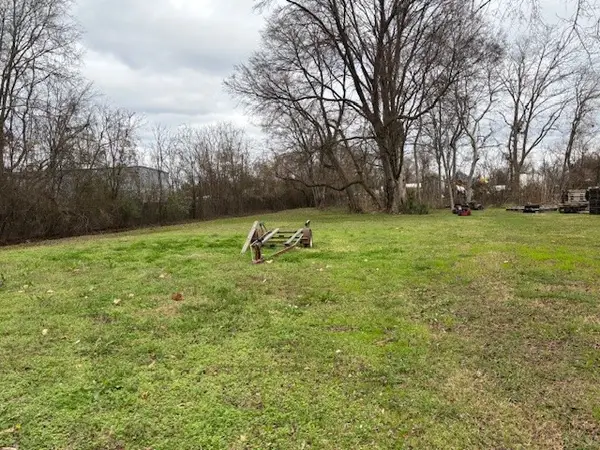 $62,500Active0.34 Acres
1034 Ann Street, Bossier City, LA 71111
MLS# 21151369Listed by: LA STATE REALTY, LLC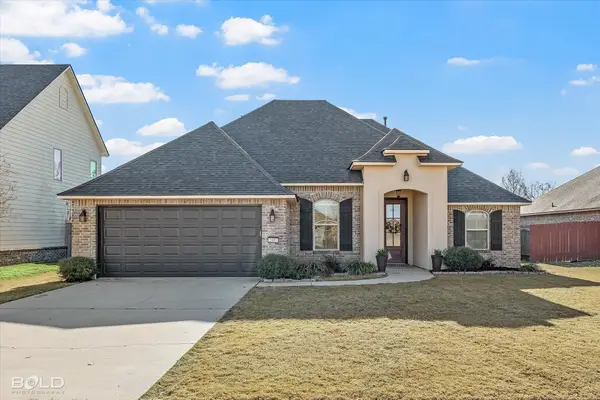 $395,000Active5 beds 4 baths2,497 sq. ft.
2403 Tallgrass Circle, Bossier City, LA 71111
MLS# 21150367Listed by: BERKSHIRE HATHAWAY HOMESERVICES ALLY REAL ESTATE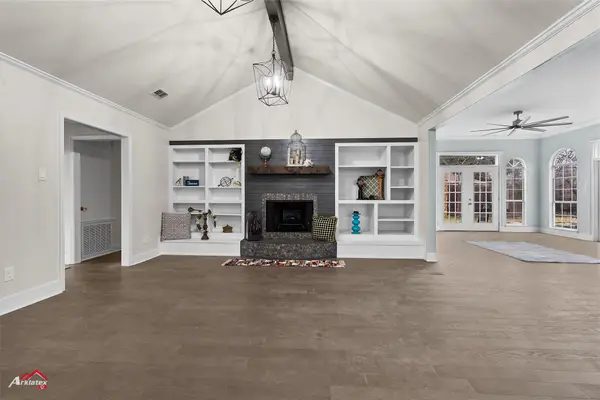 $339,000Active3 beds 2 baths2,251 sq. ft.
5524 Hickory Ridge, Bossier City, LA 71111
MLS# 21150011Listed by: PINNACLE REALTY ADVISORS- Open Thu, 11am to 1:30pm
 $370,000Active4 beds 3 baths2,447 sq. ft.
1034 Maize Street, Bossier City, LA 71111
MLS# 21148271Listed by: BERKSHIRE HATHAWAY HOMESERVICES ALLY REAL ESTATE  $300,000Active4 beds 3 baths1,986 sq. ft.
519 Brompton Lane, Bossier City, LA 71111
MLS# 21148510Listed by: EPIQUE INC $595,400Active4 beds 3 baths2,600 sq. ft.
610 Danube Circle, Bossier City, LA 71111
MLS# 21148710Listed by: RE/MAX REAL ESTATE SERVICES $289,999Active3 beds 2 baths2,015 sq. ft.
6014 Braeburn Court, Bossier City, LA 71111
MLS# 21146932Listed by: BERKSHIRE HATHAWAY HOMESERVICES ALLY REAL ESTATE $164,999Active3 beds 1 baths1,295 sq. ft.
2400 Broadway Drive, Bossier City, LA 71111
MLS# 21144664Listed by: BERKSHIRE HATHAWAY HOMESERVICES ALLY REAL ESTATE $264,900Active3 beds 2 baths1,706 sq. ft.
6020 Applegate Circle, Bossier City, LA 71111
MLS# 21145131Listed by: NEW COVENANT REALTY $349,900Active4 beds 2 baths1,983 sq. ft.
5116 Tensas Drive, Bossier City, LA 71111
MLS# 21142965Listed by: COLDWELL BANKER APEX, REALTORS $529,900Active4 beds 3 baths3,070 sq. ft.
101 Stonebridge Boulevard, Bossier City, LA 71111
MLS# 21141080Listed by: CENTURY 21 ELITE $395,000Pending3 beds 2 baths1,868 sq. ft.
460 Stacey Lane, Bossier City, LA 71111
MLS# 21136632Listed by: BERKSHIRE HATHAWAY HOMESERVICES ALLY REAL ESTATE- $32,000Active2 beds 1 baths888 sq. ft.
643 Yarborough Street, Bossier City, LA 71111
MLS# 21139881Listed by: PINNACLE REALTY ADVISORS  $309,900Active3 beds 2 baths1,984 sq. ft.
818 Abita Drive, Bossier City, LA 71111
MLS# 21137583Listed by: IMPERIAL REALTY GROUP $199,900Active3 beds 2 baths1,628 sq. ft.
2403 Douglas Drive, Bossier City, LA 71111
MLS# 21138534Listed by: COLDWELL BANKER APEX, REALTORS $110,000Active3 beds 1 baths1,077 sq. ft.
2420 Northside Drive, Bossier City, LA 71111
MLS# 21131486Listed by: PINNACLE REALTY ADVISORS $235,000Active3 beds 2 baths1,229 sq. ft.
3303 Grand Lake Drive, Bossier City, LA 71111
MLS# 21131670Listed by: RE/MAX REAL ESTATE SERVICES $595,000Active4 beds 4 baths2,840 sq. ft.
470 Long Acre Drive, Bossier City, LA 71111
MLS# 21129532Listed by: DIAMOND REALTY & ASSOCIATES $189,900Active0.49 Acres
138 Heron Walk, Bossier City, LA 71111
MLS# 21130283Listed by: EAST BANK REAL ESTATE $293,000Active3 beds 2 baths1,787 sq. ft.
507 Toulouse Court, Bossier City, LA 71111
MLS# 21127313Listed by: CENTURY 21 ELITE $300,000Active4 beds 3 baths1,851 sq. ft.
703 Crozier Drive, Bossier City, LA 71111
MLS# 21127457Listed by: BERKSHIRE HATHAWAY HOMESERVICES ALLY REAL ESTATE $575,000Pending4 beds 4 baths4,514 sq. ft.
101 Woodvale Creek, Bossier City, LA 71111
MLS# 21123145Listed by: COLDWELL BANKER APEX, REALTORS $699,900Pending4 beds 4 baths3,416 sq. ft.
254 Lafitte Road, Bossier City, LA 71111
MLS# 21120152Listed by: RE/MAX REAL ESTATE SERVICES $599,000Active5 beds 5 baths3,748 sq. ft.
2481 Churchill Drive, Bossier City, LA 71111
MLS# 21119879Listed by: COLDWELL BANKER APEX, REALTORS $295,823Active3 beds 2 baths1,848 sq. ft.
209 Paisley Lane, Bossier City, LA 71111
MLS# 21120238Listed by: CICERO REALTY LLC $99,900Pending2 beds 2 baths1,044 sq. ft.
5705 E Texas Street #80, Bossier City, LA 71111
MLS# 21118047Listed by: EAST BANK REAL ESTATE $279,328Active3 beds 2 baths1,656 sq. ft.
211 Paisley Lane, Bossier City, LA 71111
MLS# 21119827Listed by: CICERO REALTY LLC $265,000Pending3 beds 3 baths1,676 sq. ft.
606 Perfect Place, Bossier City, LA 71111
MLS# 21119467Listed by: DIAMOND REALTY & ASSOCIATES $317,000Active3 beds 2 baths1,848 sq. ft.
512 Chinquipin Drive, Bossier City, LA 71111
MLS# 21117907Listed by: EAST BANK REAL ESTATE $367,500Active4 beds 2 baths2,470 sq. ft.
105 Downing Court, Bossier City, LA 71111
MLS# 21116993Listed by: FREEDOM REALTY $301,072Pending3 beds 2 baths1,925 sq. ft.
730 Crewe Lane, Bossier City, LA 71111
MLS# 21116166Listed by: CICERO REALTY LLC $262,320Active3 beds 2 baths1,690 sq. ft.
759 Venecia Drive, Bossier City, LA 71111
MLS# 21116187Listed by: CICERO REALTY LLC $259,900Active3 beds 2 baths1,776 sq. ft.
5191 Tara Lane, Bossier City, LA 71111
MLS# 21115935Listed by: DIAMOND REALTY & ASSOCIATES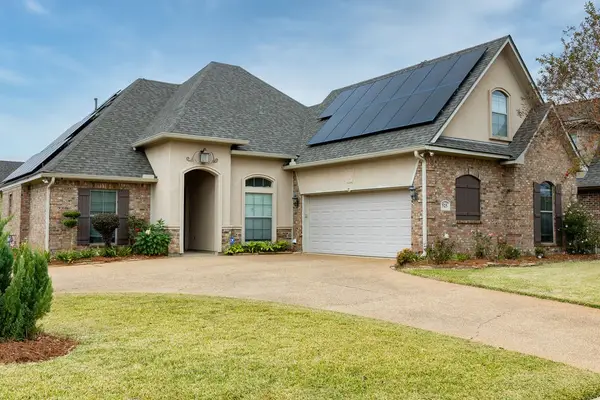 $350,000Active4 beds 3 baths2,153 sq. ft.
525 Tupelo Drive, Bossier City, LA 71111
MLS# 21107432Listed by: KELLER WILLIAMS NORTHWEST $250,000Active3 beds 2 baths1,340 sq. ft.
3489 Grand Cane Lane, Bossier City, LA 71111
MLS# 21112753Listed by: PINNACLE REALTY ADVISORS $154,900Active3 beds 2 baths1,463 sq. ft.
2524 Belmont Boulevard, Bossier City, LA 71111
MLS# 21111662Listed by: DIAMOND REALTY & ASSOCIATES $880,000Active5 beds 5 baths4,450 sq. ft.
1171 Wemple Road, Bossier City, LA 71111
MLS# 21110716Listed by: DIAMOND REALTY & ASSOCIATES $95,000Active0.18 Acres
0 Shed Road, Bossier City, LA 71111
MLS# 21110150Listed by: COLDWELL BANKER APEX, REALTORS $735,000Active4 beds 4 baths3,080 sq. ft.
329 Autumn Ridge Drive, Bossier City, LA 71111
MLS# 21109683Listed by: PINNACLE REALTY ADVISORS $148,500Active4 beds 1 baths1,500 sq. ft.
1301 Meadowview Drive, Bossier City, LA 71111
MLS# 21104422Listed by: RE/MAX EXECUTIVE REALTY $320,000Pending4 beds 3 baths1,908 sq. ft.
613 Alder Lane, Bossier City, LA 71111
MLS# 21108695Listed by: PINNACLE REALTY ADVISORS $268,000Pending3 beds 2 baths1,901 sq. ft.
6014 Ellington Way, Bossier City, LA 71111
MLS# 21175617Listed by: BERKSHIRE HATHAWAY HOMESERVICES ALLY REAL ESTATE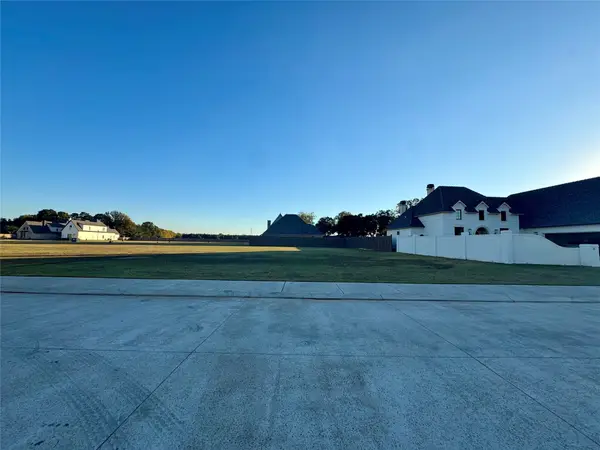 $120,000Active0.26 Acres
312 Nightfall Court, Bossier City, LA 71111
MLS# 21107299Listed by: PINNACLE REALTY ADVISORS $300,000Active1.3 Acres
1250 E Texas Street, Bossier City, LA 71111
MLS# 21106714Listed by: CALL IT CLOSED INTERNATIONAL, INC.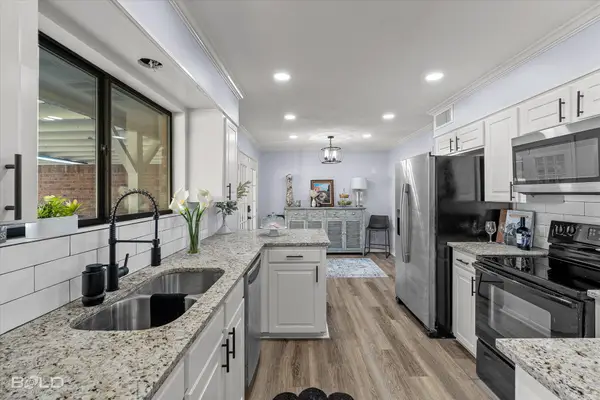 $385,000Active4 beds 2 baths2,363 sq. ft.
5505 Hickory Ridge Drive, Bossier City, LA 71111
MLS# 21151287Listed by: PINNACLE REALTY ADVISORS $250,000Active4 beds 2 baths1,638 sq. ft.
1407 Edgemont Circle, Bossier City, LA 71111
MLS# 21079963Listed by: BETTER HOMES AND GARDENS REAL ESTATE RHODES REALTY $379,000Active4 beds 3 baths2,404 sq. ft.
537 Chinquipin Drive, Bossier City, LA 71111
MLS# 21103694Listed by: STERLING & SOUTHERN REAL ESTATE CO. LLC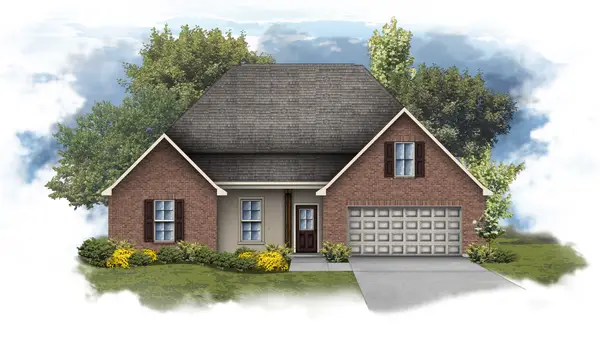 $318,963Pending4 beds 2 baths2,204 sq. ft.
729 Crewe Lane, Bossier City, LA 71111
MLS# 21104089Listed by: CICERO REALTY LLC $364,000Active4 beds 4 baths2,962 sq. ft.
302 Greenacres Boulevard, Bossier City, LA 71111
MLS# 21188552Listed by: COLDWELL BANKER APEX, REALTORS $275,000Pending3 beds 2 baths1,583 sq. ft.
840 Entrada Street, Bossier City, LA 71111
MLS# 21101464Listed by: DIAMOND REALTY & ASSOCIATES $140,000Pending3 beds 2 baths1,226 sq. ft.
1503 Leslie Street, Bossier City, LA 71111
MLS# 21100489Listed by: RE/MAX EXECUTIVE REALTY $282,000Active4 beds 2 baths1,981 sq. ft.
2116 Middle Creek Boulevard, Bossier City, LA 71111
MLS# 21099515Listed by: DIAMOND REALTY & ASSOCIATES- $300,000Active3 Acres
3945 Old Shed Road, Bossier City, LA 71111
MLS# 21099675Listed by: 1 PERCENT LISTS NWLA  $322,603Active4 beds 2 baths1,705 sq. ft.
331 Prien Lake Loop, Bossier City, LA 71111
MLS# 21099154Listed by: KELLER WILLIAMS NORTHWEST $729,000Active4 beds 6 baths3,487 sq. ft.
555 Canterbury Lane, Bossier City, LA 71111
MLS# 21097393Listed by: PINNACLE REALTY ADVISORS $370,398Pending4 beds 3 baths2,941 sq. ft.
745 Crewe Lane, Bossier City, LA 71111
MLS# 21097331Listed by: CICERO REALTY LLC $299,900Active3 beds 2 baths2,053 sq. ft.
310 Lancashire Drive, Bossier City, LA 71111
MLS# 21191726Listed by: DIAMOND REALTY & ASSOCIATES $279,000Active3 beds 2 baths1,768 sq. ft.
2200 Middle Creek Boulevard, Bossier City, LA 71111
MLS# 21094362Listed by: COLDWELL BANKER APEX, REALTORS $50,000Active0.16 Acres
0 W Bevly, Bossier City, LA 71111
MLS# 21095398Listed by: CENTURY 21 ELITE $40,000Active0.15 Acres
0 Bevly, Bossier City, LA 71111
MLS# 21095411Listed by: CENTURY 21 ELITE $47,000Active2 beds 1 baths1,114 sq. ft.
223 Edwards Street, Bossier City, LA 71111
MLS# 21094138Listed by: CITYVIEW REALTY LLC $214,900Pending3 beds 3 baths1,782 sq. ft.
3635 Greenacres Place Drive #350, Bossier City, LA 71111
MLS# 21093966Listed by: CENTURY 21 ELITE $739,900Active4 beds 4 baths3,650 sq. ft.
402 Erie Circle, Bossier City, LA 71111
MLS# 21087984Listed by: BERKSHIRE HATHAWAY HOMESERVICES ALLY REAL ESTATE $125,000Active0.79 Acres
0 Victorias, Bossier City, LA 71111
MLS# 21089552Listed by: BERKSHIRE HATHAWAY HOMESERVICES ALLY REAL ESTATE $489,900Active4 beds 4 baths3,314 sq. ft.
527 Canterbury Lane, Bossier City, LA 71111
MLS# 21088610Listed by: PELICAN REALTY ADVISORS $210,000Active3 beds 2 baths1,480 sq. ft.
2602 Ashland Avenue, Bossier City, LA 71111
MLS# 21088726Listed by: LARK REALTY $295,297Active3 beds 2 baths1,848 sq. ft.
737 Crewe Lane, Bossier City, LA 71111
MLS# 21086558Listed by: CICERO REALTY LLC $386,000Active4 beds 3 baths2,179 sq. ft.
605 Bitter Pecan Drive, Bossier City, LA 71111
MLS# 21081960Listed by: MAHONEY ELITE REALTY, LLC $535,000Active5 beds 4 baths3,950 sq. ft.
509 Secret Cove, Bossier City, LA 71111
MLS# 21071816Listed by: PINNACLE REALTY ADVISORS $689,900Active5 beds 4 baths3,021 sq. ft.
589 Corinth Circle, Bossier City, LA 71111
MLS# 21072854Listed by: RE/MAX REAL ESTATE SERVICES $485,000Active3 beds 3 baths3,857 sq. ft.
107 Lakewood Point Drive, Bossier City, LA 71111
MLS# 21067627Listed by: DIAMOND REALTY & ASSOCIATES $461,000Pending5 beds 4 baths2,947 sq. ft.
307 Tealwood Drive, Bossier City, LA 71111
MLS# 21057069Listed by: COLDWELL BANKER APEX, REALTORS $266,510Pending4 beds 3 baths1,788 sq. ft.
785 Venecia Drive, Bossier City, LA 71111
MLS# 21060248Listed by: CICERO REALTY LLC $319,000Pending3 beds 2 baths1,962 sq. ft.
804 Abita Chase, Bossier City, LA 71111
MLS# 21048501Listed by: BERKSHIRE HATHAWAY HOMESERVICES ALLY REAL ESTATE $114,900Active3 beds 1 baths1,048 sq. ft.
1534 James Street, Bossier City, LA 71111
MLS# 21047645Listed by: PINNACLE REALTY ADVISORS $625,000Active4 beds 4 baths2,747 sq. ft.
749 Duckwater Landing, Bossier City, LA 71111
MLS# 21199117Listed by: OSBORN HAYS REAL ESTATE, LLC $248,000Pending3 beds 2 baths1,612 sq. ft.
2608 Brown Street, Bossier City, LA 71111
MLS# 21048740Listed by: CENTURY 21 ELITE $344,900Active3 beds 3 baths2,861 sq. ft.
5407 Coach Road, Bossier City, LA 71111
MLS# 21035662Listed by: COLDWELL BANKER APEX, REALTORS $775,000Active4 beds 4 baths3,758 sq. ft.
105 Calais Court, Bossier City, LA 71111
MLS# 21193968Listed by: PINNACLE REALTY ADVISORS $355,000Active4 Acres
0 Cardnell Road, Bossier City, LA 71111
MLS# 21045876Listed by: PINNACLE REALTY ADVISORS $459,000Active4 beds 2 baths2,255 sq. ft.
305 Tottenham Court, Bossier City, LA 71111
MLS# 21038390Listed by: CENTURY 21 UNITED $175,000Active3 beds 2 baths1,332 sq. ft.
2526 Belmont Boulevard, Bossier City, LA 71111
MLS# 21040668Listed by: STERLING & SOUTHERN REAL ESTATE CO. LLC $459,000Active3 beds 2 baths1,610 sq. ft.
4938 Swan Lake Road, Bossier City, LA 71111
MLS# 21028653Listed by: SUSANNAH HODGES, LLC $69,900Active0.41 Acres
759 Duckwater Landing, Bossier City, LA 71111
MLS# 21023726Listed by: SOUTHERN REALTY SERVICES LLC $643,500Active9.92 Acres
0 Barksdale Boulevard, Bossier City, LA 71172
MLS# 2515571Listed by: CENTURY 21 ELITE $425,000Active4 beds 2 baths2,054 sq. ft.
4735 Rebouche Road, Bossier City, LA 71111
MLS# 20991273Listed by: CALL IT CLOSED INTERNATIONAL, INC. $303,835Active3 beds 2 baths1,925 sq. ft.
494 Blanchard Loop, Bossier City, LA 71111
MLS# 21014528Listed by: CICERO REALTY LLC $309,000Active3 beds 3 baths3,195 sq. ft.
2300 Belmont Boulevard, Bossier City, LA 71111
MLS# 21009181Listed by: DIAMOND REALTY & ASSOCIATES $824,999Active4 beds 4 baths3,063 sq. ft.
305 Nightfall Court, Bossier City, LA 71111
MLS# 21008314Listed by: BERKSHIRE HATHAWAY HOMESERVICES ALLY REAL ESTATE $575,000Active4 beds 4 baths3,288 sq. ft.
4743 Old Brownlee Road, Bossier City, LA 71111
MLS# 21007704Listed by: REALTY 1 OF SHREVEPORT/BOSSIER, LLC. $179,000Active3 beds 2 baths1,503 sq. ft.
2526 Downs Circle, Bossier City, LA 71111
MLS# 21159893Listed by: KELLER WILLIAMS NORTHWEST $39,000Pending0.79 Acres
0 River Bluff #Lot 15, Bossier City, LA 71111
MLS# 21005253Listed by: STEVENS SOUTHERN PROPERTIES $419,900Active4 beds 2 baths1,912 sq. ft.
449 Stacey Lane, Bossier City, LA 71111
MLS# 21001795Listed by: PINNACLE REALTY ADVISORS $170,000Pending2 beds 2 baths1,297 sq. ft.
3636 Greenacres Place Drive #113, Bossier City, LA 71111
MLS# 20999032Listed by: PINNACLE REALTY ADVISORS $327,590Pending4 beds 2 baths2,050 sq. ft.
482 Blanchard Loop, Bossier City, LA 71111
MLS# 20996421Listed by: CICERO REALTY LLC $495,000Active5.6 Acres
00001 Shed, Bossier City, LA 71111
MLS# 20995290Listed by: OSBORN HAYS REAL ESTATE, LLC $369,900Active3 beds 2 baths2,354 sq. ft.
1705 Wales Lane, Bossier City, LA 71111
MLS# 20994553Listed by: EXP REALTY, LLC $10,000Pending0.07 Acres
105 Adair Street, Bossier City, LA 71111
MLS# 20989735Listed by: RE/MAX UNITED $549,000Active5 beds 3 baths3,348 sq. ft.
628 Dumaine Drive, Bossier City, LA 71111
MLS# 20974903Listed by: COLDWELL BANKER APEX, REALTORS $315,900Active4 beds 2 baths1,954 sq. ft.
657 Alder Lane, Bossier City, LA 71111
MLS# 20974120Listed by: COLDWELL BANKER APEX, REALTORS $1,800,000Active0.46 Acres
0 Airline Drive, Bossier City, LA 71111
MLS# 20977256Listed by: EXP REALTY, LLC $59,900Active0.19 Acres
210 Overbrook, Bossier City, LA 71111
MLS# 20975953Listed by: PINNACLE REALTY ADVISORS- $59,900Active0.19 Acres
212 Overbrook, Bossier City, LA 71111
MLS# 20975956Listed by: PINNACLE REALTY ADVISORS  $90,000Pending0.65 Acres
4748 Old Brownlee Road, Bossier City, LA 71111
MLS# 20962076Listed by: RE/MAX REAL ESTATE SERVICES $320,000Active4 beds 2 baths2,270 sq. ft.
4002 Wilderness Lane, Bossier City, LA 71111
MLS# 20948009Listed by: BERKSHIRE HATHAWAY HOMESERVICES ALLY REAL ESTATE $274,900Active2 beds 2 baths1,619 sq. ft.
111 Rachel Lane, Bossier City, LA 71111
MLS# 20946385Listed by: DIAMOND REALTY & ASSOCIATES $599,000Active5 beds 5 baths4,676 sq. ft.
520 Parklane Drive, Bossier City, LA 71111
MLS# 21082668Listed by: PINNACLE REALTY ADVISORS $225,000Active1.14 Acres
0 Viking Drive, Bossier City, LA 71111
MLS# 20935907Listed by: CENTURY 21 ELITE $299,999Active4 beds 3 baths2,193 sq. ft.
3635 Greenacres Place Drive #336, Bossier City, LA 71111
MLS# 20933265Listed by: CENTURY 21 ELITE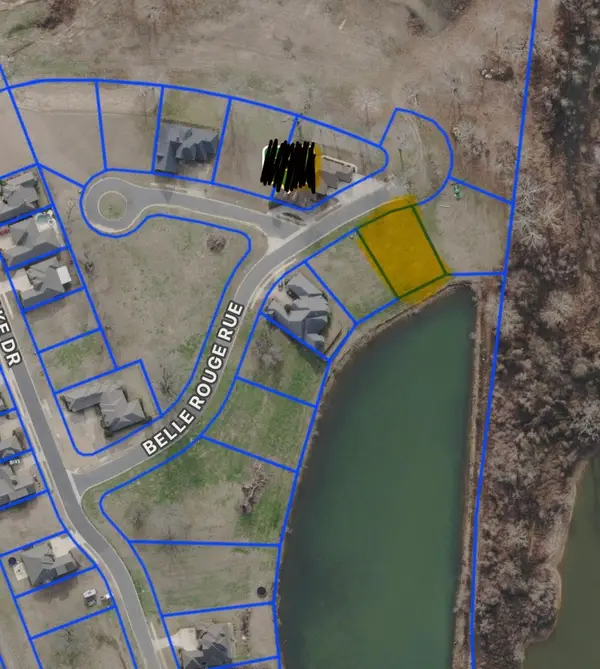 $65,000Active0.55 Acres
0 Belle Rouge, Bossier City, LA 71111
MLS# 20927119Listed by: PINNACLE REALTY ADVISORS- New
 $122,900Active0.24 Acres
416 Archway, Bossier City, LA 71111
MLS# 21215666Listed by: RACHEL & CO. REALTY  $49,900Active0.24 Acres
0 0 Loit 45a Bevly Lake Road, Bossier City, LA 71111
MLS# 20914040Listed by: EXP REALTY, LLC $99,900Active0.37 Acres
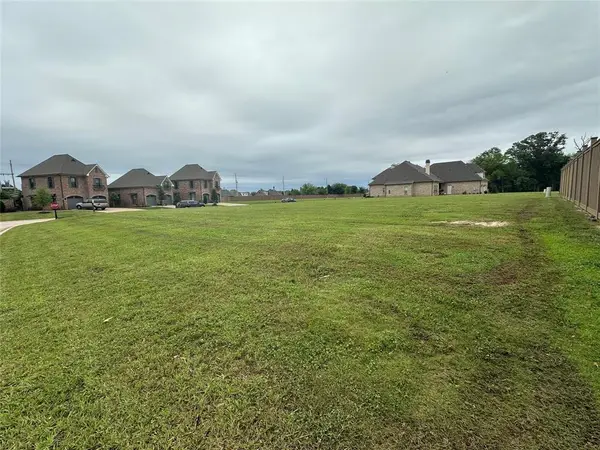
0 Belle Rouge Circle, Bossier City, LA 71111
MLS# 20914051Listed by: EXP REALTY, LLC $99,900Active0.25 Acres
0 Lot 19 Belle Rouge Circle, Bossier City, LA 71111
MLS# 20914054Listed by: EXP REALTY, LLC $139,000Active0.43 Acres
0 Bevly Lake Drive, Bossier City, LA 71111
MLS# 20914037Listed by: EXP REALTY, LLC $349,977Active4 beds 3 baths2,242 sq. ft.
606 Glenshire Drive, Bossier City, LA 71111
MLS# 20900632Listed by: EAST BANK REAL ESTATE $499,900Active0.65 Acres
2705 Valkyrie Drive, Bossier City, LA 71111
MLS# 20890897Listed by: EXP REALTY, LLC $899,000Active0 Acres
4400 Airline Drive, Bossier City, LA 71111
MLS# 20890868Listed by: EXP REALTY, LLC $440,000Pending4 beds 3 baths2,841 sq. ft.
339 Hunters Hollow, Bossier City, LA 71111
MLS# 20884009Listed by: COLDWELL BANKER APEX, REALTORS $65,600Active0.41 Acres
18 Duckwater Landing, Bossier City, LA 71111
MLS# 20869159Listed by: CENTURY 21 UNITED $63,100Active0.4 Acres
35 Duckwater Landing, Bossier City, LA 71111
MLS# 20869294Listed by: CENTURY 21 UNITED $675,000Active4 beds 3 baths3,623 sq. ft.
704 Calcasieu Pass, Bossier City, LA 71111
MLS# 20850621Listed by: EXP REALTY, LLC $299,000Active4 beds 2 baths1,791 sq. ft.
208 Ixworth Avenue, Bossier City, LA 71111
MLS# 21072481Listed by: PRIMEAUX REALTY, LLC $1,195,000Active5 beds 4 baths5,211 sq. ft.
200 Evangeline Walk, Bossier City, LA 71111
MLS# 21145714Listed by: RE/MAX REAL ESTATE SERVICES $379,900Pending3 beds 2 baths1,745 sq. ft.
143 Arbor Place, Bossier City, LA 71111
MLS# 20814168Listed by: RE/MAX REAL ESTATE SERVICES $429,900Active4 beds 3 baths2,795 sq. ft.
50 Turnbury Drive, Bossier City, LA 71111
MLS# 20804637Listed by: RIZEN REALTY, LLC $340,000Pending3 beds 2 baths2,477 sq. ft.
114 Sussex, Bossier City, LA 71111
MLS# 21121313Listed by: CENTURY 21 UNITED $159,000Active0.58 Acres
5410 Benton Road, Bossier City, LA 71111
MLS# 20779502Listed by: PRIMEAUX REALTY, LLC $200,000Pending3 beds 2 baths1,675 sq. ft.
409 Summit Drive, Bossier City, LA 71111
MLS# 21091718Listed by: BERKSHIRE HATHAWAY HOMESERVICES ALLY REAL ESTATE $91,820Active0.53 Acres
4650 Brandon Spur, Bossier City, LA 71111
MLS# 20740650Listed by: OSBORN HAYS REAL ESTATE, LLC $465,000Active3 beds 3 baths3,083 sq. ft.
12 Chez Moi Drive, Bossier City, LA 71111
MLS# 20722455Listed by: RACHEL & CO. REALTY $335,000Pending4 beds 3 baths2,265 sq. ft.
360 Coppice Place, Bossier City, LA 71111
MLS# 20972347Listed by: PINNACLE REALTY ADVISORS $419,200Active4 beds 3 baths2,096 sq. ft.
5132 Tensas Drive, Bossier City, LA 71111
MLS# 21048330Listed by: DIAMOND REALTY & ASSOCIATES $434,900Pending4 beds 2 baths2,015 sq. ft.
923 Chisolm Trail, Bossier City, LA 71111
MLS# 21190106Listed by: RE/MAX REAL ESTATE SERVICES $63,100Active0.4 Acres
24 Duckwater Landing, Bossier City, LA 71111
MLS# 20562091Listed by: CENTURY 21 UNITED $63,100Active0.42 Acres
23 Duckwater Landing, Bossier City, LA 71111
MLS# 20562075Listed by: CENTURY 21 UNITED $65,600Active0.41 Acres
6 Duckwater Landing, Bossier City, LA 71111
MLS# 20561925Listed by: CENTURY 21 UNITED $65,600Active0.41 Acres
7 Duckwater Landing, Bossier City, LA 71111
MLS# 20561974Listed by: CENTURY 21 UNITED $120,000Active0.39 Acres
0 Bridgepoint Circle, Bossier City, LA 71111
MLS# 20561653Listed by: COLDWELL BANKER APEX, REALTORS $1,200,000Active3.63 Acres
3629 Shed, Bossier City, LA 71111
MLS# 20533833Listed by: COLDWELL BANKER APEX, REALTORS $1,450,000Active2 Acres
1756 Swan Lake Road, Bossier City, LA 71111
MLS# 20526382Listed by: BERKSHIRE HATHAWAY HOMESERVICES ALLY REAL ESTATE $473,000Active0.54 Acres
0 Scarlett Drive, Bossier City, LA 71111
MLS# 21172437Listed by: 318 REAL ESTATE L.L.C. $245,000Active3 beds 2 baths1,623 sq. ft.
2050 Stockwell Road #4, Bossier City, LA 71111
MLS# 20817464Listed by: EXP REALTY, LLC $990,000Active4 beds 6 baths3,850 sq. ft.
115 Overbrook Lane, Bossier City, LA 71111
MLS# 21151890Listed by: PINNACLE REALTY ADVISORS $250,000Active0.34 Acres
501 Ogilive, Bossier City, LA 71111
MLS# 20418443Listed by: CENTURY 21 UNITED $217,500Pending3 beds 2 baths1,666 sq. ft.
2410 Stockwell Road, Bossier City, LA 71111
MLS# 280491NLListed by: SHREVEPORT-BOSSIER REALTY
Local realty services provided by:CENTURY 21 Gold Coat Realtors, CENTURY 21 Lakeshore
Information provided, in part, by North Texas Real Estate Information Systems, Inc. Last Updated April 1, 2026 Listings with the NTREIS logo are listed by brokerages other than CENTURY 21 Gold Coat Realtors.
Popular searches near 71111
Popular neighborhoods near 71111
- Agurs, Shreveport homes for sale
- Allendale, Shreveport homes for sale
- Anderson Island, Shreveport homes for sale
- Broadmoor, Shreveport homes for sale
- Central Business District, Shreveport homes for sale
- Dixie Garden, Shreveport homes for sale
- Fairfield, Shreveport homes for sale
- Highland, Shreveport homes for sale
- Ingleside, Shreveport homes for sale
- Lakeside, Shreveport homes for sale
- Lakeview, Shreveport homes for sale
- Madison Park, Shreveport homes for sale
- Martin Luther King, Shreveport homes for sale
- North Highland, Shreveport homes for sale
- Queensborough, Shreveport homes for sale
- Shady Grove, Bossier City homes for sale
- Shreve Island, Shreveport homes for sale
- South Highland, Shreveport homes for sale
- Stoner Hill, Shreveport homes for sale
- Wilton Place, Shreveport homes for sale
Counties near Bossier City, 71111
- Bienville County homes for sale
- Bossier County homes for sale
- Caddo County homes for sale
- Cass County homes for sale
- Claiborne County homes for sale
- Columbia County homes for sale
- De Soto County homes for sale
- Gregg County homes for sale
- Harrison County homes for sale
- Jackson County homes for sale
- Lafayette County homes for sale
- Lincoln County homes for sale
- Marion County homes for sale
- Miller County homes for sale
- Morris County homes for sale
- Natchitoches County homes for sale
- Panola County homes for sale
- Red River County homes for sale
- Shelby County homes for sale
- Webster County homes for sale
Protect your home and budget from life's surprises with an Assurant Home Warranty, backed by a partner that supports you through every step of homeownership. Explore Plans.
©2026 Century 21 Real Estate LLC. All rights reserved. CENTURY 21®, the CENTURY 21 Logo and C21® are service marks owned by Century 21 Real Estate LLC. Century 21 Real Estate LLC fully supports the principles of the Fair Housing Act and the Equal Opportunity Act. Each office is independently owned and operated. Listing information is deemed reliable but not guaranteed accurate.