- Agurs, Shreveport homes for sale
- Allendale, Shreveport homes for sale
- Anderson Island, Shreveport homes for sale
- Broadmoor, Shreveport homes for sale
- Caddo Heights, Shreveport homes for sale
- Cedar Grove, Shreveport homes for sale
- Central Business District, Shreveport homes for sale
- Dixie Garden, Shreveport homes for sale
- Fairfield, Shreveport homes for sale
- Highland, Shreveport homes for sale
- Ingleside, Shreveport homes for sale
- Madison Park, Shreveport homes for sale
- Pierremont, Shreveport homes for sale
- Shady Grove, Bossier City homes for sale
- Shreve Island, Shreveport homes for sale
- South Broadmoor, Shreveport homes for sale
- South Highland, Shreveport homes for sale
- Spring Lake, Shreveport homes for sale
- Stoner Hill, Shreveport homes for sale
- Town South, Shreveport homes for sale
Bossier City, LA - homes for sale
300 of 342 results displayed
- New
 $205,000Active3 beds 2 baths1,870 sq. ft.
1620 Patricia Drive, Bossier City, LA 71112
MLS# 21176342Listed by: DIAMOND REALTY & ASSOCIATES - New
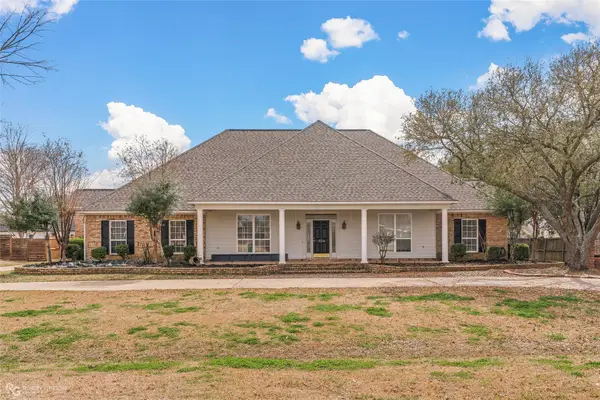
 $499,999Active4 beds 3 baths4,068 sq. ft.
106 Fairmont Drive, Bossier City, LA 71111
MLS# 21192826Listed by: COLDWELL BANKER APEX, REALTORS  $769,900Pending4 beds 5 baths3,374 sq. ft.
217 Evangeline Walk, Bossier City, LA 71111
MLS# 21193544Listed by: RE/MAX ADVANTAGE- New
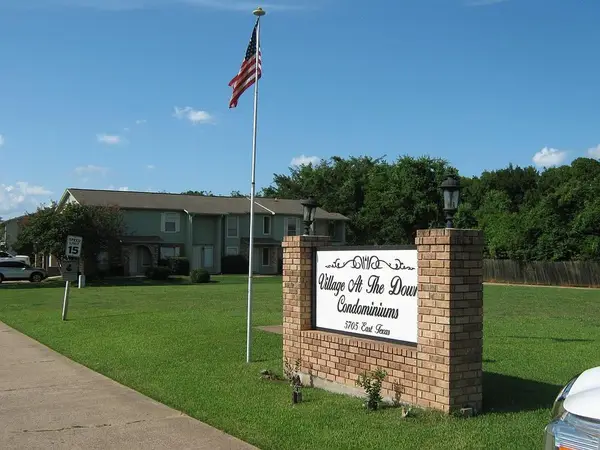 $89,900Active2 beds 2 baths1,044 sq. ft.
5705 E Texas Street #47, Bossier City, LA 71111
MLS# 21193219Listed by: EAST BANK REAL ESTATE - New
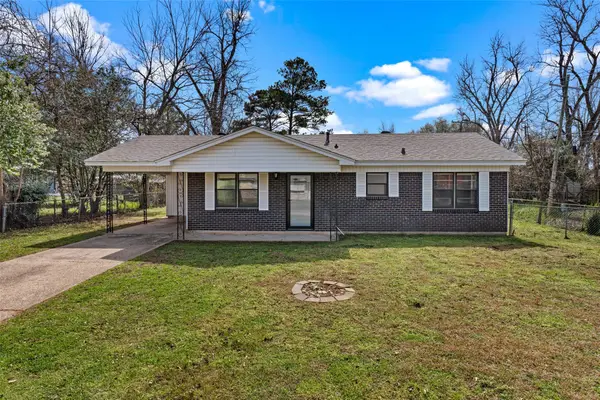
 $235,000Active3 beds 2 baths1,610 sq. ft.
2103 Sandhurst Street, Bossier City, LA 71111
MLS# 21191768Listed by: EPIQUE INC - New
 $573,900Active5 beds 4 baths3,825 sq. ft.
304 Tealwood Drive, Bossier City, LA 71111
MLS# 21191604Listed by: DIAMOND REALTY & ASSOCIATES - New
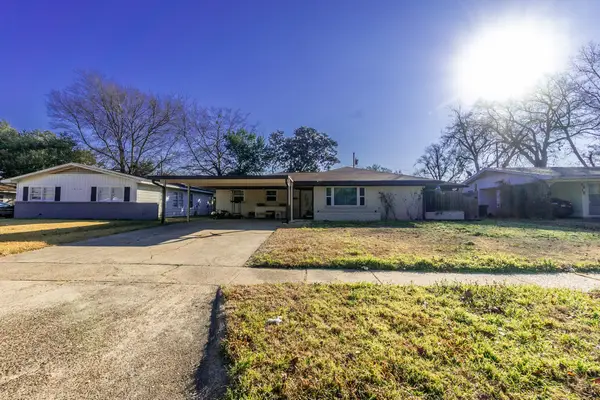
 $170,000Active3 beds 1 baths1,013 sq. ft.
1800 San Saba Street, Bossier City, LA 71112
MLS# 21189758Listed by: KELLER WILLIAMS NORTHWEST - New
 $217,000Active3 beds 2 baths1,300 sq. ft.
4700 Longstreet Place, Bossier City, LA 71112
MLS# 21190670Listed by: EAST BANK REAL ESTATE - New

 $59,900Active3 beds 2 baths1,080 sq. ft.
305 Edge Brook, Bossier City, LA 71111
MLS# 21190806Listed by: CENTURY 21 UNITED - New
 $620,000Active4 beds 3 baths2,785 sq. ft.
613 Danube Circle, Bossier City, LA 71111
MLS# 21188067Listed by: COLDWELL BANKER APEX, REALTORS  $244,445Pending3 beds 2 baths1,490 sq. ft.
811 Venecia Drive, Bossier City, LA 71111
MLS# 21189887Listed by: CICERO REALTY LLC- New
 $100,000Active2 beds 1 baths939 sq. ft.
119 Thompson Street, Bossier City, LA 71111
MLS# 21188178Listed by: BERKSHIRE HATHAWAY HOMESERVICES ALLY REAL ESTATE - New
 $68,500Active1 beds 1 baths784 sq. ft.
219 1/2 Colquitt Street #5, Bossier City, LA 71111
MLS# 21188260Listed by: BERKSHIRE HATHAWAY HOMESERVICES ALLY REAL ESTATE - New
 $403,849Active4 beds 3 baths2,387 sq. ft.
334 Prien Lake Loop, Bossier City, LA 71111
MLS# 21189715Listed by: PINNACLE REALTY ADVISORS - New
 $239,900Active3 beds 2 baths1,678 sq. ft.
2126 Middle Creek Boulevard, Bossier City, LA 71111
MLS# 21189742Listed by: PINNACLE REALTY ADVISORS - New
 $285,000Active4 beds 2 baths1,845 sq. ft.
3301 Colonial Drive, Bossier City, LA 71111
MLS# 21189452Listed by: PINNACLE REALTY ADVISORS  $32,000Pending2 beds 2 baths1,288 sq. ft.
1140 Waller Avenue, Bossier City, LA 71112
MLS# 21189286Listed by: EPIQUE INC $579,900Pending5 beds 3 baths3,118 sq. ft.
604 Dumaine Drive, Bossier City, LA 71111
MLS# 21184548Listed by: KELLER WILLIAMS NORTHWEST- New
 $186,000Active3 beds 2 baths1,486 sq. ft.
2407 Douglas Drive, Bossier City, LA 71111
MLS# 21187993Listed by: COLDWELL BANKER APEX, REALTORS  $249,900Pending3 beds 2 baths1,658 sq. ft.
2502 Downs Street, Bossier City, LA 71111
MLS# 21182561Listed by: TONY DOAN- New
 $279,000Active3 beds 2 baths1,587 sq. ft.
3007 Gabriel Oaks Drive, Bossier City, LA 71111
MLS# 21188099Listed by: RE/MAX REAL ESTATE SERVICES - New
 $149,900Active4 beds 2 baths1,689 sq. ft.
907 Princeton Avenue, Bossier City, LA 71112
MLS# 21187389Listed by: DIAMOND REALTY & ASSOCIATES - New
 $274,900Active3 beds 2 baths1,637 sq. ft.
4907 General Rusk Drive, Bossier City, LA 71112
MLS# 21184640Listed by: RE/MAX REAL ESTATE SERVICES - New
 $325,000Active4 beds 2 baths2,047 sq. ft.
404 Antietam Drive, Bossier City, LA 71112
MLS# 21185401Listed by: PINNACLE REALTY ADVISORS  $170,000Pending4 beds 2 baths1,610 sq. ft.
1143 Gilbert Drive, Bossier City, LA 71112
MLS# 21186706Listed by: PINNACLE REALTY ADVISORS- New
 $565,000Active4 beds 3 baths3,679 sq. ft.
520 Canterbury Lane, Bossier City, LA 71111
MLS# 21185459Listed by: RACHEL & CO. REALTY - New
 $110,000Active3 beds 1 baths1,152 sq. ft.
1316 Lampkin Street, Bossier City, LA 71111
MLS# 21186479Listed by: KELLER WILLIAMS NORTHWEST - New
 $94,900Active2 beds 2 baths1,100 sq. ft.
2211 Loreco Street, Bossier City, LA 71112
MLS# 21186519Listed by: PINNACLE REALTY ADVISORS  $107,000Pending3 beds 1 baths1,027 sq. ft.
2804 Hood Drive, Bossier City, LA 71111
MLS# 21186240Listed by: COLDWELL BANKER APEX, REALTORS $128,000Pending3 beds 1 baths1,022 sq. ft.
4517 Donnie Avenue, Bossier City, LA 71111
MLS# 21186252Listed by: IIM REALTY INC- New
 $324,900Active4 beds 2 baths1,960 sq. ft.
307 Briars Court, Bossier City, LA 71111
MLS# 21183111Listed by: RE/MAX UNITED - New
 $179,900Active3 beds 2 baths1,465 sq. ft.
3405 Lylac Lane, Bossier City, LA 71112
MLS# 21184593Listed by: CENTURY 21 ELITE - New
 $105,820Active2 beds 1 baths962 sq. ft.
2567 Broadway Drive, Bossier City, LA 71111
MLS# 21184845Listed by: COLDWELL BANKER APEX, REALTORS  $49,999Active3 beds 1 baths1,274 sq. ft.
202 Kelly Street, Bossier City, LA 71111
MLS# 21183557Listed by: BERKSHIRE HATHAWAY HOMESERVICES ALLY REAL ESTATE $270,000Active3 beds 2 baths1,718 sq. ft.
1126 Eli Conner Drive, Bossier City, LA 71112
MLS# 21177751Listed by: BERKSHIRE HATHAWAY HOMESERVICES ALLY REAL ESTATE $249,900Active4 beds 2 baths2,045 sq. ft.
2300 Brownlee Road, Bossier City, LA 71111
MLS# 21182877Listed by: CENTURY 21 ELITE $167,500Active2 beds 2 baths1,297 sq. ft.
3636 Greenacres Place #5, Bossier City, LA 71111
MLS# 21182600Listed by: COLDWELL BANKER APEX, REALTORS $375,475Pending4 beds 3 baths2,941 sq. ft.
220 Paisley Drive, Bossier City, LA 71111
MLS# 21182228Listed by: CICERO REALTY LLC $225,000Pending3 beds 2 baths1,497 sq. ft.
3416 Lanell Drive, Bossier City, LA 71112
MLS# 21178582Listed by: SPARTAN REALTY $380,000Active4 beds 2 baths2,035 sq. ft.
5126 Tensas Drive, Bossier City, LA 71111
MLS# 21166688Listed by: BERKSHIRE HATHAWAY HOMESERVICES ALLY REAL ESTATE $365,000Pending3 beds 2 baths1,869 sq. ft.
800 Durango Drive, Bossier City, LA 71111
MLS# 21181795Listed by: PINNACLE REALTY ADVISORS $289,000Active3 beds 2 baths1,922 sq. ft.
5010 Kenilworth Drive, Bossier City, LA 71112
MLS# 21170227Listed by: RE/MAX EXECUTIVE REALTY- Open Sun, 2 to 4pm
 $810,000Active5 beds 4 baths4,014 sq. ft.
105 Esplanade Court, Bossier City, LA 71111
MLS# 21181398Listed by: COLDWELL BANKER APEX, REALTORS  $256,000Active3 beds 2 baths1,577 sq. ft.
287 Avondale Lane, Bossier City, LA 71112
MLS# 21181484Listed by: EPIQUE INC $269,900Pending4 beds 2 baths1,772 sq. ft.
6012 Pepperwood Circle, Bossier City, LA 71111
MLS# 21135486Listed by: BERKSHIRE HATHAWAY HOMESERVICES ALLY REAL ESTATE $485,000Active4 beds 3 baths2,818 sq. ft.
153 Southwood Drive, Bossier City, LA 71111
MLS# 21180415Listed by: RACHEL & CO. REALTY $352,483Pending4 beds 3 baths2,211 sq. ft.
214 Paisley Lane, Bossier City, LA 71111
MLS# 21178163Listed by: CICERO REALTY LLC $289,900Active4 beds 2 baths2,038 sq. ft.
3916 Ella Street, Bossier City, LA 71112
MLS# 21180506Listed by: KELLER WILLIAMS NORTHWEST $599,000Active4 beds 4 baths2,998 sq. ft.
268 Cullom Drive, Bossier City, LA 71112
MLS# 21180348Listed by: PINNACLE REALTY ADVISORS $1,261,388Active4.27 Acres
00 Barksdale Boulevard, Bossier City, LA 71112
MLS# 21180332Listed by: EXP REALTY, LLC $232,000Active3 beds 2 baths1,330 sq. ft.
5005 Ames Place, Bossier City, LA 71112
MLS# 21177093Listed by: SBC REALTY GROUP LLC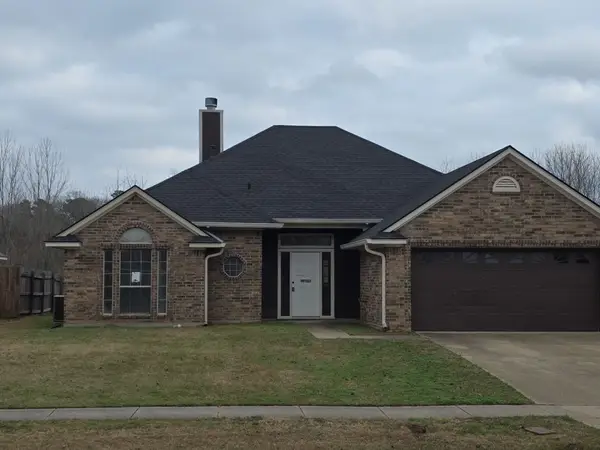 $227,500Active3 beds 2 baths1,547 sq. ft.
3120 Stockwell Road, Bossier City, LA 71111
MLS# 21174208Listed by: INFINITY REALTY GROUP OF TEXAS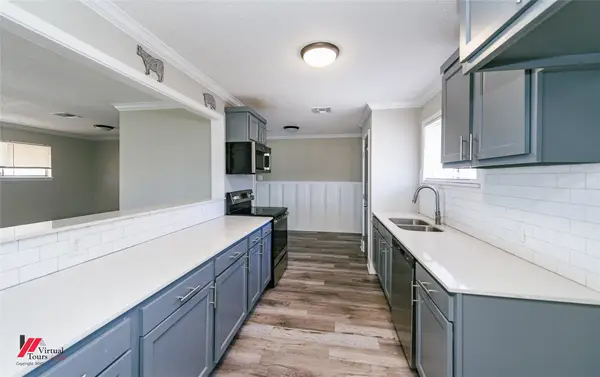 $240,000Active4 beds 2 baths1,693 sq. ft.
1106 Caroline Drive, Bossier City, LA 71112
MLS# 21180018Listed by: CENTURY 21 ELITE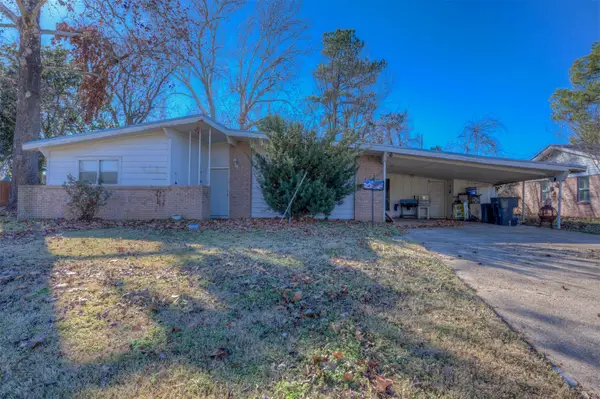 $149,000Active3 beds 2 baths1,760 sq. ft.
3218 Caroline Drive, Bossier City, LA 71112
MLS# 21179808Listed by: TOP BROKERAGE LLC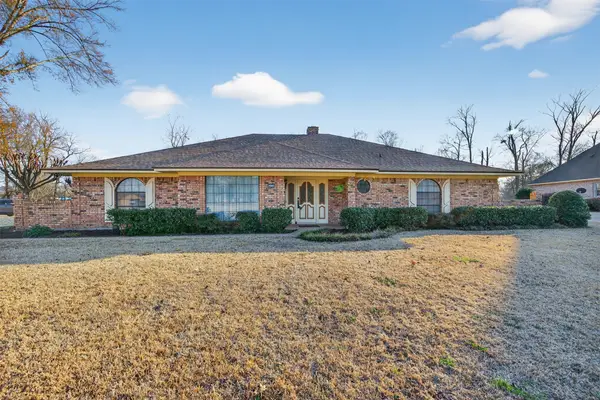 $325,000Active3 beds 3 baths2,438 sq. ft.
5430 Coach Road, Bossier City, LA 71111
MLS# 21177379Listed by: COLDWELL BANKER APEX, REALTORS $250,000Active3 beds 2 baths1,601 sq. ft.
5908 Stockwood Street, Bossier City, LA 71111
MLS# 21162500Listed by: CENTURY 21 ELITE $169,900Pending3 beds 2 baths1,305 sq. ft.
2408 Belle Grove Drive, Bossier City, LA 71111
MLS# 21179256Listed by: ESTEP & ASSOCIATES REAL ESTATE SERVICES, LLC $599,900Active3 beds 4 baths2,813 sq. ft.
112 Vieux Carre, Bossier City, LA 71111
MLS# 21175869Listed by: EAST BANK REAL ESTATE $124,950Active3 beds 2 baths1,744 sq. ft.
1819 Southview Drive, Bossier City, LA 71112
MLS# 21178802Listed by: COLDWELL BANKER APEX, REALTORS- $400,000Active3 beds 3 baths2,485 sq. ft.
175 Rye Circle, Bossier City, LA 71112
MLS# 21175493Listed by: EPIQUE INC  $199,000Pending4 beds 2 baths1,923 sq. ft.
2917 Bobbie Street, Bossier City, LA 71112
MLS# 21178850Listed by: PINNACLE REALTY ADVISORS- $205,000Active3 beds 2 baths1,302 sq. ft.
1998 Wild Iris, Bossier City, LA 71112
MLS# 21178989Listed by: 318 REAL ESTATE L.L.C.  $249,900Active3 beds 2 baths1,306 sq. ft.
178 Cullom Drive, Bossier City, LA 71112
MLS# 21175680Listed by: DIAMOND REALTY & ASSOCIATES- $258,000Active4 beds 2 baths1,718 sq. ft.
6012 Whitney Drive, Bossier City, LA 71111
MLS# 21177830Listed by: EPIQUE INC  $559,900Pending4 beds 3 baths2,916 sq. ft.
250 Piccadilly Circle, Bossier City, LA 71111
MLS# 21177583Listed by: PINNACLE REALTY ADVISORS $199,900Active0.4 Acres
1230 Barksdale Boulevard, Bossier City, LA 71111
MLS# 21164700Listed by: BERKSHIRE HATHAWAY HOMESERVICES ALLY REAL ESTATE $393,000Active4 beds 3 baths2,941 sq. ft.
711 Esau Avenue, Bossier City, LA 71111
MLS# 21170872Listed by: PINNACLE REALTY ADVISORS $230,000Active3 beds 2 baths1,501 sq. ft.
2308 Stockwell Road, Bossier City, LA 71111
MLS# 21169910Listed by: PINNACLE REALTY ADVISORS $244,000Active4 beds 2 baths1,818 sq. ft.
5846 Bayou Drive, Bossier City, LA 71112
MLS# 21174976Listed by: KELLER WILLIAMS NORTHWEST $300,000Active3 beds 2 baths1,848 sq. ft.
209 Norwell Lane, Bossier City, LA 71111
MLS# 21176095Listed by: DIAMOND REALTY & ASSOCIATES $169,900Pending3 beds 1 baths1,642 sq. ft.
1625 Patricia Drive, Bossier City, LA 71112
MLS# 21176194Listed by: CENTURY 21 ELITE- $354,000Pending3 beds 2 baths1,910 sq. ft.
342 Prien Lake Loop, Bossier City, LA 71111
MLS# 21175868Listed by: PINNACLE REALTY ADVISORS  $199,000Active3 beds 2 baths1,552 sq. ft.
1913 Venus Circle, Bossier City, LA 71112
MLS# 21175529Listed by: PELICAN REALTY ADVISORS $315,000Active3 beds 2 baths1,640 sq. ft.
119 Andrew Place, Bossier City, LA 71111
MLS# 21175908Listed by: CALL IT CLOSED INTERNATIONAL, INC. $351,486Active3 beds 2 baths1,984 sq. ft.
316 Peason Ridge, Bossier City, LA 71112
MLS# 21175321Listed by: PINNACLE REALTY ADVISORS $85,000Active3 beds 1 baths1,284 sq. ft.
1509 James Street, Bossier City, LA 71111
MLS# 21174668Listed by: DREAM HOME REALTY, LLC $248,000Active3 beds 2 baths1,617 sq. ft.
2113 Starling Drive, Bossier City, LA 71111
MLS# 21168761Listed by: DIAMOND REALTY & ASSOCIATES $350,123Active4 beds 2 baths1,957 sq. ft.
332 Prien Lake Loop, Bossier City, LA 71111
MLS# 21174311Listed by: PINNACLE REALTY ADVISORS $349,000Active3 beds 2 baths1,842 sq. ft.
234 Arrowhead Drive, Bossier City, LA 71111
MLS# 21174106Listed by: LA STATE REALTY, LLC $529,900Pending5 beds 3 baths3,411 sq. ft.
504 Belle Rouge Circle, Bossier City, LA 71111
MLS# 21160016Listed by: RACHEL & CO. REALTY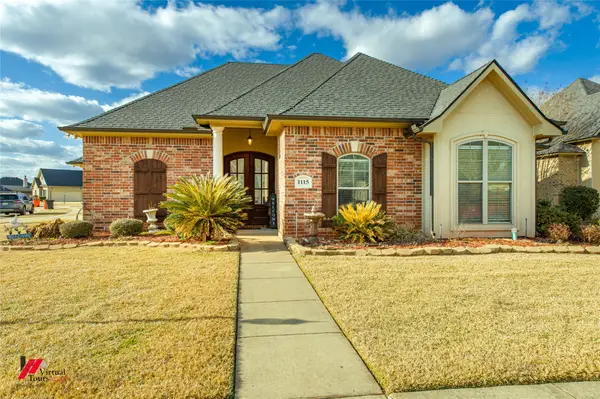 $325,000Active4 beds 2 baths2,000 sq. ft.
1115 Creole Drive, Bossier City, LA 71111
MLS# 21171634Listed by: CENTURY 21 ELITE $395,000Active4 beds 2 baths1,910 sq. ft.
125 Cullom Drive, Bossier City, LA 71112
MLS# 21172931Listed by: PINNACLE REALTY ADVISORS $469,500Active4 beds 4 baths3,776 sq. ft.
110 Southwood Drive, Bossier City, LA 71111
MLS# 21172199Listed by: PINNACLE REALTY ADVISORS $265,000Active3 beds 2 baths1,660 sq. ft.
333 Oakland, Bossier City, LA 71112
MLS# 21170584Listed by: KELLER WILLIAMS NORTHWEST $293,610Active3 beds 2 baths1,848 sq. ft.
746 Crewe Lane, Bossier City, LA 71111
MLS# 21172665Listed by: CICERO REALTY LLC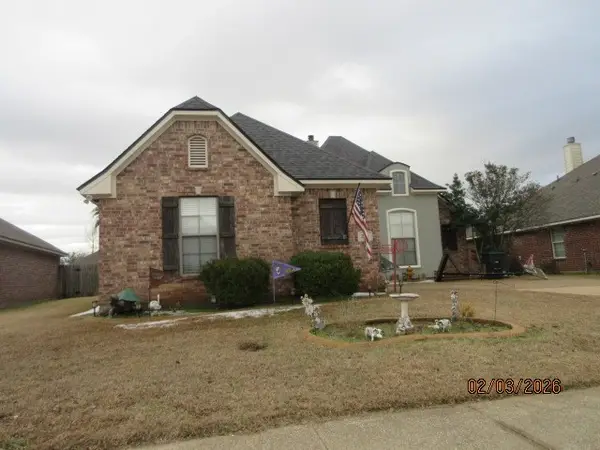 $286,000Active3 beds 2 baths1,782 sq. ft.
213 Antietam Drive, Bossier City, LA 71112
MLS# 21172761Listed by: PRIME REAL ESTATE, LLC- $139,900Pending2 beds 1 baths1,200 sq. ft.
1308 Becky Street, Bossier City, LA 71111
MLS# 21172065Listed by: BERKSHIRE HATHAWAY HOMESERVICES ALLY REAL ESTATE 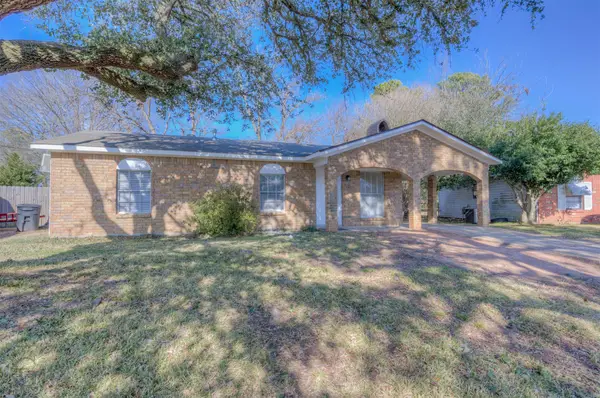 $140,000Active2 beds 2 baths1,330 sq. ft.
4833 Sheryl Street, Bossier City, LA 71111
MLS# 21171413Listed by: 318 REAL ESTATE L.L.C. $79,900Active2 beds 1 baths1,012 sq. ft.
629 Garden Street, Bossier City, LA 71112
MLS# 21167589Listed by: BERKSHIRE HATHAWAY HOMESERVICES ALLY REAL ESTATE $248,235Active3 beds 2 baths1,564 sq. ft.
757 Venecia Drive, Bossier City, LA 71111
MLS# 21170316Listed by: CICERO REALTY LLC $314,000Active3 beds 2 baths1,787 sq. ft.
201 Ixworth Avenue, Bossier City, LA 71111
MLS# 21169100Listed by: DIAMOND REALTY & ASSOCIATES $259,900Pending4 beds 2 baths2,000 sq. ft.
4927 General Rusk Drive, Bossier City, LA 71112
MLS# 21162794Listed by: 318 REAL ESTATE L.L.C. $273,500Active3 beds 2 baths1,685 sq. ft.
5861 Bluebonnett Drive, Bossier City, LA 71112
MLS# 21167165Listed by: COLDWELL BANKER APEX, REALTORS $550,000Active3 beds 3 baths2,375 sq. ft.
103 Calais Court, Bossier City, LA 71111
MLS# 21165867Listed by: EAST BANK REAL ESTATE $149,900Active3 beds 2 baths1,091 sq. ft.
4844 Camellia Lane, Bossier City, LA 71111
MLS# 21167047Listed by: BERKSHIRE HATHAWAY HOMESERVICES ALLY REAL ESTATE $63,000Pending-- beds -- baths576 sq. ft.
5705 E Texas Street #142, Bossier City, LA 71111
MLS# 21166584Listed by: LOUISIANA REALTY & ASSOC LLC $174,999Active4 beds 2 baths1,556 sq. ft.
1617 Margaret Street, Bossier City, LA 71112
MLS# 21165383Listed by: LA STATE REALTY, LLC $366,041Pending4 beds 3 baths2,811 sq. ft.
200 Paisley Lane, Bossier City, LA 71111
MLS# 21165002Listed by: CICERO REALTY LLC $294,950Pending4 beds 2 baths1,824 sq. ft.
5782 Bayou Drive, Bossier City, LA 71112
MLS# 21160957Listed by: DIAMOND REALTY & ASSOCIATES $369,000Active4 beds 3 baths3,044 sq. ft.
5516 Hickory Ridge Drive, Bossier City, LA 71111
MLS# 21162558Listed by: DIAMOND REALTY & ASSOCIATES $15,000Pending2 beds 1 baths800 sq. ft.
1312 Becky Street, Bossier City, LA 71111
MLS# 21162007Listed by: FRIESTAD REALTY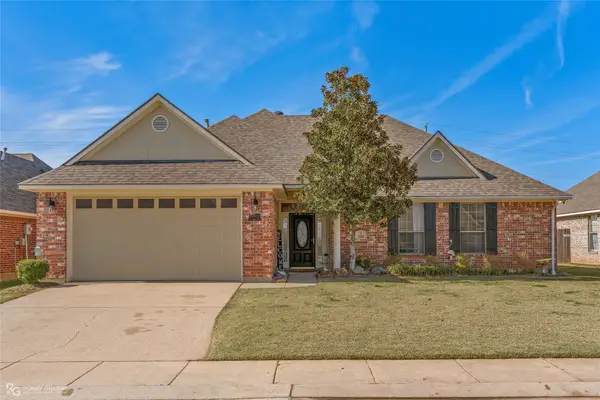 $288,900Active3 beds 2 baths1,739 sq. ft.
102 Antietam Drive, Bossier City, LA 71112
MLS# 21154484Listed by: PINNACLE REALTY ADVISORS $95,000Active2 beds 1 baths913 sq. ft.
2579 Broadway Drive, Bossier City, LA 71111
MLS# 21161469Listed by: COLDWELL BANKER APEX, REALTORS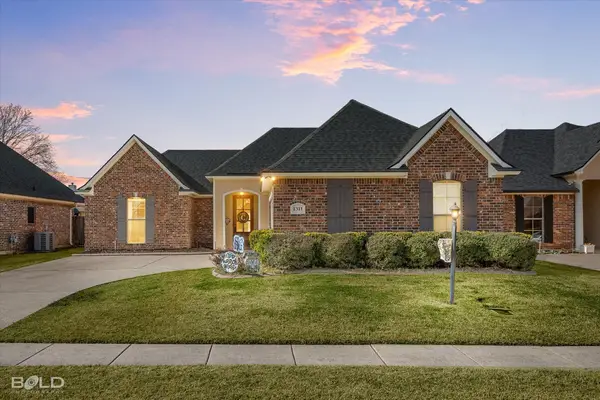 $240,000Pending3 beds 2 baths1,512 sq. ft.
1311 Quincy Drive, Bossier City, LA 71111
MLS# 21154024Listed by: BERKSHIRE HATHAWAY HOMESERVICES ALLY REAL ESTATE- $175,000Pending3 beds 2 baths1,832 sq. ft.
547 Rugby Place, Bossier City, LA 71111
MLS# 21153207Listed by: LA STATE REALTY, LLC  $176,900Pending3 beds 2 baths1,398 sq. ft.
4934 General Polk Drive, Bossier City, LA 71112
MLS# 21161078Listed by: EAST BANK REAL ESTATE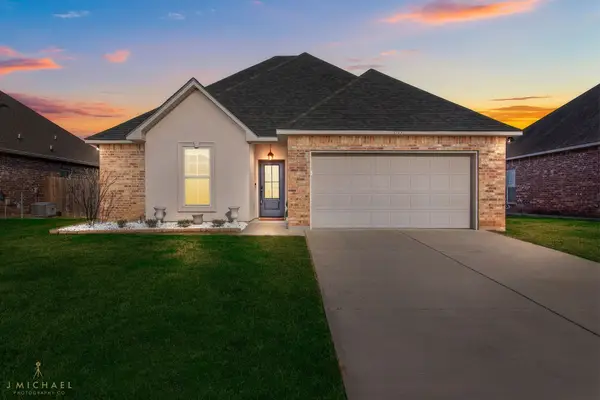 $259,900Active3 beds 2 baths1,601 sq. ft.
1115 Eli Conner Drive, Bossier City, LA 71112
MLS# 21160695Listed by: KELLER WILLIAMS NORTHWEST $405,000Active4 beds 3 baths2,755 sq. ft.
2119 Surrey Lane, Bossier City, LA 71111
MLS# 21159419Listed by: RE/MAX UNITED $83,500Pending4 beds 2 baths1,670 sq. ft.
3126 Malvern Street, Bossier City, LA 71111
MLS# 21159983Listed by: FRIESTAD REALTY $168,000Pending2 beds 2 baths1,120 sq. ft.
3634 Greenacres Place Drive #206, Bossier City, LA 71111
MLS# 21159528Listed by: DIAMOND REALTY & ASSOCIATES $425,000Active3 beds 2 baths1,880 sq. ft.
222 Jasmine Walk, Bossier City, LA 71111
MLS# 21144648Listed by: RE/MAX REAL ESTATE SERVICES $560,000Active5 beds 3 baths2,490 sq. ft.
302 Elbow Slough, Bossier City, LA 71112
MLS# 21157969Listed by: 318 REAL ESTATE L.L.C. $129,900Active3 beds 2 baths1,292 sq. ft.
617 Rome Street, Bossier City, LA 71112
MLS# 21157829Listed by: PINNACLE REALTY ADVISORS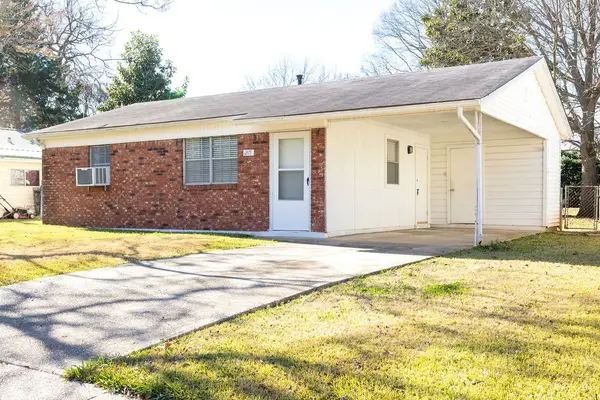 $85,000Pending2 beds 1 baths841 sq. ft.
1215 Becky Street, Bossier City, LA 71111
MLS# 21155200Listed by: KELLER WILLIAMS NORTHWEST $215,000Active3 beds 2 baths1,688 sq. ft.
2113 Mockingbird Lane, Bossier City, LA 71111
MLS# 21146159Listed by: KELLER WILLIAMS NORTHWEST $100,000Active0.29 Acres
100 Heron Walk, Bossier City, LA 71111
MLS# 21154780Listed by: BERKSHIRE HATHAWAY HOMESERVICES ALLY REAL ESTATE $245,000Pending3 beds 2 baths1,728 sq. ft.
5900 Stockwood Street, Bossier City, LA 71111
MLS# 21154991Listed by: EPIQUE INC $129,386Active3 beds 1 baths1,250 sq. ft.
1536 James Street, Bossier City, LA 71111
MLS# 21154342Listed by: PINNACLE REALTY ADVISORS $224,900Pending3 beds 2 baths1,848 sq. ft.
401 Plaza Circle, Bossier City, LA 71111
MLS# 21154420Listed by: BERKSHIRE HATHAWAY HOMESERVICES ALLY REAL ESTATE $419,900Active4 beds 3 baths2,724 sq. ft.
339 Greenacres Boulevard, Bossier City, LA 71111
MLS# 21151308Listed by: BERKSHIRE HATHAWAY HOMESERVICES ALLY REAL ESTATE $329,900Active3 beds 2 baths1,812 sq. ft.
5118 Tensas Drive, Bossier City, LA 71111
MLS# 21153126Listed by: PINNACLE REALTY ADVISORS $145,000Active3 beds 2 baths1,536 sq. ft.
409 Glen Harbor, Bossier City, LA 71111
MLS# 21143042Listed by: EAST BANK REAL ESTATE $275,000Active4 beds 2 baths1,858 sq. ft.
3011 Grace Harper Drive, Bossier City, LA 71112
MLS# 21152279Listed by: BETTER HOMES AND GARDENS RE LINDSEY REALTY $259,900Active3 beds 2 baths1,671 sq. ft.
6009 Pepperwood Circle, Bossier City, LA 71111
MLS# 21147665Listed by: 318 REAL ESTATE L.L.C. $424,995Active4 beds 4 baths2,990 sq. ft.
125 Lucky Lane, Bossier City, LA 71112
MLS# 21152150Listed by: 1 PERCENT LISTS NWLA $69,900Active2 beds 1 baths838 sq. ft.
615 Yarborough Street, Bossier City, LA 71111
MLS# 21152176Listed by: STEVENS SOUTHERN PROPERTIES $285,000Active4 beds 3 baths1,953 sq. ft.
3075 Grace Harper Drive, Bossier City, LA 71112
MLS# 21151498Listed by: CENTURY 21 ELITE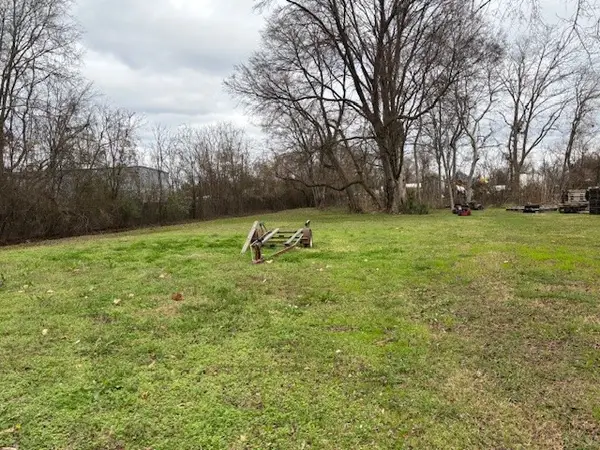 $70,000Active0.34 Acres
1034 Ann Street, Bossier City, LA 71111
MLS# 21151369Listed by: LA STATE REALTY, LLC $218,500Pending3 beds 2 baths1,595 sq. ft.
2517 Conrad Street, Bossier City, LA 71111
MLS# 21150370Listed by: BERKSHIRE HATHAWAY HOMESERVICES ALLY REAL ESTATE $339,000Active3 beds 2 baths2,251 sq. ft.
5524 Hickory Ridge, Bossier City, LA 71111
MLS# 21150011Listed by: PINNACLE REALTY ADVISORS $310,000Active4 beds 3 baths1,986 sq. ft.
519 Brompton Lane, Bossier City, LA 71111
MLS# 21148510Listed by: EPIQUE INC $269,900Pending3 beds 2 baths1,782 sq. ft.
790 Venecia Drive, Bossier City, LA 71111
MLS# 21105509Listed by: PINNACLE REALTY ADVISORS $214,900Active3 beds 2 baths1,290 sq. ft.
1808 Wild Rose, Bossier City, LA 71112
MLS# 21148313Listed by: CONGRESS REALTY, INC.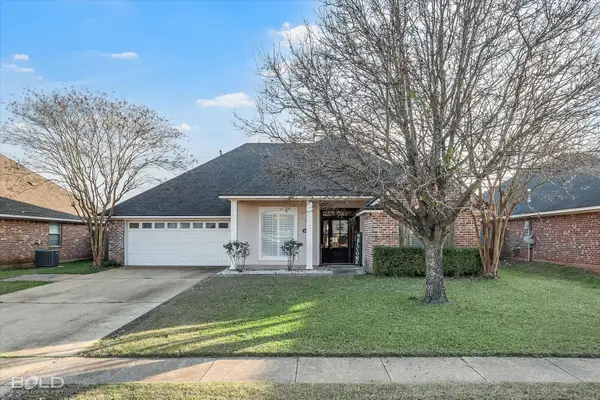 $289,999Active3 beds 2 baths2,015 sq. ft.
6014 Braeburn Court, Bossier City, LA 71111
MLS# 21146932Listed by: BERKSHIRE HATHAWAY HOMESERVICES ALLY REAL ESTATE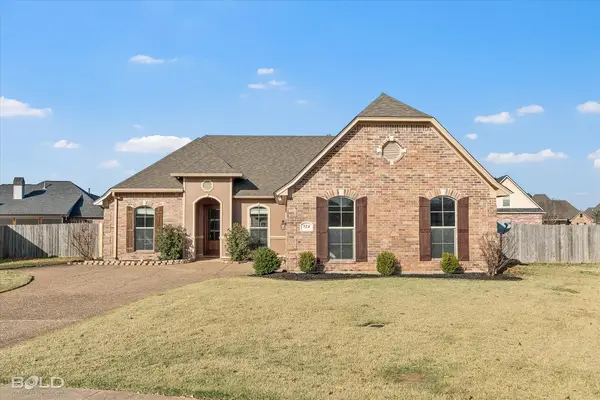 $312,500Pending4 beds 2 baths1,873 sq. ft.
524 Half Moon Lane, Bossier City, LA 71111
MLS# 21145234Listed by: EAST BANK REAL ESTATE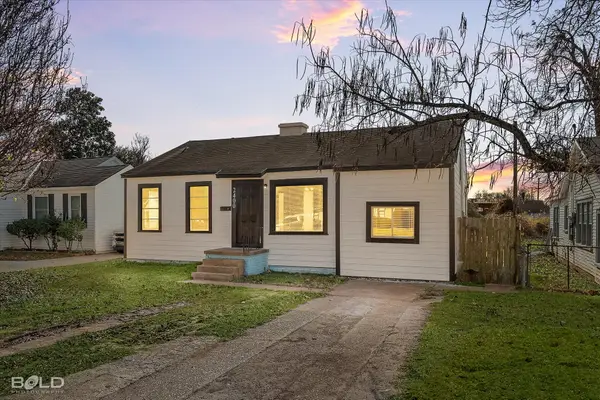 $164,999Active3 beds 1 baths1,295 sq. ft.
2400 Broadway Drive, Bossier City, LA 71111
MLS# 21144664Listed by: BERKSHIRE HATHAWAY HOMESERVICES ALLY REAL ESTATE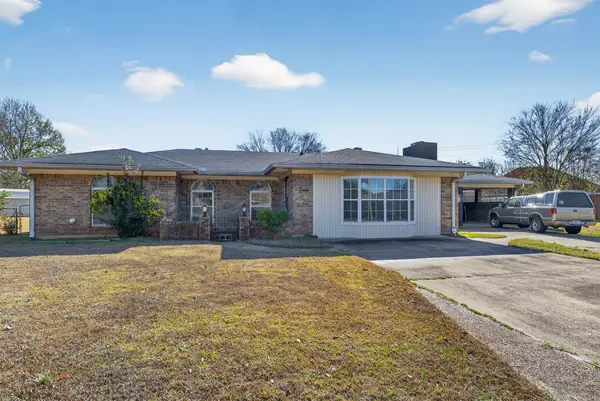 $187,000Active3 beds 3 baths1,847 sq. ft.
1806 Comet Circle, Bossier City, LA 71112
MLS# 21145919Listed by: BERKSHIRE HATHAWAY HOMESERVICES ALLY REAL ESTATE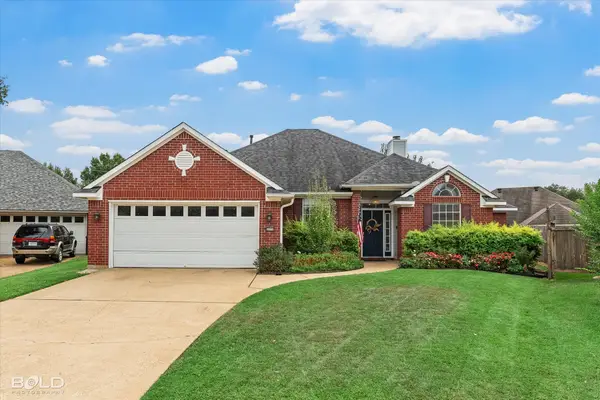 $269,900Active3 beds 2 baths1,706 sq. ft.
6020 Applegate Circle, Bossier City, LA 71111
MLS# 21145131Listed by: NEW COVENANT REALTY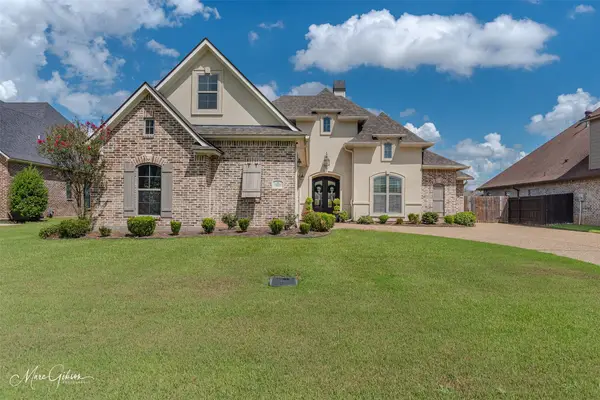 $359,000Pending3 beds 2 baths1,868 sq. ft.
707 Bandera Drive, Bossier City, LA 71111
MLS# 21144240Listed by: DIAMOND REALTY & ASSOCIATES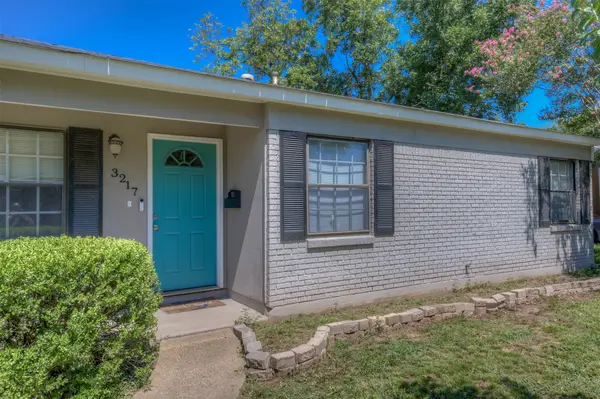 $120,000Active3 beds 1 baths1,163 sq. ft.
3217 Thunderbird Lane, Bossier City, LA 71112
MLS# 21143219Listed by: KELLER WILLIAMS NORTHWEST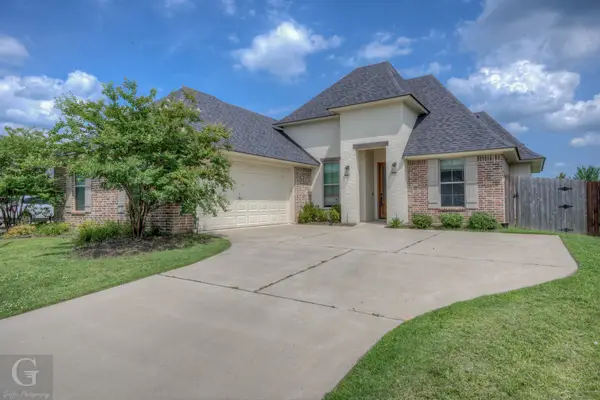 $349,900Active4 beds 2 baths1,983 sq. ft.
5116 Tensas Drive, Bossier City, LA 71111
MLS# 21142965Listed by: COLDWELL BANKER APEX, REALTORS $262,000Active3 beds 2 baths2,081 sq. ft.
238 Avondale Lane, Bossier City, LA 71112
MLS# 21142956Listed by: CENTURY 21 ELITE $529,900Active4 beds 3 baths3,070 sq. ft.
101 Stonebridge Boulevard, Bossier City, LA 71111
MLS# 21141080Listed by: CENTURY 21 ELITE $395,000Active3 beds 2 baths1,868 sq. ft.
460 Stacey Lane, Bossier City, LA 71111
MLS# 21136632Listed by: BERKSHIRE HATHAWAY HOMESERVICES ALLY REAL ESTATE $334,900Active3 beds 2 baths2,115 sq. ft.
218 Ridgefield Drive, Bossier City, LA 71111
MLS# 21141107Listed by: BERKSHIRE HATHAWAY HOMESERVICES ALLY REAL ESTATE- $32,000Active2 beds 1 baths888 sq. ft.
643 Yarborough Street, Bossier City, LA 71111
MLS# 21139881Listed by: PINNACLE REALTY ADVISORS  $569,900Active4 beds 3 baths3,005 sq. ft.
225 Welham Trace, Bossier City, LA 71112
MLS# 21139646Listed by: KELLER WILLIAMS NORTHWEST $199,900Active3 beds 2 baths1,628 sq. ft.
2403 Douglas Drive, Bossier City, LA 71111
MLS# 21138534Listed by: COLDWELL BANKER APEX, REALTORS $399,990Active5 beds 3 baths3,145 sq. ft.
2300 Wesley Circle, Bossier City, LA 71111
MLS# 21137888Listed by: COLDWELL BANKER APEX, REALTORS $205,000Pending4 beds 2 baths2,081 sq. ft.
1358 Anita Street, Bossier City, LA 71112
MLS# 21137537Listed by: FRIESTAD REALTY $259,900Active3 beds 2 baths1,754 sq. ft.
1101 Eli Conner Drive, Bossier City, LA 71112
MLS# 21136482Listed by: RIZEN REALTY, LLC $257,332Pending3 beds 2 baths1,297 sq. ft.
4161 Grassy Lake Drive, Bossier City, LA 71111
MLS# 21130539Listed by: PINNACLE REALTY ADVISORS $164,900Pending3 beds 1 baths1,172 sq. ft.
4216 Evelyn St, Bossier City, LA 71112
MLS# 21131837Listed by: PINNACLE REALTY ADVISORS $110,000Active3 beds 1 baths1,077 sq. ft.
2420 Northside Drive, Bossier City, LA 71111
MLS# 21131486Listed by: PINNACLE REALTY ADVISORS- Open Wed, 12 to 2pm
 $595,000Active4 beds 4 baths2,840 sq. ft.
470 Long Acre Drive, Bossier City, LA 71111
MLS# 21129532Listed by: DIAMOND REALTY & ASSOCIATES  $419,000Active4 beds 3 baths3,212 sq. ft.
1341 Whitehall Drive, Bossier City, LA 71112
MLS# 21129032Listed by: COLDWELL BANKER APEX, REALTORS $189,900Active0.49 Acres
138 Heron Walk, Bossier City, LA 71111
MLS# 21130283Listed by: EAST BANK REAL ESTATE $395,000Active3 beds 3 baths2,390 sq. ft.
100 Cocodrie Circle, Bossier City, LA 71112
MLS# 21129655Listed by: DIAMOND REALTY & ASSOCIATES $349,686Active4 beds 2 baths1,957 sq. ft.
314 Peason Ridge, Bossier City, LA 71112
MLS# 21128646Listed by: KELLER WILLIAMS NORTHWEST $300,000Active4 beds 3 baths1,851 sq. ft.
703 Crozier Drive, Bossier City, LA 71111
MLS# 21127457Listed by: BERKSHIRE HATHAWAY HOMESERVICES ALLY REAL ESTATE $281,000Active3 beds 2 baths1,549 sq. ft.
1941 Rossie Lee Drive, Bossier City, LA 71112
MLS# 21122371Listed by: DIAMOND REALTY & ASSOCIATES $539,900Pending4 beds 3 baths3,036 sq. ft.
110 Piccadilly Circle, Bossier City, LA 71111
MLS# 21126664Listed by: EAST BANK REAL ESTATE $229,000Active3 beds 2 baths1,579 sq. ft.
6329 Anandale Drive, Bossier City, LA 71112
MLS# 21123603Listed by: OSBORN HAYS REAL ESTATE, LLC $252,000Active3 beds 2 baths1,330 sq. ft.
5016 Ames Place, Bossier City, LA 71112
MLS# 21125092Listed by: 318 REAL ESTATE L.L.C. $124,800Active3 beds 1 baths1,125 sq. ft.
2416 Broadway Drive, Bossier City, LA 71111
MLS# 21124851Listed by: FRIESTAD REALTY $399,000Active4 beds 2 baths3,044 sq. ft.
201 Rolling Meadows Lane, Bossier City, LA 71112
MLS# 21115729Listed by: PINNACLE REALTY ADVISORS $286,000Active3 beds 2 baths1,549 sq. ft.
1947 Rossie Lee Drive, Bossier City, LA 71112
MLS# 21123640Listed by: RE/MAX REAL ESTATE SERVICES $55,000Active2 beds 1 baths860 sq. ft.
2531 Evans Street, Bossier City, LA 71112
MLS# 21146891Listed by: RE/MAX EXECUTIVE REALTY $154,900Active3 beds 2 baths1,233 sq. ft.
1712 Bradley Street, Bossier City, LA 71112
MLS# 21123076Listed by: OSBORN HAYS REAL ESTATE, LLC $155,000Active3 beds 1 baths1,243 sq. ft.
2214 Kirby Smith Drive, Bossier City, LA 71112
MLS# 21123115Listed by: PINNACLE REALTY ADVISORS $575,000Pending4 beds 4 baths4,514 sq. ft.
101 Woodvale Creek, Bossier City, LA 71111
MLS# 21123145Listed by: COLDWELL BANKER APEX, REALTORS $249,900Active3 beds 2 baths2,055 sq. ft.
1811 Venus Drive, Bossier City, LA 71112
MLS# 21108051Listed by: KELLER WILLIAMS NORTHWEST $237,900Active4 beds 2 baths1,867 sq. ft.
1904 Ray Avenue, Bossier City, LA 71112
MLS# 21117643Listed by: RACHEL & CO. REALTY $179,900Active3 beds 2 baths1,326 sq. ft.
5606 Kristen Avenue, Bossier City, LA 71112
MLS# 21114885Listed by: COLDWELL BANKER APEX, REALTORS $136,500Active3 beds 2 baths1,367 sq. ft.
2424 Broadway Drive, Bossier City, LA 71111
MLS# 21119393Listed by: PINNACLE REALTY ADVISORS $164,900Active3 beds 2 baths1,256 sq. ft.
2208 Kirby Smith Drive, Bossier City, LA 71112
MLS# 21095222Listed by: EAST BANK REAL ESTATE $624,900Active5 beds 5 baths3,748 sq. ft.
2481 Churchill Drive, Bossier City, LA 71111
MLS# 21119879Listed by: COLDWELL BANKER APEX, REALTORS $99,900Active2 beds 2 baths1,044 sq. ft.
5705 E Texas Street #80, Bossier City, LA 71111
MLS# 21118047Listed by: EAST BANK REAL ESTATE $120,000Active3 beds 1 baths1,253 sq. ft.
4303 Burdine Street, Bossier City, LA 71111
MLS# 21101102Listed by: OPEN DOOR REALTY GROUP, LLC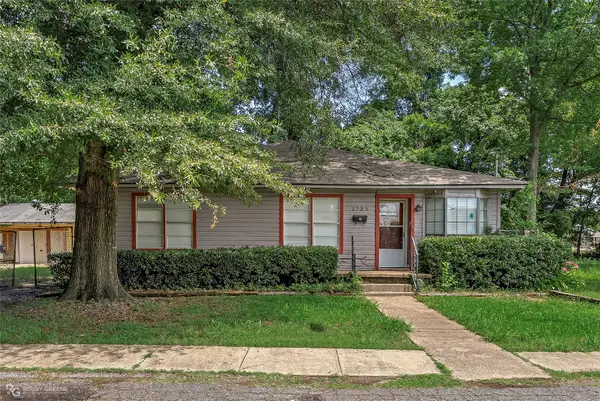 $69,000Pending4 beds 2 baths1,488 sq. ft.
1735 Green Street, Bossier City, LA 71111
MLS# 21119281Listed by: STERLING & SOUTHERN REAL ESTATE CO. LLC $339,900Active3 beds 2 baths1,806 sq. ft.
209 Cullom Drive, Bossier City, LA 71112
MLS# 21118708Listed by: PINNACLE REALTY ADVISORS $350,000Pending3 beds 2 baths1,975 sq. ft.
345 Prien Lake Loop, Bossier City, LA 71111
MLS# 21117604Listed by: PINNACLE REALTY ADVISORS $289,900Pending3 beds 2 baths2,074 sq. ft.
6012 Ellington Way, Bossier City, LA 71111
MLS# 21117654Listed by: RE/MAX REAL ESTATE SERVICES $369,500Active4 beds 2 baths2,470 sq. ft.
105 Downing Court, Bossier City, LA 71111
MLS# 21116993Listed by: FREEDOM REALTY $224,900Active3 beds 2 baths1,607 sq. ft.
4917 Longstreet Place, Bossier City, LA 71112
MLS# 21116188Listed by: COLDWELL BANKER APEX, REALTORS $270,000Active3 beds 2 baths1,645 sq. ft.
321 Fletcher Drive, Bossier City, LA 71112
MLS# 21116435Listed by: SUMMIT EXECUTIVE REALTY $262,320Active3 beds 2 baths1,690 sq. ft.
759 Venecia Drive, Bossier City, LA 71111
MLS# 21116187Listed by: CICERO REALTY LLC $234,690Pending3 beds 2 baths1,363 sq. ft.
763 Venecia Drive, Bossier City, LA 71111
MLS# 21115367Listed by: CICERO REALTY LLC $124,900Active3 beds 1 baths1,125 sq. ft.
2600 Bardot Lane, Bossier City, LA 71111
MLS# 21114080Listed by: BERKSHIRE HATHAWAY HOMESERVICES ALLY REAL ESTATE $252,500Active4 beds 2 baths1,628 sq. ft.
5429 Mulberry Drive, Bossier City, LA 71112
MLS# 21113875Listed by: FREEDOM REALTY $319,700Active4 beds 2 baths2,150 sq. ft.
1413 Magnolia Ridge, Bossier City, LA 71112
MLS# 21111304Listed by: OSBORN HAYS REAL ESTATE, LLC $154,900Active3 beds 2 baths1,463 sq. ft.
2524 Belmont Boulevard, Bossier City, LA 71111
MLS# 21111662Listed by: DIAMOND REALTY & ASSOCIATES $240,380Pending3 beds 2 baths1,461 sq. ft.
761 Venecia Drive, Bossier City, LA 71111
MLS# 21111784Listed by: CICERO REALTY LLC $230,000Pending3 beds 2 baths1,315 sq. ft.
1709 Avondale Court, Bossier City, LA 71112
MLS# 21099496Listed by: CENTURY 21 ELITE $280,000Pending4 beds 3 baths2,231 sq. ft.
507 Falling Water Circle, Bossier City, LA 71112
MLS# 21110602Listed by: FRIESTAD REALTY $95,000Active0.18 Acres
0 Shed Road, Bossier City, LA 71111
MLS# 21110150Listed by: COLDWELL BANKER APEX, REALTORS $735,000Active4 beds 4 baths3,080 sq. ft.
329 Autumn Ridge Drive, Bossier City, LA 71111
MLS# 21109683Listed by: PINNACLE REALTY ADVISORS $148,500Active4 beds 1 baths1,500 sq. ft.
1301 Meadowview Drive, Bossier City, LA 71111
MLS# 21104422Listed by: RE/MAX EXECUTIVE REALTY $271,495Pending4 beds 2 baths1,820 sq. ft.
767 Venecia Drive, Bossier City, LA 71111
MLS# 21109682Listed by: CICERO REALTY LLC $268,000Pending3 beds 2 baths1,901 sq. ft.
6014 Ellington Way, Bossier City, LA 71111
MLS# 21175617Listed by: BERKSHIRE HATHAWAY HOMESERVICES ALLY REAL ESTATE $198,500Active3 beds 2 baths1,501 sq. ft.
1913 Christine Avenue, Bossier City, LA 71112
MLS# 21107819Listed by: PINNACLE REALTY ADVISORS $120,000Active0.26 Acres
312 Nightfall Court, Bossier City, LA 71111
MLS# 21107299Listed by: PINNACLE REALTY ADVISORS $300,000Active1.3 Acres
1250 E Texas Street, Bossier City, LA 71111
MLS# 21106714Listed by: CALL IT CLOSED INTERNATIONAL, INC. $395,000Active4 beds 2 baths2,363 sq. ft.
5505 Hickory Ridge Drive, Bossier City, LA 71111
MLS# 21151287Listed by: PINNACLE REALTY ADVISORS $49,900Active3 beds 1 baths1,560 sq. ft.
401 Berry Street, Bossier City, LA 71111
MLS# 21106088Listed by: BERKSHIRE HATHAWAY HOMESERVICES ALLY REAL ESTATE $260,000Active4 beds 2 baths1,638 sq. ft.
1407 Edgemont Circle, Bossier City, LA 71111
MLS# 21079963Listed by: BETTER HOMES AND GARDENS REAL ESTATE RHODES REALTY- New
 $364,000Active4 beds 4 baths2,962 sq. ft.
302 Greenacres Boulevard, Bossier City, LA 71111
MLS# 21188552Listed by: COLDWELL BANKER APEX, REALTORS  $140,000Pending3 beds 2 baths1,226 sq. ft.
1503 Leslie Street, Bossier City, LA 71111
MLS# 21100489Listed by: RE/MAX EXECUTIVE REALTY $320,380Active4 beds 2 baths1,705 sq. ft.
474 Preserve Boulevard, Bossier City, LA 71112
MLS# 21099960Listed by: PINNACLE REALTY ADVISORS $282,000Active4 beds 2 baths1,981 sq. ft.
2116 Middle Creek Boulevard, Bossier City, LA 71111
MLS# 21099515Listed by: DIAMOND REALTY & ASSOCIATES- $300,000Active3 Acres
3945 Old Shed Road, Bossier City, LA 71111
MLS# 21099675Listed by: 1 PERCENT LISTS NWLA  $322,603Active4 beds 2 baths1,705 sq. ft.
331 Prien Lake Loop, Bossier City, LA 71111
MLS# 21099154Listed by: KELLER WILLIAMS NORTHWEST $249,900Active3 beds 2 baths1,524 sq. ft.
6004 Summerville Lane, Bossier City, LA 71111
MLS# 21092414Listed by: BERKSHIRE HATHAWAY HOMESERVICES ALLY REAL ESTATE $334,900Pending4 beds 3 baths2,382 sq. ft.
5009 Richland Place, Bossier City, LA 71112
MLS# 21097826Listed by: CENTURY 21 ELITE $747,000Active4 beds 6 baths3,487 sq. ft.
555 Canterbury Lane, Bossier City, LA 71111
MLS# 21097393Listed by: PINNACLE REALTY ADVISORS- New
 $299,900Active3 beds 2 baths2,053 sq. ft.
310 Lancashire Drive, Bossier City, LA 71111
MLS# 21191726Listed by: DIAMOND REALTY & ASSOCIATES  $282,000Active3 beds 2 baths1,768 sq. ft.
2200 Middle Creek Boulevard, Bossier City, LA 71111
MLS# 21094362Listed by: COLDWELL BANKER APEX, REALTORS $60,000Active0.16 Acres
0 W Bevly, Bossier City, LA 71111
MLS# 21095398Listed by: CENTURY 21 ELITE $50,000Active0.15 Acres
0 Bevly, Bossier City, LA 71111
MLS# 21095411Listed by: CENTURY 21 ELITE $47,000Active2 beds 1 baths1,114 sq. ft.
223 Edwards Street, Bossier City, LA 71111
MLS# 21094138Listed by: CITYVIEW REALTY LLC $214,900Active3 beds 3 baths1,782 sq. ft.
3635 Greenacres Place Drive #350, Bossier City, LA 71111
MLS# 21093966Listed by: CENTURY 21 ELITE $699,000Active4 beds 3 baths2,890 sq. ft.
106 Vieux Carre, Bossier City, LA 71111
MLS# 21087131Listed by: DIAMOND REALTY & ASSOCIATES $348,900Active3 beds 3 baths1,954 sq. ft.
520 Falling Water Circle, Bossier City, LA 71112
MLS# 21088170Listed by: 318 REAL ESTATE L.L.C. $505,500Active4 beds 4 baths2,926 sq. ft.
517 Hunters Run, Bossier City, LA 71111
MLS# 21089831Listed by: RE/MAX REAL ESTATE SERVICES $125,000Active0.79 Acres
0 Victorias, Bossier City, LA 71111
MLS# 21089552Listed by: BERKSHIRE HATHAWAY HOMESERVICES ALLY REAL ESTATE $499,000Active4 beds 4 baths3,314 sq. ft.
527 Canterbury Lane, Bossier City, LA 71111
MLS# 21088610Listed by: PELICAN REALTY ADVISORS $212,500Active3 beds 2 baths1,480 sq. ft.
2602 Ashland Avenue, Bossier City, LA 71111
MLS# 21088726Listed by: LARK REALTY $189,900Pending3 beds 2 baths1,488 sq. ft.
2129 Rossie Lee Drive, Bossier City, LA 71112
MLS# 21086772Listed by: SHELLY WAGNER & ASSOCIATES + JPAR REAL ESTATE $319,999Active4 beds 2 baths2,185 sq. ft.
5041 Longstreet Place, Bossier City, LA 71112
MLS# 21086533Listed by: FREEDOM REALTY $99,000Pending3 beds 2 baths1,854 sq. ft.
2214 Wakefield Avenue, Bossier City, LA 71111
MLS# 21086379Listed by: FRIESTAD REALTY $134,900Active3 beds 2 baths1,213 sq. ft.
119 Carriage Square Drive, Bossier City, LA 71112
MLS# 21083906Listed by: BERKSHIRE HATHAWAY HOMESERVICES ALLY REAL ESTATE $309,000Pending4 beds 2 baths2,792 sq. ft.
304 Walnut Circle, Bossier City, LA 71111
MLS# 21076388Listed by: BERKSHIRE HATHAWAY HOMESERVICES ALLY REAL ESTATE $205,376Pending3 beds 2 baths1,836 sq. ft.
4100 Parkway Drive, Bossier City, LA 71112
MLS# 21041646Listed by: CENTURY 21 ELITE $193,900Pending3 beds 2 baths1,510 sq. ft.
1609 Northgate Road, Bossier City, LA 71112
MLS# 21080810Listed by: BERKSHIRE HATHAWAY HOMESERVICES ALLY REAL ESTATE $59,900Pending3 beds 1 baths1,079 sq. ft.
3235 Sarah Street, Bossier City, LA 71112
MLS# 21080588Listed by: KELLER WILLIAMS NORTHWEST $399,000Pending4 beds 3 baths2,394 sq. ft.
501 Falling Water Circle, Bossier City, LA 71112
MLS# 21076502Listed by: DIAMOND REALTY & ASSOCIATES $30,000Active1 beds 1 baths513 sq. ft.
1103 Peach Street, Bossier City, LA 71111
MLS# 21076576Listed by: KELLER WILLIAMS NORTHWEST $350,356Active3 beds 2 baths1,910 sq. ft.
481 Preserve Boulevard, Bossier City, LA 71112
MLS# 21076535Listed by: PINNACLE REALTY ADVISORS $298,000Pending4 beds 3 baths1,902 sq. ft.
780 Crozier Drive, Bossier City, LA 71111
MLS# 21074789Listed by: HAIRE REALTY, LLC $240,000Pending3 beds 2 baths1,285 sq. ft.
5018 Ames Place, Bossier City, LA 71112
MLS# 21069943Listed by: CENTURY 21 ELITE $39,900Active2 beds 2 baths1,478 sq. ft.
116 Lillian Street, Bossier City, LA 71111
MLS# 21073246Listed by: BERKSHIRE HATHAWAY HOMESERVICES ALLY REAL ESTATE $285,000Active4 beds 3 baths2,891 sq. ft.
218 Benoist Circle, Bossier City, LA 71111
MLS# 21072176Listed by: BERKSHIRE HATHAWAY HOMESERVICES ALLY REAL ESTATE $504,000Active3 beds 3 baths3,857 sq. ft.
107 Lakewood Point Drive, Bossier City, LA 71111
MLS# 21067627Listed by: DIAMOND REALTY & ASSOCIATES $245,250Pending3 beds 2 baths1,461 sq. ft.
794 Venecia Drive, Bossier City, LA 71111
MLS# 21069630Listed by: CICERO REALTY LLC $461,000Active5 beds 4 baths2,947 sq. ft.
307 Tealwood Drive, Bossier City, LA 71111
MLS# 21057069Listed by: COLDWELL BANKER APEX, REALTORS $339,900Pending3 beds 2 baths1,685 sq. ft.
411 Stacey Lane, Bossier City, LA 71111
MLS# 21062363Listed by: EAST BANK REAL ESTATE $270,000Active3 beds 2 baths1,576 sq. ft.
405 Heritage Drive, Bossier City, LA 71112
MLS# 21061253Listed by: KELLER WILLIAMS NORTHWEST $109,900Active3 beds 1 baths1,193 sq. ft.
1909 Rodney Street, Bossier City, LA 71112
MLS# 21058869Listed by: BERKSHIRE HATHAWAY HOMESERVICES ALLY REAL ESTATE $266,510Pending4 beds 3 baths1,788 sq. ft.
785 Venecia Drive, Bossier City, LA 71111
MLS# 21060248Listed by: CICERO REALTY LLC $89,900Active4 beds 2 baths1,260 sq. ft.
2712 Foster Street, Bossier City, LA 71112
MLS# 21053385Listed by: PINNACLE REALTY ADVISORS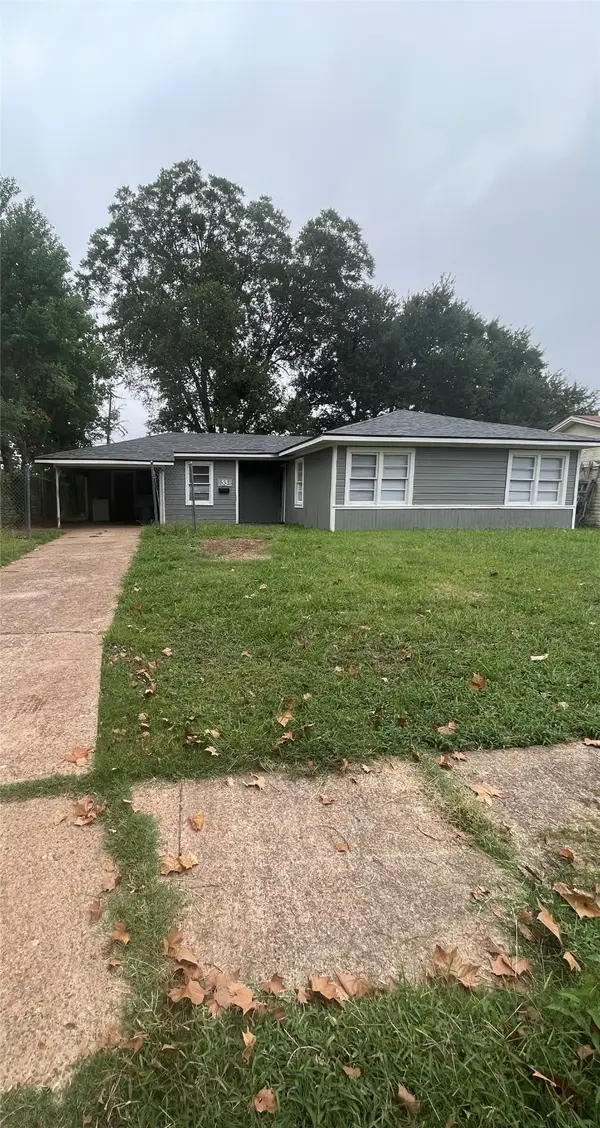 $114,900Active3 beds 1 baths1,048 sq. ft.
1534 James Street, Bossier City, LA 71111
MLS# 21047645Listed by: PINNACLE REALTY ADVISORS $45,000Active3 beds 1 baths1,056 sq. ft.
521 Wyche Street, Bossier City, LA 71111
MLS# 21055566Listed by: LARK REALTY $399,000Active4 beds 2 baths2,192 sq. ft.
4405 Scarlett Avenue, Bossier City, LA 71111
MLS# 21055394Listed by: DIAMOND REALTY & ASSOCIATES $556,900Pending4 beds 4 baths3,416 sq. ft.
347 Crosscreek Drive, Bossier City, LA 71111
MLS# 21054225Listed by: KELLER WILLIAMS NORTHWEST $154,949Active4 beds 1 baths1,500 sq. ft.
3224 Galaxy Drive, Bossier City, LA 71112
MLS# 21154303Listed by: PINNACLE REALTY ADVISORS $260,000Active4 beds 2 baths1,888 sq. ft.
6019 Ellington Way, Bossier City, LA 71111
MLS# 21053942Listed by: KELLER WILLIAMS NORTHWEST $379,000Active4 beds 3 baths2,560 sq. ft.
349 Antietam Drive, Bossier City, LA 71112
MLS# 21052958Listed by: PRIMEAUX REALTY, LLC $255,000Active3 beds 2 baths1,612 sq. ft.
2608 Brown Street, Bossier City, LA 71111
MLS# 21048740Listed by: CENTURY 21 ELITE $350,000Active3 beds 3 baths2,861 sq. ft.
5407 Coach Road, Bossier City, LA 71111
MLS# 21035662Listed by: COLDWELL BANKER APEX, REALTORS $45,000Active3 beds 1 baths1,615 sq. ft.
1805 Traffic Street, Bossier City, LA 71111
MLS# 21046038Listed by: DIAMOND REALTY & ASSOCIATES- New
 $775,000Active4 beds 4 baths3,758 sq. ft.
105 Calais Court, Bossier City, LA 71111
MLS# 21193968Listed by: PINNACLE REALTY ADVISORS  $355,000Active4 Acres
0 Cardnell Road, Bossier City, LA 71111
MLS# 21045876Listed by: PINNACLE REALTY ADVISORS $299,800Active4 beds 3 baths1,982 sq. ft.
1924 Valdemar Place, Bossier City, LA 71112
MLS# 21045608Listed by: DIAMOND REALTY & ASSOCIATES $192,500Pending3 beds 2 baths1,357 sq. ft.
3634 Greenacres Drive #260, Bossier City, LA 71111
MLS# 21043301Listed by: APOGEE BROKERAGE PARTNERS, LLC $206,000Pending4 beds 2 baths1,846 sq. ft.
1509 Anita, Bossier City, LA 71112
MLS# 21043678Listed by: PRIMEAUX REALTY, LLC $459,000Active4 beds 2 baths2,255 sq. ft.
305 Tottenham Court, Bossier City, LA 71111
MLS# 21038390Listed by: CENTURY 21 UNITED $90,000Active2 Acres
0 Crown Court, Bossier City, LA 71112
MLS# 21043585Listed by: PINNACLE REALTY ADVISORS $195,000Active3 beds 2 baths1,760 sq. ft.
1705 Ray Avenue, Bossier City, LA 71112
MLS# 21167394Listed by: KELLER WILLIAMS NORTHWEST $585,000Pending4 beds 4 baths4,605 sq. ft.
309 Bridgepoint Circle, Bossier City, LA 71111
MLS# 21041691Listed by: COLDWELL BANKER APEX, REALTORS $274,900Pending3 beds 2 baths2,162 sq. ft.
408 Maple Ridge Drive, Bossier City, LA 71111
MLS# 21041128Listed by: DIAMOND REALTY & ASSOCIATES $175,000Active3 beds 2 baths1,332 sq. ft.
2526 Belmont Boulevard, Bossier City, LA 71111
MLS# 21040668Listed by: STERLING & SOUTHERN REAL ESTATE CO. LLC $400,000Active-- beds -- baths3,630 sq. ft.
2656 & 2658 Old Minden Road, Bossier City, LA 71112
MLS# 21033384Listed by: CENTURY 21 ELITE $643,500Active9.92 Acres
0 Barksdale Boulevard, Bossier City, LA 71172
MLS# 2515571Listed by: CENTURY 21 ELITE
 $643,500Active9.92 Acres
0 Barksdale Boulevard, Bossier City, LA 71112
MLS# 21024327Listed by: CENTURY 21 ELITE $425,000Active4 beds 2 baths2,054 sq. ft.
4735 Rebouche Road, Bossier City, LA 71111
MLS# 20991273Listed by: CALL IT CLOSED INTERNATIONAL, INC. $309,000Active3 beds 3 baths3,195 sq. ft.
2300 Belmont Boulevard, Bossier City, LA 71111
MLS# 21009181Listed by: DIAMOND REALTY & ASSOCIATES $824,999Active4 beds 4 baths3,063 sq. ft.
305 Nightfall Court, Bossier City, LA 71111
MLS# 21008314Listed by: BERKSHIRE HATHAWAY HOMESERVICES ALLY REAL ESTATE $179,000Active3 beds 2 baths1,503 sq. ft.
2526 Downs Circle, Bossier City, LA 71111
MLS# 21159893Listed by: KELLER WILLIAMS NORTHWEST $39,000Pending0.79 Acres
0 River Bluff #Lot 15, Bossier City, LA 71111
MLS# 21005253Listed by: STEVENS SOUTHERN PROPERTIES $419,900Active4 beds 2 baths1,912 sq. ft.
449 Stacey Lane, Bossier City, LA 71111
MLS# 21001795Listed by: PINNACLE REALTY ADVISORS $170,000Pending2 beds 2 baths1,297 sq. ft.
3636 Greenacres Place Drive #113, Bossier City, LA 71111
MLS# 20999032Listed by: PINNACLE REALTY ADVISORS $495,000Active5.6 Acres
00001 Shed, Bossier City, LA 71111
MLS# 20995290Listed by: OSBORN HAYS REAL ESTATE, LLC $10,000Pending0.07 Acres
105 Adair Street, Bossier City, LA 71111
MLS# 20989735Listed by: RE/MAX UNITED $295,900Pending3 beds 2 baths2,284 sq. ft.
206 Hampton Court, Bossier City, LA 71111
MLS# 20988919Listed by: RE/MAX REAL ESTATE SERVICES $398,500Active5 beds 3 baths2,702 sq. ft.
207 Welham Trace, Bossier City, LA 71112
MLS# 20976770Listed by: BERKSHIRE HATHAWAY HOMESERVICES ALLY REAL ESTATE $289,000Active4 beds 3 baths2,270 sq. ft.
2319 Windsor Court, Bossier City, LA 71111
MLS# 20977884Listed by: KELLER WILLIAMS NORTHWEST $1,800,000Active0.46 Acres
0 Airline Drive, Bossier City, LA 71111
MLS# 20977256Listed by: EXP REALTY, LLC $59,900Active0.19 Acres
210 Overbrook, Bossier City, LA 71111
MLS# 20975953Listed by: PINNACLE REALTY ADVISORS- $59,900Active0.19 Acres
212 Overbrook, Bossier City, LA 71111
MLS# 20975956Listed by: PINNACLE REALTY ADVISORS  $320,000Active4 beds 2 baths2,270 sq. ft.
4002 Wilderness Lane, Bossier City, LA 71111
MLS# 20948009Listed by: BERKSHIRE HATHAWAY HOMESERVICES ALLY REAL ESTATE $49,900Active0.21 Acres
1509 Teresa Place, Bossier City, LA 71112
MLS# 20949968Listed by: BERKSHIRE HATHAWAY HOMESERVICES ALLY REAL ESTATE $599,000Active5 beds 5 baths4,676 sq. ft.
520 Parklane Drive, Bossier City, LA 71111
MLS# 21082668Listed by: PINNACLE REALTY ADVISORS $225,000Active1.14 Acres
0 Viking Drive, Bossier City, LA 71111
MLS# 20935907Listed by: CENTURY 21 ELITE $299,999Active4 beds 3 baths2,193 sq. ft.
3635 Greenacres Place Drive #336, Bossier City, LA 71111
MLS# 20933265Listed by: CENTURY 21 ELITE $65,000Active0.55 Acres
0 Belle Rouge, Bossier City, LA 71111
MLS# 20927119Listed by: PINNACLE REALTY ADVISORS $49,900Active0.24 Acres
0 0 Loit 45a Bevly Lake Road, Bossier City, LA 71111
MLS# 20914040Listed by: EXP REALTY, LLC $99,900Active0.37 Acres
0 Belle Rouge Circle, Bossier City, LA 71111
MLS# 20914051Listed by: EXP REALTY, LLC $99,900Active0.25 Acres
0 Lot 19 Belle Rouge Circle, Bossier City, LA 71111
MLS# 20914054Listed by: EXP REALTY, LLC $139,000Active0.43 Acres
0 Bevly Lake Drive, Bossier City, LA 71111
MLS# 20914037Listed by: EXP REALTY, LLC $449,900Active5 beds 4 baths2,885 sq. ft.
119 Livingston Drive, Bossier City, LA 71112
MLS# 21178177Listed by: CENTURY 21 ELITE
Local realty services provided by:CENTURY 21 Elite, CENTURY 21 Action Realty
Information provided, in part, by North Texas Real Estate Information Systems, Inc. Last Updated March 1, 2026 Listings with the NTREIS logo are listed by brokerages other than CENTURY 21 Elite.
Neighborhoods near Bossier City, LA
Zip codes near Bossier City, LA
- 71006 homes for sale
- 71023 homes for sale
- 71027 homes for sale
- 71037 homes for sale
- 71051 homes for sale
- 71067 homes for sale
- 71078 homes for sale
- 71101 homes for sale
- 71103 homes for sale
- 71104 homes for sale
- 71105 homes for sale
- 71106 homes for sale
- 71107 homes for sale
- 71108 homes for sale
- 71109 homes for sale
- 71111 homes for sale
- 71112 homes for sale
- 71118 homes for sale
- 71119 homes for sale
- 71129 homes for sale
Popular searches near Bossier City, LA
- Belcher homes for sale
- Benton homes for sale
- Blanchard homes for sale
- Doyline homes for sale
- Eastwood homes for sale
- Elm Grove homes for sale
- Frierson homes for sale
- Gloster homes for sale
- Greenwood homes for sale
- Haughton homes for sale
- Heflin homes for sale
- Keithville homes for sale
- Lakeview homes for sale
- Minden homes for sale
- Mooringsport homes for sale
- Princeton homes for sale
- Red Chute homes for sale
- Shreveport homes for sale
- Sibley homes for sale
- Stonewall homes for sale
Protect your home and budget from life's surprises with an Assurant Home Warranty, backed by a partner that supports you through every step of homeownership. Explore Plans.
©2026 Century 21 Real Estate LLC. All rights reserved. CENTURY 21®, the CENTURY 21 Logo and C21® are service marks owned by Century 21 Real Estate LLC. Century 21 Real Estate LLC fully supports the principles of the Fair Housing Act and the Equal Opportunity Act. Each office is independently owned and operated. Listing information is deemed reliable but not guaranteed accurate.