- 82513 homes for sale
- 82520 homes for sale
- 82922 homes for sale
- 82923 homes for sale
- 82932 homes for sale
- 82941 homes for sale
- 83001 homes for sale
- 83101 homes for sale
- 83110 homes for sale
- 83112 homes for sale
- 83113 homes for sale
- 83115 homes for sale
- 83118 homes for sale
- 83119 homes for sale
- 83120 homes for sale
- 83122 homes for sale
- 83123 homes for sale
- 83126 homes for sale
- 83127 homes for sale
- 83128 homes for sale
Boulder, WY - homes for sale
2 of 2 results displayed
 $239,000Active2 beds 1 baths728 sq. ft.
6 Bob-o-link, Boulder, WY 82923
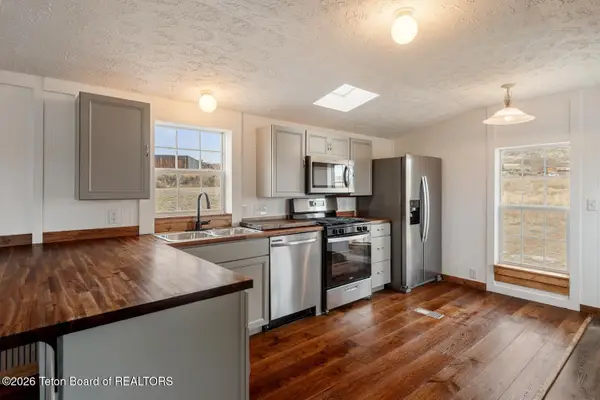
MLS# 26-216Listed by: HIGH MOUNTAIN REAL ESTATE $489,900Active4 beds 3 baths2,225 sq. ft.
5 Shelley Road, Boulder, WY 82923
MLS# 24-1069Listed by: JAY FEAR REAL ESTATE
Local realty services provided by:CENTURY 21 High Desert
Zip codes near Boulder, WY
Popular searches near Boulder, WY
- Afton homes for sale
- Bedford homes for sale
- Big Piney homes for sale
- Bondurant homes for sale
- Daniel homes for sale
- Dubois homes for sale
- Fairview homes for sale
- Farson homes for sale
- Green River North homes for sale
- Grover homes for sale
- Kemmerer East homes for sale
- La Barge homes for sale
- Lander homes for sale
- Marbleton homes for sale
- Osmond homes for sale
- Pinedale homes for sale
- Smoot homes for sale
- Star Valley Ranch homes for sale
- Turnerville homes for sale
- Wind River Reservation homes for sale
Protect your home and budget from life's surprises with an Assurant Home Warranty, backed by a partner that supports you through every step of homeownership. Explore Plans.
©2026 Century 21 Real Estate LLC. All rights reserved. CENTURY 21®, the CENTURY 21 Logo and C21® are service marks owned by Century 21 Real Estate LLC. Century 21 Real Estate LLC fully supports the principles of the Fair Housing Act and the Equal Opportunity Act. Each office is independently owned and operated. Listing information is deemed reliable but not guaranteed accurate.