- Andalusia, La Quinta homes for sale
- Barkley Ranch, Yuma homes for sale
- Cielo Verde, Yuma homes for sale
- Desert View, Yuma homes for sale
- Falls Ranch, Yuma homes for sale
- Griffin Ranch, La Quinta homes for sale
- Kentwood-In-The-Pines, Julian homes for sale
- La Mesa Park, Yuma homes for sale
- Magnolia Village, Yuma homes for sale
- Mecca, Mecca homes for sale
- Oasis, Thermal homes for sale
- Ocotillo, Yuma homes for sale
- Pacific Village Estates, Yuma homes for sale
- Palmcroft Estates, Yuma homes for sale
- Parkway Place, Yuma homes for sale
- PGA West, La Quinta homes for sale
- Sierra Sunset, Yuma homes for sale
- Thermal, Thermal homes for sale
- Tierra Kino, Yuma homes for sale
- Vista Santa Rosa, Thermal homes for sale
Brawley, CA - homes for sale
9 of 9 results displayed
- New
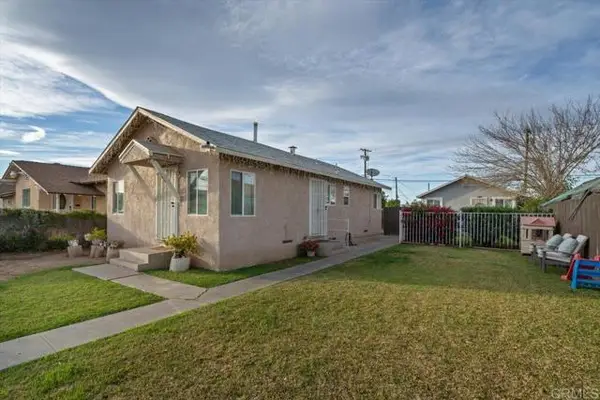 $349,000Active4 beds 2 baths1,560 sq. ft.
347 E B Street, Brawley, CA 92227
MLS# CRPTP2601696Listed by: EXP REALTY OF SOUTHERN CALIF. - Open Mon, 5 to 7pmNew
 $349,000Active4 beds 2 baths1,560 sq. ft.
347 E B Street, Brawley, CA 92227
MLS# PTP2601696Listed by: EXP REALTY OF SOUTHERN CALIF.  $925,000Active4 beds 3 baths3,045 sq. ft.
4444 Brandt Rd, Brawley, CA 92227
MLS# 260005743Listed by: DMA REAL ESTATE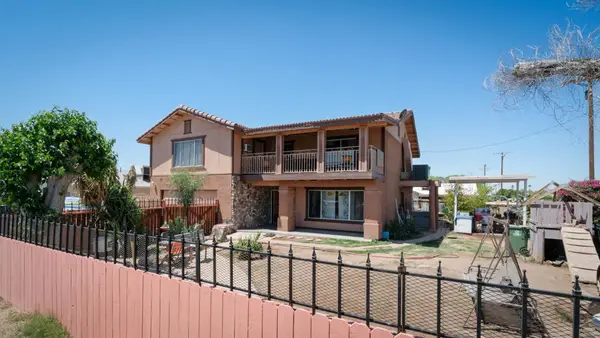
 $430,000Active6 beds 4 baths3,174 sq. ft.
407 S Eastern Avenue, Brawley, CA 92227
MLS# 219144282DAListed by: CENTURY 21 MASTERS $949,999Active3 beds 2 baths1,760 sq. ft.
2310 W Highway 86 Road, Brawley, CA 92227
MLS# CRNDP2601235Listed by: NEW PALACE REALTY $350,000Active0.41 Acres
601 E Main Street, Brawley, CA 92227
MLS# CRWS25241084Listed by: KELLER WILLIAMS REALTY/TEMECULA $350,000Active0.41 Acres
601 E Main Street, Brawley, CA 92227
MLS# WS25241084Listed by: KELLER WILLIAMS REALTY/TEMECULA $250,000Active3 beds 1 baths900 sq. ft.
1109 B Street, Brawley, CA 92227
MLS# CRCV25096969Listed by: COLDWELL BANKER ICON $403Active0 Acres
0 St.test, Brawley, CA 92227
MLS# 16126184Listed by: COMBINED L.A. WESTSIDE, MLS
Local realty services provided by:CENTURY 21 Sierra Properties, CENTURY 21 Century Real Estate, CENTURY 21 Affiliated
The information being provided by California Regional MLS (Southern California) is for the consumer's personal, non-commercial use and may not be used for any purpose other than to identify prospective properties consumer may be interested in purchasing. Any information relating to real estate for sale referenced on this web site comes from the Internet Data Exchange (IDX) program of the California Regional MLS (Southern California). CENTURY 21 Century Real Estate is not a Multiple Listing Service (MLS), nor does it offer MLS access. This website is a service of CENTURY 21 Century Real Estate, a broker participant of California Regional MLS (Southern California). This web site may reference real estate listing(s) held by a brokerage firm other than the broker and/or agent who owns this web site.
The accuracy of all information, regardless of source, including but not limited to open house information, square footages and lot sizes, is deemed reliable but not guaranteed and should be personally verified through personal inspection by and/or with the appropriate professionals. The data contained herein is copyrighted by California Regional MLS (Southern California) and is protected by all applicable copyright laws. Any unauthorized dissemination of this information is in violation of copyright laws and is strictly prohibited.
Copyright 2021 California Regional MLS (Southern California). All rights reserved.
This information is deemed reliable but not guaranteed. You should rely on this information only to decide whether or not to further investigate a particular property. BEFORE MAKING ANY OTHER DECISION, YOU SHOULD PERSONALLY INVESTIGATE THE FACTS (e.g. square footage and lot size) with the assistance of an appropriate professional. You may use this information only to identify properties you may be interested in investigating further. All uses except for personal, non-commercial use in accordance with the foregoing purpose are prohibited. Redistribution or copying of this information, any photographs or video tours is strictly prohibited. This information is derived from the Internet Data Exchange (IDX) service provided by San Diego MLS®. Displayed property listings may be held by a brokerage firm other than the broker and/or agent responsible for this display. The information and any photographs and video tours and the compilation from which they are derived is protected by copyright. Compilation © 2020 San Diego MLS®, Inc.
Neighborhoods near Brawley, CA
Zip codes near Brawley, CA
- 85336 homes for sale
- 85364 homes for sale
- 91905 homes for sale
- 91934 homes for sale
- 92004 homes for sale
- 92036 homes for sale
- 92227 homes for sale
- 92231 homes for sale
- 92233 homes for sale
- 92243 homes for sale
- 92250 homes for sale
- 92251 homes for sale
- 92254 homes for sale
- 92257 homes for sale
- 92259 homes for sale
- 92266 homes for sale
- 92274 homes for sale
- 92275 homes for sale
- 92281 homes for sale
- 92283 homes for sale
Popular searches near Brawley, CA
- Bombay Beach homes for sale
- Borrego Springs homes for sale
- Boulevard homes for sale
- Calexico homes for sale
- Calipatria homes for sale
- Calipatria-Westmorland homes for sale
- East Imperial homes for sale
- El Centro homes for sale
- Holtville homes for sale
- Imperial homes for sale
- Jacumba homes for sale
- Mecca homes for sale
- Niland homes for sale
- North Shore homes for sale
- Oasis homes for sale
- Ocotillo homes for sale
- Salton City homes for sale
- Salton Sea Beach homes for sale
- West Imperial homes for sale
- Westmorland homes for sale
Protect your home and budget from life's surprises with an Assurant Home Warranty, backed by a partner that supports you through every step of homeownership. Explore Plans.
©2026 Century 21 Real Estate LLC. All rights reserved. CENTURY 21®, the CENTURY 21 Logo and C21® are service marks owned by Century 21 Real Estate LLC. Century 21 Real Estate LLC fully supports the principles of the Fair Housing Act and the Equal Opportunity Act. Each office is independently owned and operated. Listing information is deemed reliable but not guaranteed accurate.