- Ashworth Estates, West Des Moines homes for sale
- Bridgewood North, West Des Moines homes for sale
- Bristol Cove, Urbandale homes for sale
- Corene Acres, Waukee homes for sale
- Country Club, Clive homes for sale
- Fairmeadows, West Des Moines homes for sale
- Glynn Village, Waukee homes for sale
- Golf View Estates, Urbandale homes for sale
- Grant Park, Waukee homes for sale
- Hallbrook, Urbandale homes for sale
- Karen Acres, Urbandale homes for sale
- Parkview, Urbandale homes for sale
- Southwestern Hills, Des Moines homes for sale
- Southwoods Knolls, West Des Moines homes for sale
- Stonegate, Clive homes for sale
- Valley Junction, West Des Moines homes for sale
- Waveland Woods, Des Moines homes for sale
- Westwood, Des Moines homes for sale
- Willow Brook, Waukee homes for sale
- Windfield, Waukee homes for sale
Bridgewater, IA - homes for sale
2 of 2 results displayed
 $395,000Active18 beds 10 baths
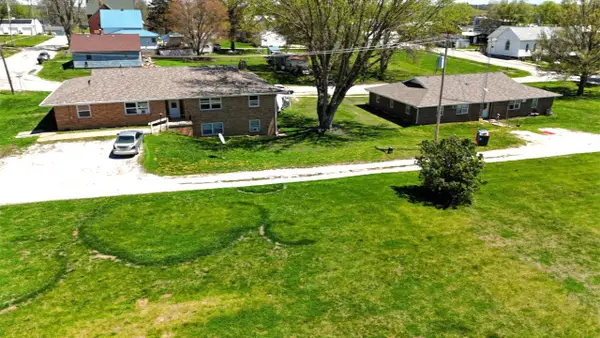
206 and 212 Nw Walnut Street, Bridgewater, IA 50837
MLS# 718083Listed by: PELLA REAL ESTATE SERVICES $200,000Pending16 beds 10 baths
206 NW Walnut Street, Bridgewater, IA 50837
MLS# 621017Listed by: RE/MAX PRECISION
Local realty services provided by:CENTURY 21 Signature Real Estate
Neighborhoods near Bridgewater, IA
Zip codes near Bridgewater, IA
- 50002 homes for sale
- 50020 homes for sale
- 50022 homes for sale
- 50048 homes for sale
- 50070 homes for sale
- 50115 homes for sale
- 50149 homes for sale
- 50155 homes for sale
- 50250 homes for sale
- 50801 homes for sale
- 50830 homes for sale
- 50841 homes for sale
- 50846 homes for sale
- 50849 homes for sale
- 50851 homes for sale
- 50853 homes for sale
- 50858 homes for sale
- 50864 homes for sale
- 51535 homes for sale
- 51573 homes for sale
Popular searches near Bridgewater, IA
- Adair homes for sale
- Adair homes for sale
- Anita homes for sale
- Atlantic homes for sale
- Audubon township homes for sale
- Casey homes for sale
- Corning homes for sale
- Creston homes for sale
- Fontanelle homes for sale
- Grant homes for sale
- Greenfield homes for sale
- Griswold homes for sale
- Grove homes for sale
- Lincoln homes for sale
- Orient homes for sale
- Pleasant homes for sale
- Quincy homes for sale
- Summerset homes for sale
- Summit homes for sale
- Thompson homes for sale
Protect your home and budget from life's surprises with an Assurant Home Warranty, backed by a partner that supports you through every step of homeownership. Explore Plans.
©2026 Century 21 Real Estate LLC. All rights reserved. CENTURY 21®, the CENTURY 21 Logo and C21® are service marks owned by Century 21 Real Estate LLC. Century 21 Real Estate LLC fully supports the principles of the Fair Housing Act and the Equal Opportunity Act. Each office is independently owned and operated. Listing information is deemed reliable but not guaranteed accurate.