- Avondale, Pensacola homes for sale
- Baymark, Pensacola homes for sale
- Brent, Pensacola homes for sale
- Brownsville North, Pensacola homes for sale
- Carriage Hills, Pensacola homes for sale
- Crescent Lake, Pensacola homes for sale
- Downtown Pensacola, Pensacola homes for sale
- East Downtown Pensacola, Pensacola homes for sale
- Eastmount, Pensacola homes for sale
- Goulding, Pensacola homes for sale
- Mayfair, Pensacola homes for sale
- Montclair, Pensacola homes for sale
- Myrtle Grove, Pensacola homes for sale
- Myrtle Grove Northwest, Pensacola homes for sale
- Myrtle Grove Southwest, Pensacola homes for sale
- Renz-anna Villa, Pensacola homes for sale
- St. John Coalition, Pensacola homes for sale
- Sunny Ridge, Pensacola homes for sale
- Warrington, Pensacola homes for sale
- West Pensacola, Pensacola homes for sale
Brownsville South, Pensacola, FL - homes for sale
21 of 21 results displayed
- New
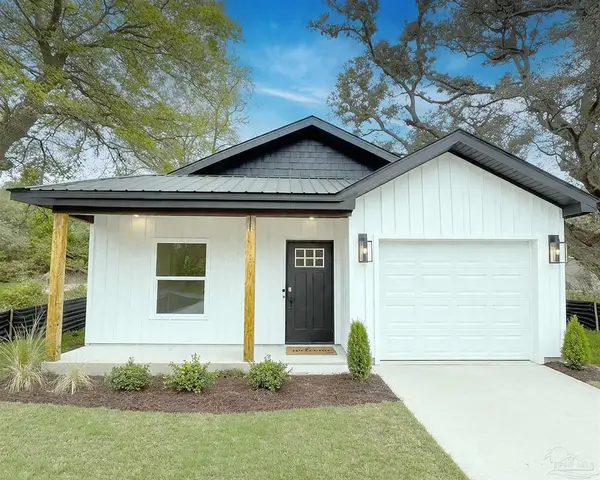 $245,000Active3 beds 2 baths1,205 sq. ft.
3502 W Cervantes, Pensacola, FL 32505
MLS# 679916Listed by: REMAX SELECT PARTNERS - Open Sat, 11am to 1pmNew
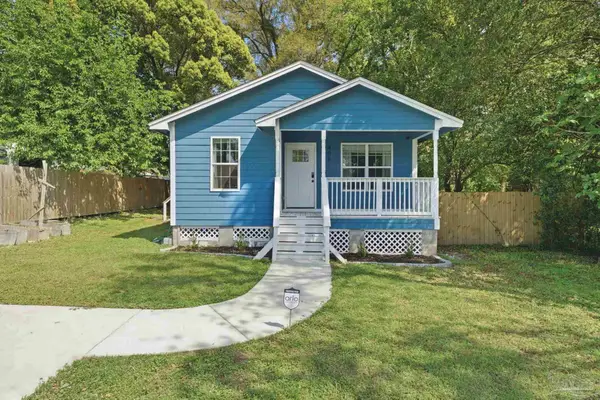 $225,900Active3 beds 2 baths1,072 sq. ft.
408 N W St, Pensacola, FL 32505
MLS# 679468Listed by: KELLER WILLIAMS REALTY GULF COAST 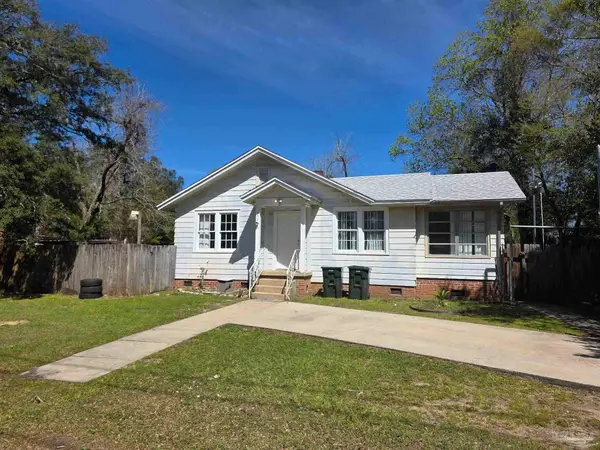
 $155,000Active4 beds 2 baths1,015 sq. ft.
3624 W Jackson St, Pensacola, FL 32505
MLS# 679461Listed by: CENTURY 21 AMERISOUTH REALTY $145,000Active2 beds 1 baths1,360 sq. ft.
3705 W Cervantes St, Pensacola, FL 32505
MLS# 679447Listed by: HOMESMART SUNSHINE REALTY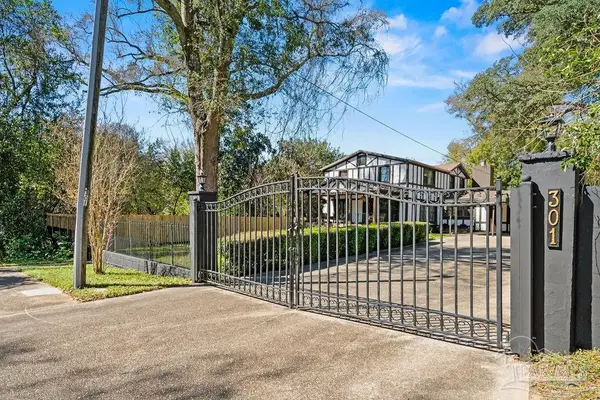 $285,000Pending4 beds 3 baths2,661 sq. ft.
301 Grandview St, Pensacola, FL 32505
MLS# 679310Listed by: REALTY ONE GROUP EMERALD COAST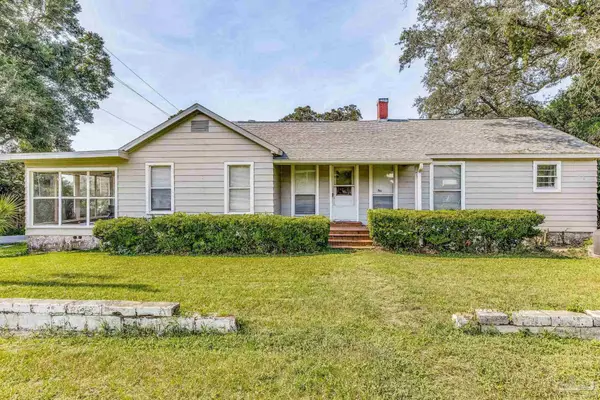 $365,000Active5 beds 3 baths2,709 sq. ft.
3401 W Jackson St, Pensacola, FL 32505
MLS# 678738Listed by: KELLER WILLIAMS REALTY GULF COAST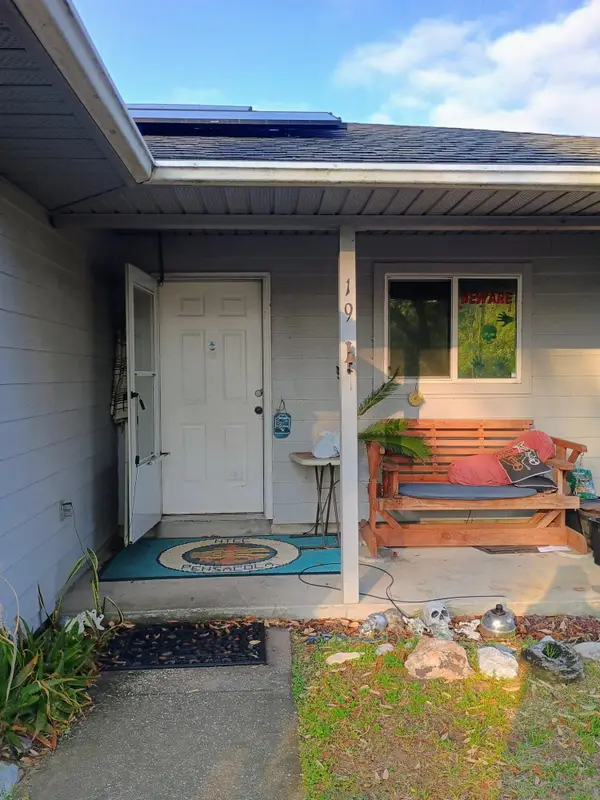 $210,000Active2 beds 1 baths1,162 sq. ft.
19 Srant Drive, City of Pensacola, FL 32506
MLS# 996571Listed by: COLDWELL BANKER REALTY $249,900Active4 beds 2 baths2,112 sq. ft.
401 N Green St, Pensacola, FL 32505
MLS# 678297Listed by: BERKSHIRE HATHAWAY HOME SERVICES PENFED REALTY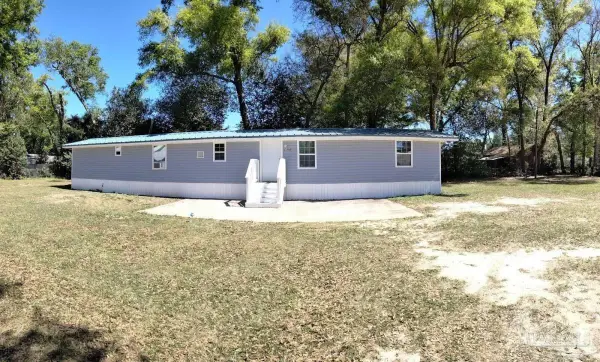 $173,400Active-- beds -- baths2,240 sq. ft.
4108 W Jackson St, Pensacola, FL 32505
MLS# 678186Listed by: FLATFEE.COM INC.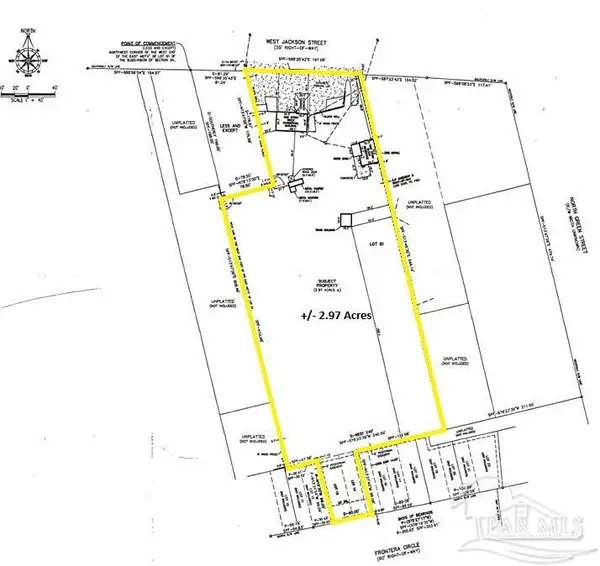 $435,000Active2.94 Acres
3705 & 3709 W Jackson St, Pensacola, FL 32505
MLS# 677943Listed by: ALLIANCE REAL ESTATE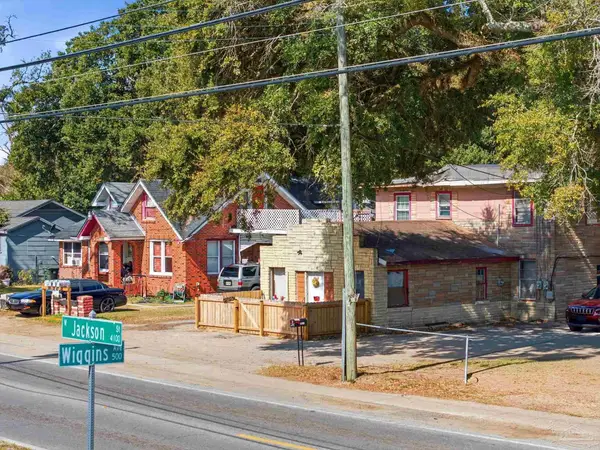 $325,000Active-- beds -- baths4,284 sq. ft.
4200 W Jackson St, Pensacola, FL 32505
MLS# 677685Listed by: BASTION REALTY LLC $75,000Active0.09 Acres
4143 W Gadsden St, Pensacola, FL 32505
MLS# 677686Listed by: BASTION REALTY LLC $169,900Active2 beds 1 baths774 sq. ft.
39 Sandalwood St, Pensacola, FL 32505
MLS# 675339Listed by: COLDWELL BANKER REALTY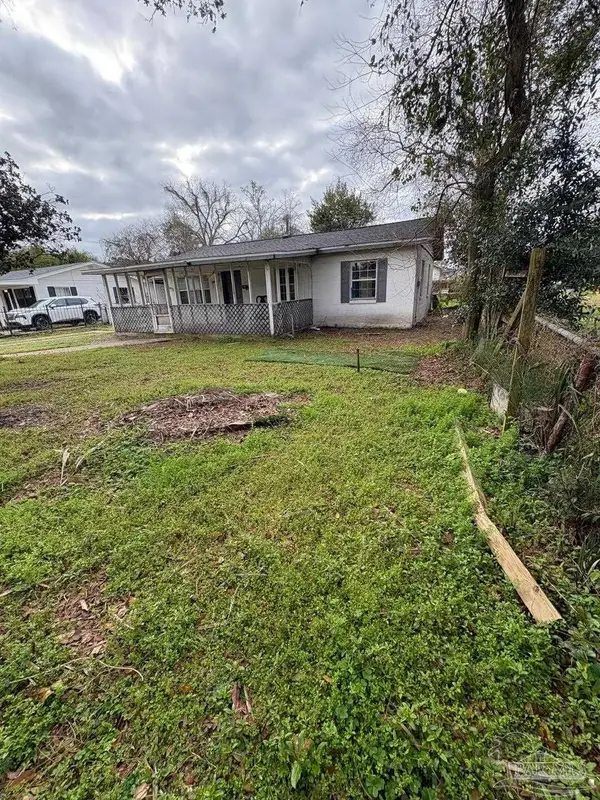 $45,000Active3 beds 1 baths1,137 sq. ft.
3703 W Theresa St, Pensacola, FL 32505
MLS# 673225Listed by: BASTION REALTY LLC $165,000Active0.09 Acres
400 BLK W Intendencia St, Pensacola, FL 32502
MLS# 671547Listed by: COLDWELL BANKER REALTY $26,000Active0.34 Acres
125 Alice St, Pensacola, FL 32505
MLS# 665255Listed by: CENTURY 21 AMERISOUTH REALTY $129,500Active4 beds 1 baths1,041 sq. ft.
22 Gloucester Ave, Pensacola, FL 32505
MLS# 663407Listed by: OLD SOUTH PROPERTIES INC $115,000Active2 beds 2 baths1,048 sq. ft.
4421 W Jackson St, Pensacola, FL 32506
MLS# 660208Listed by: RE/MAX GULF PROPERTIES $140,000Active-- beds -- baths1,404 sq. ft.
3804 Ward Blvd, Pensacola, FL 32505
MLS# 656963Listed by: KELLER WILLIAMS REALTY GULF COAST $127,000Active3 beds 1 baths864 sq. ft.
122 Alice St, Pensacola, FL 32505
MLS# 652272Listed by: COSTA MIAMI REALTY, LLC $30,000Active0.15 Acres
3813 W Cervantes, Pensacola, FL 32505
MLS# 645895Listed by: KELLER WILLIAMS REALTY GULF COAST
Local realty services provided by:CENTURY 21 Beggins Enterprises, CENTURY 21 Wimco Realty, Inc.
The information being provided by Pensacola Association Of REALTORS® is for the consumer's personal, non-commercial use and may not be used for any purpose other than to identify prospective properties consumer may be interested in purchasing. Any information relating to real estate for sale referenced on this web site comes from the Internet Data Exchange (IDX) program of the Pensacola Association Of REALTORS®. CENTURY 21 Beggins Enterprises is not a Multiple Listing Service (MLS), nor does it offer MLS access. This website is a service of CENTURY 21 Beggins Enterprises, a broker participant of Pensacola Association Of REALTORS®. This web site may reference real estate listing(s) held by a brokerage firm other than the broker and/or agent who owns this web site.
The accuracy of all information, regardless of source, including but not limited to open house information, square footages and lot sizes, is deemed reliable but not guaranteed and should be personally verified through personal inspection by and/or with the appropriate professionals. The data contained herein is copyrighted by Pensacola Association Of REALTORS® and is protected by all applicable copyright laws. Any unauthorized dissemination of this information is in violation of copyright laws and is strictly prohibited.
Properties in listings may have been sold or may no longer be available.
Copyright 2026 Pensacola Association Of REALTORS®. All rights reserved.
Popular neighborhoods near Brownsville South, Pensacola, FL
Zip codes near Brownsville South, Pensacola, FL
- 32501 homes for sale
- 32502 homes for sale
- 32503 homes for sale
- 32504 homes for sale
- 32505 homes for sale
- 32506 homes for sale
- 32507 homes for sale
- 32514 homes for sale
- 32526 homes for sale
- 32530 homes for sale
- 32533 homes for sale
- 32534 homes for sale
- 32561 homes for sale
- 32563 homes for sale
- 32566 homes for sale
- 32571 homes for sale
- 36530 homes for sale
- 36549 homes for sale
- 36561 homes for sale
- 36574 homes for sale
Counties near Brownsville South, Pensacola, FL
- Baldwin County homes for sale
- Butler County homes for sale
- Clarke County homes for sale
- Conecuh County homes for sale
- Covington County homes for sale
- Escambia County homes for sale
- Escambia County homes for sale
- Geneva County homes for sale
- George County homes for sale
- Greene County homes for sale
- Holmes County homes for sale
- Jackson County homes for sale
- Mobile County homes for sale
- Monroe County homes for sale
- Okaloosa County homes for sale
- Santa Rosa County homes for sale
- Walton County homes for sale
- Washington County homes for sale
- Washington County homes for sale
Protect your home and budget from life's surprises with an Assurant Home Warranty, backed by a partner that supports you through every step of homeownership. Explore Plans.
©2026 Century 21 Real Estate LLC. All rights reserved. CENTURY 21®, the CENTURY 21 Logo and C21® are service marks owned by Century 21 Real Estate LLC. Century 21 Real Estate LLC fully supports the principles of the Fair Housing Act and the Equal Opportunity Act. Each office is independently owned and operated. Listing information is deemed reliable but not guaranteed accurate.