- Colonia Victoria, Brownsville homes for sale
- Country Club Estates at Vicc, Brownsville homes for sale
- Del Mar Heights, Los Fresnos homes for sale
- Downtown, Brownsville homes for sale
- El Valle Grande, Brownsville homes for sale
- Encantada-Ranchito El Calaboz, San Benito homes for sale
- Indian Lake, Los Fresnos homes for sale
- Iowa Estates, Brownsville homes for sale
- Isla de Palmas, Brownsville homes for sale
- La Paloma, San Benito homes for sale
- Land O'Lake, Brownsville homes for sale
- Los Ebanos, Brownsville homes for sale
- Olmito, Olmito homes for sale
- Reid Hope King, Brownsville homes for sale
- Rio Del Sol, Brownsville homes for sale
- Riverside Park, Brownsville homes for sale
- South Padre Island Golf Club, Port Isabel homes for sale
- Villa Los Pinos, Brownsville homes for sale
- Villa Pancho, Brownsville homes for sale
- Winter Haven, Brownsville homes for sale
Brownsville, TX - homes for sale
300 of 1,385 results displayed
- New
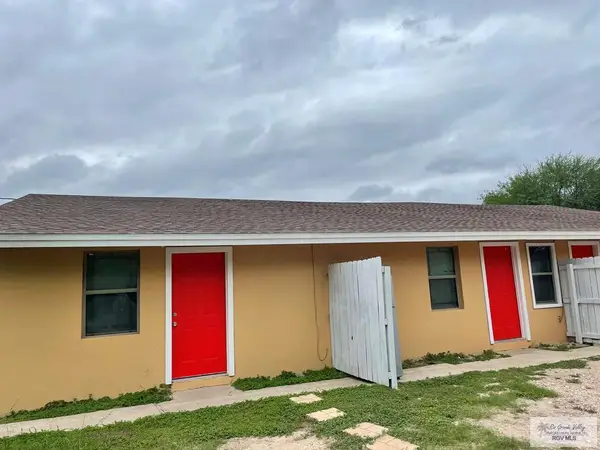
 $135,000Active1 beds 1 baths748 sq. ft.
800-1 Continental Dr., BROWNSVILLE, TX 78520
MLS# 29775383Listed by: EXP REALTY, LLC - New
 $169,000Active2 beds 2 baths1,352 sq. ft.
24 Calle Retama #202-F, BROWNSVILLE, TX 78520
MLS# 29775374Listed by: RE/MAX ELITE BROWNSVILLE - New
 $270,000Active4 beds 2 baths1,900 sq. ft.
20 Casa Linda, BROWNSVILLE, TX 78521
MLS# 29775357Listed by: RCR REAL CONNECT REALTY - New
 $210,000Active3 beds 2 baths1,077 sq. ft.
545 Limon Ln., BROWNSVILLE, TX 78521
MLS# 29775358Listed by: RCR REAL CONNECT REALTY - New
 $210,000Active3 beds 2 baths1,352 sq. ft.
6334 Achievement Ave., BROWNSVILLE, TX 78526
MLS# 29775356Listed by: RCR REAL CONNECT REALTY - New
 $224,900Active3 beds 2 baths1,459 sq. ft.
4065 Diego Ln., BROWNSVILLE, TX 78521
MLS# 29775350Listed by: SANMAR ELITE PROPERTIES - New
 $195,000Active4 beds 2 baths1,411 sq. ft.
45 Calle Princesa, BROWNSVILLE, TX 78520
MLS# 29775338Listed by: COLDWELL BANKER LA MANSION REAL ESTATE BROWNSVILLE - New
 $89,500Active0.35 Acres
-- Dakota Garden Cir, BROWNSVILLE, TX 78521
MLS# 29775340Listed by: COLDWELL BANKER LA MANSION REAL ESTATE BROWNSVILLE - New
 $230,000Active3 beds 2 baths1,632 sq. ft.
3109 Ascension Dr., BROWNSVILLE, TX 78526
MLS# 29775331Listed by: E.P.S. REALTORS - New
 $335,000Active3 beds 3 baths1,922 sq. ft.
6854 Woodstock Dr., BROWNSVILLE, TX 78526
MLS# 29775319Listed by: EXCEL REALTY - New
 $260,000Active3 beds 2 baths1,250 sq. ft.
7121 Laguna Madre Dr., BROWNSVILLE, TX 78521
MLS# 29775317Listed by: EXCEL REALTY - New
 $105,000Active2 beds 2 baths1,110 sq. ft.
2304 Shidler Dr. #Apt 66, BROWNSVILLE, TX 78521
MLS# 29775304Listed by: RCR REAL CONNECT REALTY - New
 $160,000Active3 beds 2 baths972 sq. ft.
4679 Palacio Real Drive, Brownsville, TX 78521
MLS# 500586Listed by: Star Realty Group, Llc - New
 $270,000Active3 beds 2 baths1,545 sq. ft.
2924 Zeb Dr, BROWNSVILLE, TX 78526
MLS# 29775298Listed by: GRT REALTY - New
 $205,000Active3 beds 2 baths1,889 sq. ft.
1768 Marquette Ave., BROWNSVILLE, TX 78520
MLS# 29775300Listed by: REALTY ONE GROUP, MODERN EDGE - New
 $59,000Active0.15 Acres
-- Calle Reyna, BROWNSVILLE, TX 78520
MLS# 29775294Listed by: COLDWELL BANKER LA MANSION REAL ESTATE BROWNSVILLE - New
 $384,500Active3 beds 3 baths1,942 sq. ft.
6148 Mackenna Dr, BROWNSVILLE, TX 78526
MLS# 29775291Listed by: KELLER WILLIAMS LRGV - New
 $447,000Active-- beds -- baths2,570 sq. ft.
3220 Alegre Dr, BROWNSVILLE, TX 78526
MLS# 29775289Listed by: TEXAS STARS REALTY GROUP, LLC - New
 $269,999Active4 beds 2 baths1,595 sq. ft.
1173 Miami, BROWNSVILLE, TX 78521
MLS# 29775284Listed by: RCR REAL CONNECT REALTY - New
 $456,000Active4 beds 3 baths2,281 sq. ft.
5733 Woods Country Ave, BROWNSVILLE, TX 78526
MLS# 29775276Listed by: RE/MAX ELITE BROWNSVILLE - New
 $459,000Active4 beds 3 baths2,297 sq. ft.
5738 Woods Country Ave, BROWNSVILLE, TX 78526
MLS# 29775277Listed by: RE/MAX ELITE BROWNSVILLE  $159,000Active1.16 Acres
9790 Lomax Rd, OLMITO, TX 78566
MLS# 29774963Listed by: JWA REALTY- New
 $385,000Active-- beds -- baths2,974 sq. ft.
1336 Daytona Beach Ct, BROWNSVILLE, TX 78520
MLS# 29775263Listed by: COLDWELL BANKER LA MANSION REAL ESTATE BROWNSVILLE - New
 $169,000Active3 beds 2 baths1,436 sq. ft.
1315 Barnard, BROWNSVILLE, TX 78520
MLS# 29775257Listed by: KELLER WILLIAMS LRGV - New
 $245,000Active4 beds 2 baths1,419 sq. ft.
1248 Titusville, BROWNSVILLE, TX 78521
MLS# 29775260Listed by: RCR REAL CONNECT REALTY - New
 $99,500Active3 beds 1 baths1,156 sq. ft.
1244 Delpha Dr., BROWNSVILLE, TX 78521
MLS# 29775252Listed by: ARNOLD CELIS REALTY, LLC - New
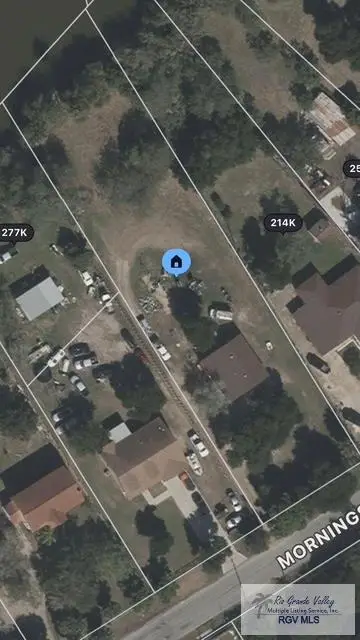
 $250,000Active1.66 Acres
0.00 Morningside Rd. #25, BROWNSVILLE, TX 78521
MLS# 29775250Listed by: RCR REAL CONNECT REALTY - New
 $225,000Active2 beds 2 baths816 sq. ft.
1734 Morningside Rd. #27, BROWNSVILLE, TX 78520
MLS# 29775248Listed by: RCR REAL CONNECT REALTY - New
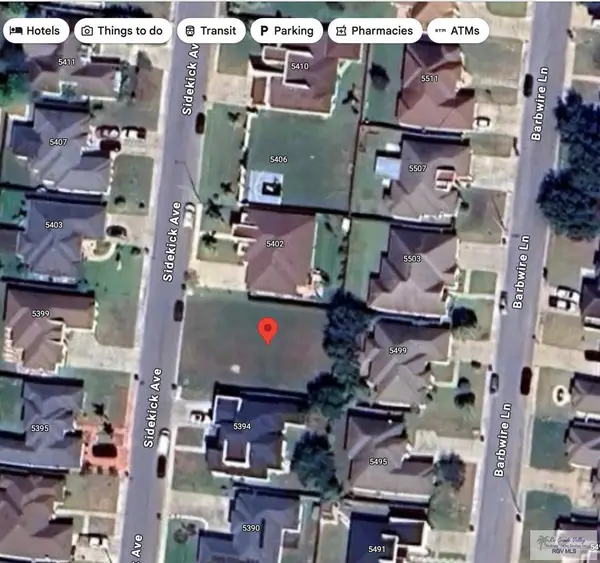 $140,000Active0.18 Acres
5398 Sidekick, BROWNSVILLE, TX 78526
MLS# 29775249Listed by: BOB TORRES PROPERTIES - New
 $280,000Active3 beds 2 baths1,560 sq. ft.
7367 St Catherine Dr #Lot 12 Blk 12, BROWNSVILLE, TX 78520
MLS# 29775244Listed by: D1 TEXAS REALTY - New
 $264,000Active4 beds 2 baths1,398 sq. ft.
2791 Capri Street, Brownsville, TX 78520
MLS# 500048Listed by: Imperio Real Estate Llc - New
 $280,000Active3 beds 2 baths1,488 sq. ft.
4015 Tito Ct., BROWNSVILLE, TX 78520
MLS# 29775241Listed by: CORNERSTONE TX REALTY - New
 $649,000Active-- beds -- baths4,212 sq. ft.
221 Billings Rd. #2, BROWNSVILLE, TX 78521
MLS# 29775239Listed by: RE/MAX ELITE BROWNSVILLE - New
 $220,000Active4 beds 1 baths1,569 sq. ft.
2394 Athens St., BROWNSVILLE, TX 78521
MLS# 29775237Listed by: KELLER WILLIAMS LRGV - New
 $178,000Active3 beds 1 baths1,274 sq. ft.
627 N Dakota Ave., BROWNSVILLE, TX 78521
MLS# 29775224Listed by: LPT REALTY LLC - New
 $339,000Active3 beds 3 baths1,910 sq. ft.
6860 Woodstock Dr. #35, BROWNSVILLE, TX 78526
MLS# 29775219Listed by: RE/MAX ELITE BROWNSVILLE - New
 $345,000Active4 beds 4 baths2,039 sq. ft.
8870 Wentz Lake, BROWNSVILLE, TX 78526
MLS# 29775220Listed by: ALTUS REAL ESTATE GROUP, LLC - New
 $280,000Active3 beds 2 baths1,464 sq. ft.
6712 Colibri Cir, BROWNSVILLE, TX 78521
MLS# 29775222Listed by: GRT REALTY - New
 $330,000Active3 beds 3 baths1,798 sq. ft.
6971 Heritage Oak Dr, BROWNSVILLE, TX 78526
MLS# 29775223Listed by: EXCEL REALTY - New
 $224,500Active3 beds 3 baths1,102 sq. ft.
6684 Pino Verde Dr., BROWNSVILLE, TX 78524
MLS# 29775154Listed by: CHACON REALTY, LLC - New
 $245,000Active4 beds 2 baths1,397 sq. ft.
43852 Red Valley Ave, BROWNSVILLE, TX 78521
MLS# 29775214Listed by: RCR REAL CONNECT REALTY - New
 $169,000Active-- beds -- baths2,400 sq. ft.
1070 Raul A Cavazos, BROWNSVILLE, TX 78520
MLS# 29775195Listed by: GRT REALTY  $70,000Active10.1 Acres
LOT 97 & 98 Acuna St, BROWNSVILLE, TX 78521
MLS# 29762763Listed by: COLDWELL BANKER IMPACT PROPERTIES $35,000Active5.05 Acres
Lot 84 Acuna St, BROWNSVILLE, TX 78521
MLS# 29762765Listed by: COLDWELL BANKER IMPACT PROPERTIES- New
 $160,000Active0.61 Acres
Address Withheld By Seller, BROWNSVILLE, TX 78526
MLS# 29775184Listed by: CLAYA CRE - New
 $160,000Active0.61 Acres
Address Withheld By Seller, BROWNSVILLE, TX 78526
MLS# 29775185Listed by: CLAYA CRE - New
 $160,000Active0.69 Acres
Address Withheld By Seller, BROWNSVILLE, TX 78526
MLS# 29775186Listed by: CLAYA CRE - New
 $160,000Active0.69 Acres
5220 Camila Ct #10, BROWNSVILLE, TX 78526
MLS# 29775187Listed by: CLAYA CRE - New
 $160,000Active0.69 Acres
Address Withheld By Seller, BROWNSVILLE, TX 78526
MLS# 29775189Listed by: CLAYA CRE - New
 $315,000Active4 beds 2 baths1,853 sq. ft.
3516 Simmons Place Dr., BROWNSVILLE, TX 78520
MLS# 29775191Listed by: GRT REALTY - New
 $195,000Active3 beds 2 baths1,242 sq. ft.
2024 Carranza St., BROWNSVILLE, TX 78526
MLS# 29775177Listed by: KELLER WILLIAMS LRGV - New
 $397,000Active4 beds 4 baths2,204 sq. ft.
7003 Heritage Oak Dr, BROWNSVILLE, TX 78526
MLS# 29775172Listed by: RE/MAX ELITE BROWNSVILLE - New
 $145,000Active-- beds -- baths2,738 sq. ft.
902 E Monroe St., BROWNSVILLE, TX 78520
MLS# 29775162Listed by: EXP REALTY, LLC - New
 $300,000Active4 beds 3 baths2,540 sq. ft.
3 W Maple Cir, BROWNSVILLE, TX 78521
MLS# 29775151Listed by: RE/MAX ELITE BROWNSVILLE - New
 $305,000Active3 beds 3 baths1,610 sq. ft.
3722 Avenida Residencial, BROWNSVILLE, TX 78526
MLS# 29775142Listed by: RE/MAX ELITE BROWNSVILLE  $52,000Active0.11 Acres
2803 Alameda Dr., BROWNSVILLE, TX 78521
MLS# 29770739Listed by: COLDWELL BANKER LA MANSION REAL ESTATE BROWNSVILLE- New
 $335,000Active4 beds 3 baths1,891 sq. ft.
6209 Mackenna Dr, BROWNSVILLE, TX 78526
MLS# 29775137Listed by: KELLER WILLIAMS LRGV - New
 $209,000Active3 beds 2 baths1,136 sq. ft.
422 Rey Jaime St., BROWNSVILLE, TX 78521
MLS# 29775125Listed by: REALTY ONE GROUP, MODERN EDGE - Open Sat, 1 to 3pmNew
 $440,500Active4 beds 4 baths2,377 sq. ft.
8804 Jupiter St., BROWNSVILLE, TX 78521
MLS# 29775127Listed by: REALTY ONE GROUP, MODERN EDGE - New
 $145,000Active2 beds 1 baths850 sq. ft.
205 Calle Amistosa, Brownsville, TX 78520
MLS# 492192Listed by: Coldwell Banker La Mansion - New
 $149,500Active3 beds 2 baths1,568 sq. ft.
1344 E Monroe St., BROWNSVILLE, TX 78520
MLS# 29775116Listed by: D1 TEXAS REALTY  $185,000Active4 beds 2 baths1,558 sq. ft.
247 Zena Dr., BROWNSVILLE, TX 78521
MLS# 29774943Listed by: TEXAS STARS REALTY GROUP, LLC- New
 $285,000Active3 beds 3 baths1,610 sq. ft.
3745 Altamira Dr, BROWNSVILLE, TX 78520
MLS# 29775112Listed by: EXP REALTY, LLC - New
 $640,000Active-- beds -- baths5,758 sq. ft.
1035 S Central Avenue, Brownsville, TX 78521
MLS# 498946Listed by: Coldwell Banker La Mansion - New
 $88,500Active0.2 Acres
4501 New Mexico Way, BROWNSVILLE, TX 78521
MLS# 29775105Listed by: RCR REAL CONNECT REALTY - New
 $440,000Active-- beds -- baths4,576 sq. ft.
604 Villa Maria Boulevard, Brownsville, TX 78520
MLS# 498929Listed by: Coldwell Banker La Mansion - New
 $399,000Active3.03 Acres
515 Acacia Lake Drive, Brownsville, TX 78521
MLS# 498662Listed by: Keller Williams Realty Rgv - New
 $189,000Active3 beds 3 baths1,556 sq. ft.
203 W Saint Charles St., BROWNSVILLE, TX 78520
MLS# 29775102Listed by: SUPERIOR ONE REALTY - New
 $395,000Active4 beds 3 baths2,356 sq. ft.
7247 Rain Forest Dr, BROWNSVILLE, TX 78520
MLS# 29775101Listed by: RE/MAX SUN VALLEY REALTORS  $157,500Active0.66 Acres
34604 Esmeralda Drive, Brownsville, TX 78526
MLS# 498783Listed by: D1 Texas Realty- New
 $269,999Active4 beds 2 baths1,595 sq. ft.
1169 Miami, BROWNSVILLE, TX 78521
MLS# 29775100Listed by: RCR REAL CONNECT REALTY  $157,500Active0.64 Acres
38958 Ely Ct #Lot 2 Blk 3, BROWNSVILLE, TX 78526
MLS# 29775082Listed by: D1 TEXAS REALTY $92,625Active0.22 Acres
2706 Arely Ln, BROWNSVILLE, TX 78526
MLS# 29775085Listed by: RCR REAL CONNECT REALTY $145,000Active0.53 Acres
34578 Esmeralda Dr #LOT 11 Blk 2, BROWNSVILLE, TX 78526
MLS# 29775086Listed by: D1 TEXAS REALTY $145,000Active0.53 Acres
34558 Esmeralda Dr #LOT 10 Blk 2, BROWNSVILLE, TX 78526
MLS# 29775087Listed by: D1 TEXAS REALTY $157,500Active0.66 Acres
34604 Esmeralda Dr #LOT 12 Blk 2, BROWNSVILLE, TX 78526
MLS# 29775088Listed by: D1 TEXAS REALTY $89,138Active0.22 Acres
2710 Arely Ln, BROWNSVILLE, TX 78526
MLS# 29775089Listed by: RCR REAL CONNECT REALTY $108,442Active0.26 Acres
2714 Arely Ln, BROWNSVILLE, TX 78526
MLS# 29775090Listed by: RCR REAL CONNECT REALTY $153,000Active0.6 Acres
38949 Ely Ct #Lot 4 Blk 3, BROWNSVILLE, TX 78526
MLS# 29775091Listed by: D1 TEXAS REALTY $153,000Active0.6 Acres
38957 Ely Ct #Lot 5 Blk 3, BROWNSVILLE, TX 78526
MLS# 29775092Listed by: D1 TEXAS REALTY $113,344Active0.27 Acres
2718 Arely Ln, BROWNSVILLE, TX 78526
MLS# 29775093Listed by: RCR REAL CONNECT REALTY $87,115Active0.21 Acres
2722 Arely Ln, BROWNSVILLE, TX 78526
MLS# 29775094Listed by: RCR REAL CONNECT REALTY $83,362Active0.2 Acres
2726 Arely Ln, BROWNSVILLE, TX 78526
MLS# 29775095Listed by: RCR REAL CONNECT REALTY $91,295Active0.22 Acres
2730 Arely Ln, BROWNSVILLE, TX 78526
MLS# 29775097Listed by: RCR REAL CONNECT REALTY $157,500Active0.62 Acres
38950 Ely Ct #LOT 3 Blk 3, BROWNSVILLE, TX 78526
MLS# 29775058Listed by: D1 TEXAS REALTY $92,625Active0.22 Acres
2694 Arely Ln, BROWNSVILLE, TX 78526
MLS# 29775080Listed by: RCR REAL CONNECT REALTY $92,625Active0.22 Acres
2698 Arely Ln, BROWNSVILLE, TX 78526
MLS# 29775081Listed by: RCR REAL CONNECT REALTY $92,625Active0.22 Acres
2702 Arely Ln, BROWNSVILLE, TX 78526
MLS# 29775083Listed by: RCR REAL CONNECT REALTY $145,000Active0.53 Acres
34538 Esmeralda Dr #LOT 9 Blk 2, BROWNSVILLE, TX 78526
MLS# 29775084Listed by: D1 TEXAS REALTY $157,500Active0.65 Acres
38982 Ely Ct #LOT 1 Blk 3, BROWNSVILLE, TX 78526
MLS# 29775059Listed by: D1 TEXAS REALTY $92,625Active0.22 Acres
2678 Arely Ln, BROWNSVILLE, TX 78526
MLS# 29775076Listed by: RCR REAL CONNECT REALTY $92,625Active0.22 Acres
2682 Arely Ln, BROWNSVILLE, TX 78526
MLS# 29775077Listed by: RCR REAL CONNECT REALTY $92,625Active0.22 Acres
2674 Arely Ln, BROWNSVILLE, TX 78526
MLS# 29775075Listed by: RCR REAL CONNECT REALTY $79,087Active0.19 Acres
2646 Arely Ln, BROWNSVILLE, TX 78526
MLS# 29775073Listed by: RCR REAL CONNECT REALTY $85,452Active0.21 Acres
2650 Arely Ln, BROWNSVILLE, TX 78526
MLS# 29775074Listed by: RCR REAL CONNECT REALTY $100,595Active0.24 Acres
2642 Arely Ln, BROWNSVILLE, TX 78526
MLS# 29775072Listed by: RCR REAL CONNECT REALTY $118,000Active0.18 Acres
0 Torreon Dr., BROWNSVILLE, TX 78526
MLS# 29775057Listed by: COLDWELL BANKER LA MANSION REAL ESTATE BROWNSVILLE $275,000Active3 beds 2 baths1,883 sq. ft.
928 Pine Bluff Dr, BROWNSVILLE, TX 78526
MLS# 29775047Listed by: CANTWELL & COMPANY REAL ESTATE $74,900Active1 beds 1 baths715 sq. ft.
132 Mississippi River Blvd., BROWNSVILLE, TX 78520
MLS# 29775049Listed by: ONE STOP REALTY, INC $161,280Active5 beds 2 baths1,680 sq. ft.
1929 Taxco Dr., BROWNSVILLE, TX 78521
MLS# 29775043Listed by: ENDURE REAL ESTATE, LLC- New
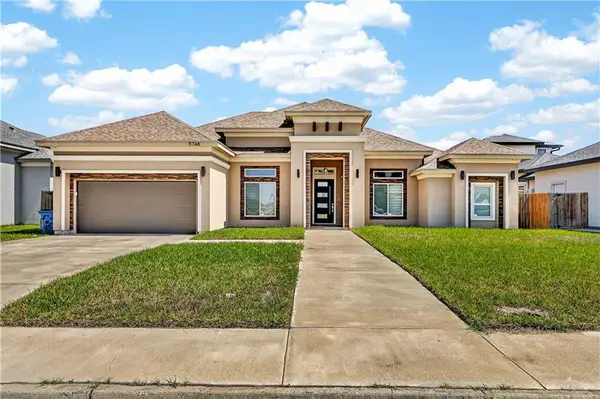 $390,000Active4 beds 3 baths2,361 sq. ft.
5748 Abbey Court, Brownsville, TX 78526
MLS# 500361Listed by: Imperio Real Estate Llc  $84,844Active0.21 Acres
2634 Arely Ln, BROWNSVILLE, TX 78526
MLS# 29775033Listed by: RCR REAL CONNECT REALTY $90,535Active0.22 Acres
2638 Arely Ln, BROWNSVILLE, TX 78526
MLS# 29775034Listed by: RCR REAL CONNECT REALTY $118,740Active0.23 Acres
2618 Arely Ln, BROWNSVILLE, TX 78526
MLS# 29775031Listed by: RCR REAL CONNECT REALTY $110,304Active0.22 Acres
2622 Arely Ln, BROWNSVILLE, TX 78526
MLS# 29775032Listed by: RCR REAL CONNECT REALTY $130,000Active2 beds 1 baths700 sq. ft.
2708 Nannette Avenue, Brownsville, TX 78520
MLS# 498519Listed by: Trademark Real Estate Group $245,000Active4 beds 2 baths1,434 sq. ft.
1056 Oro Blanco Ave, BROWNSVILLE, TX 78521
MLS# 29775021Listed by: RCR REAL CONNECT REALTY $230,000Pending3 beds 3 baths1,480 sq. ft.
6616 Noble Pine, BROWNSVILLE, TX 78526
MLS# 29775013Listed by: LEGACY REALTY GROUP RGV $306,602Active3 beds 2 baths1,980 sq. ft.
3820 Rhine River St, BROWNSVILLE, TX 78520
MLS# 29775011Listed by: IMPERIO REAL ESTATE $340,000Active4 beds 3 baths2,322 sq. ft.
214 Barcelona Ave., BROWNSVILLE, TX 78526
MLS# 29775006Listed by: MCNABB AND CO. REAL ESTATE SERVICES $148,000Active3 beds 2 baths1,084 sq. ft.
34 Veracruz Ave. #4, BROWNSVILLE, TX 78521
MLS# 29775003Listed by: SANMAR ELITE PROPERTIES $369,900Active6 beds 5 baths3,276 sq. ft.
1920 Royal Oak, BROWNSVILLE, TX 78520
MLS# 29774994Listed by: GRT REALTY $219,999Active3 beds 2 baths1,200 sq. ft.
1256 Titusville, BROWNSVILLE, TX 78521
MLS# 29774995Listed by: KELLER WILLIAMS LRGV $239,000Active3 beds 2 baths1,471 sq. ft.
225 Barcelona Ave., BROWNSVILLE, TX 78526
MLS# 29774988Listed by: RE/MAX SUN VALLEY REALTORS $26,000Active0.26 Acres
Lot 6 Hwy 100, SOUTH PADRE ISLAND, TX 78578
MLS# 29774978Listed by: ALFORD HOMETOWN REALTY $250,000Active3 beds 3 baths1,600 sq. ft.
25 Cobblestone Cir., BROWNSVILLE, TX 78526
MLS# 29774974Listed by: COLDWELL BANKER LA MANSION REAL ESTATE BROWNSVILLE $344,900Active3 beds 2 baths2,546 sq. ft.
1570 Los Alamos St., BROWNSVILLE, TX 78521
MLS# 29774734Listed by: RCR REAL CONNECT REALTY $249,000Active3 beds 2 baths1,326 sq. ft.
1589 Res Dr., BROWNSVILLE, TX 78526
MLS# 29774961Listed by: COLDWELL BANKER LA MANSION REAL ESTATE BROWNSVILLE $289,000Active4 beds 3 baths1,610 sq. ft.
7338 Folsom Lake, BROWNSVILLE, TX 78520
MLS# 29774962Listed by: RCR REAL CONNECT REALTY $299,900Active3 beds 2 baths1,702 sq. ft.
837 Sabine River Cir., BROWNSVILLE, TX 78520
MLS# 29774953Listed by: REALTY RGV $130,000Active4 beds 2 baths1,292 sq. ft.
5203 Sonny Dr., BROWNSVILLE, TX 78521
MLS# 29774952Listed by: COLDWELL BANKER LA MANSION REAL ESTATE BROWNSVILLE $220,000Active3 beds 2 baths1,497 sq. ft.
6825 Nansa Dr., BROWNSVILLE, TX 78526
MLS# 29774929Listed by: REALTY ONE GROUP, MODERN EDGE $272,000Active3 beds 2 baths1,479 sq. ft.
1104 Miami, BROWNSVILLE, TX 78521
MLS# 29774934Listed by: EXCEL REALTY $242,000Active3 beds 3 baths1,312 sq. ft.
1108 Miami, BROWNSVILLE, TX 78521
MLS# 29774935Listed by: EXCEL REALTY $105,000Active3 beds 1 baths816 sq. ft.
35 Jo Ann Lane, Brownsville, TX 78520
MLS# 498333Listed by: Real Broker Llc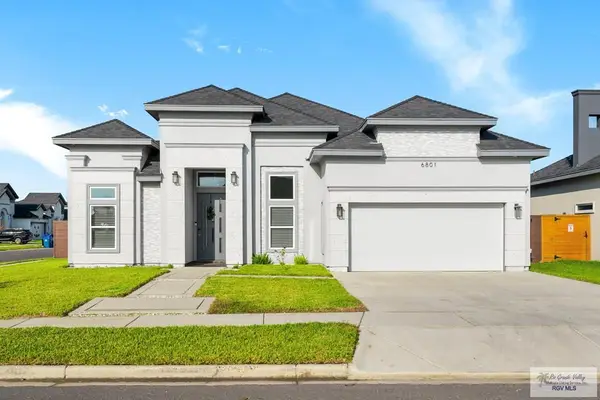 $359,950Pending4 beds 3 baths2,021 sq. ft.
6801 Woodlands Ave. #LOT 34, BROWNSVILLE, TX 78526
MLS# 29774919Listed by: RE/MAX ELITE BROWNSVILLE $355,000Active4 beds 3 baths2,009 sq. ft.
6878 Woodstock Dr., BROWNSVILLE, TX 78526
MLS# 29774922Listed by: RE/MAX ELITE BROWNSVILLE $220,000Active4 beds 2 baths1,469 sq. ft.
3539 Calle Nortena, BROWNSVILLE, TX 78526
MLS# 29774925Listed by: REALTY ONE GROUP, MODERN EDGE $378,000Active4 beds 3 baths2,045 sq. ft.
6277 King Palm, BROWNSVILLE, TX 78521
MLS# 29774927Listed by: ACCESS REALTY RGV $249,999Active4 beds 2 baths1,375 sq. ft.
719 Foster Ln, BROWNSVILLE, TX 78521
MLS# 29774928Listed by: KELLER WILLIAMS LRGV $190,000Active2 beds 2 baths2,148 sq. ft.
204 Emerald Ln, BROWNSVILLE, TX 78520
MLS# 29774917Listed by: ZAVALETA REALTY, LLC $89,000Pending0.17 Acres
1493 Las Lomas Dr., BROWNSVILLE, TX 78526
MLS# 29774906Listed by: ACCLAIM PROPERTIES $94,135Active0.23 Acres
2617 Del Roble Ln., BROWNSVILLE, TX 78526
MLS# 29753027Listed by: RCR REAL CONNECT REALTY $101,070Active0.24 Acres
2621 Del Roble Ln., BROWNSVILLE, TX 78526
MLS# 29753031Listed by: RCR REAL CONNECT REALTY $142,319Active0.34 Acres
2625 Del Roble Ln., BROWNSVILLE, TX 78526
MLS# 29753037Listed by: RCR REAL CONNECT REALTY $120,650Active0.29 Acres
2629 Del Roble Ln., BROWNSVILLE, TX 78526
MLS# 29753118Listed by: RCR REAL CONNECT REALTY $109,383Active0.26 Acres
2633 Del Roble Ln., BROWNSVILLE, TX 78526
MLS# 29753119Listed by: RCR REAL CONNECT REALTY $93,100Active0.23 Acres
2637 Del Roble Ln., BROWNSVILLE, TX 78526
MLS# 29753120Listed by: RCR REAL CONNECT REALTY- $93,100Active0.23 Acres
2665 Del Roble Ln., BROWNSVILLE, TX 78526
MLS# 29753133Listed by: RCR REAL CONNECT REALTY  $93,100Active0.23 Acres
2669 Del Roble Ln., BROWNSVILLE, TX 78526
MLS# 29753134Listed by: RCR REAL CONNECT REALTY- $86,450Active0.21 Acres
2697 Del Roble Ln., BROWNSVILLE, TX 78526
MLS# 29753146Listed by: RCR REAL CONNECT REALTY  $86,450Active0.21 Acres
2701 Del Roble Ln., BROWNSVILLE, TX 78526
MLS# 29753147Listed by: RCR REAL CONNECT REALTY- $86,450Active0.21 Acres
2705 Del Roble Ln., BROWNSVILLE, TX 78526
MLS# 29753148Listed by: RCR REAL CONNECT REALTY - $86,450Active0.21 Acres
2709 Del Roble Ln., BROWNSVILLE, TX 78526
MLS# 29753149Listed by: RCR REAL CONNECT REALTY  $86,184Pending0.21 Acres
2713 Del Roble Ln., BROWNSVILLE, TX 78526
MLS# 29753151Listed by: RCR REAL CONNECT REALTY $85,965Pending0.21 Acres
2717 Del Roble Ln., BROWNSVILLE, TX 78526
MLS# 29753152Listed by: RCR REAL CONNECT REALTY $114,912Pending0.28 Acres
2721 Del Roble Ln., BROWNSVILLE, TX 78526
MLS# 29753153Listed by: RCR REAL CONNECT REALTY $94,373Active0.23 Acres
2725 Del Roble Ln., BROWNSVILLE, TX 78526
MLS# 29753154Listed by: RCR REAL CONNECT REALTY $83,362Active0.2 Acres
2729 Del Roble Ln., BROWNSVILLE, TX 78526
MLS# 29753155Listed by: RCR REAL CONNECT REALTY $89,908Active0.25 Acres
2600 Del Roble Ln., BROWNSVILLE, TX 78526
MLS# 29753159Listed by: RCR REAL CONNECT REALTY $116,603Active0.28 Acres
2604 Del Roble Ln., BROWNSVILLE, TX 78526
MLS# 29753160Listed by: RCR REAL CONNECT REALTY $99,056Active0.24 Acres
2636 Del Roble Ln., BROWNSVILLE, TX 78526
MLS# 29753162Listed by: RCR REAL CONNECT REALTY- $86,450Active0.21 Acres
2652 Del Roble Ln., BROWNSVILLE, TX 78526
MLS# 29753200Listed by: RCR REAL CONNECT REALTY  $140,058Active0.34 Acres
2656 Del Roble Ln., BROWNSVILLE, TX 78526
MLS# 29753204Listed by: RCR REAL CONNECT REALTY $118,256Active0.29 Acres
2660 Del Roble Ln., BROWNSVILLE, TX 78526
MLS# 29753205Listed by: RCR REAL CONNECT REALTY $125,210Active0.3 Acres
2664 Del Roble Ln., BROWNSVILLE, TX 78526
MLS# 29753206Listed by: RCR REAL CONNECT REALTY $114,788Active0.28 Acres
2668 Del Roble Ln., BROWNSVILLE, TX 78526
MLS# 29753207Listed by: RCR REAL CONNECT REALTY $99,636Active0.24 Acres
2672 Del Roble Ln., BROWNSVILLE, TX 78526
MLS# 29753208Listed by: RCR REAL CONNECT REALTY $88,749Pending0.21 Acres
2700 Del Roble Ln., BROWNSVILLE, TX 78526
MLS# 29753223Listed by: RCR REAL CONNECT REALTY $91,038Pending0.22 Acres
2704 Del Roble Ln., BROWNSVILLE, TX 78526
MLS# 29753242Listed by: RCR REAL CONNECT REALTY $93,917Active0.23 Acres
2708 Del Roble Ln., BROWNSVILLE, TX 78526
MLS# 29753245Listed by: RCR REAL CONNECT REALTY $122,654Pending0.3 Acres
2712 Del Roble Ln., BROWNSVILLE, TX 78526
MLS# 29753246Listed by: RCR REAL CONNECT REALTY $93,252Pending0.23 Acres
2695 Arely Ln, BROWNSVILLE, TX 78526
MLS# 29754539Listed by: RCR REAL CONNECT REALTY $80,588Active0.19 Acres
2603 Arely Ln, BROWNSVILLE, TX 78526
MLS# 29753395Listed by: RCR REAL CONNECT REALTY $79,296Active0.19 Acres
2623 Arely Ln, BROWNSVILLE, TX 78526
MLS# 29753396Listed by: RCR REAL CONNECT REALTY $144,647Active0.35 Acres
2655 Arely Ln, BROWNSVILLE, TX 78526
MLS# 29753456Listed by: RCR REAL CONNECT REALTY $122,844Active0.3 Acres
2659 Arely Ln, BROWNSVILLE, TX 78526
MLS# 29753457Listed by: RCR REAL CONNECT REALTY $91,200Active0.22 Acres
2663 Arely Ln, BROWNSVILLE, TX 78526
MLS# 29753458Listed by: RCR REAL CONNECT REALTY $91,323Active0.22 Acres
2667 Arely Ln, BROWNSVILLE, TX 78526
MLS# 29753459Listed by: RCR REAL CONNECT REALTY $95,902Active0.23 Acres
2671 Arely Ln, BROWNSVILLE, TX 78526
MLS# 29753460Listed by: RCR REAL CONNECT REALTY $98,800Active0.24 Acres
2675 Arely Ln, BROWNSVILLE, TX 78526
MLS# 29754531Listed by: RCR REAL CONNECT REALTY $100,301Active0.24 Acres
2679 Arely Ln, BROWNSVILLE, TX 78526
MLS# 29754532Listed by: RCR REAL CONNECT REALTY $96,472Active0.23 Acres
2619 Arely Ln, BROWNSVILLE, TX 78526
MLS# 29754537Listed by: RCR REAL CONNECT REALTY $90,069Pending0.22 Acres
2699 Arely Ln, BROWNSVILLE, TX 78526
MLS# 29754540Listed by: RCR REAL CONNECT REALTY $265,000Active3 beds 3 baths1,425 sq. ft.
5255 Palma Tejana Ave., BROWNSVILLE, TX 78521
MLS# 29774901Listed by: GRT REALTY $265,000Pending3 beds 2 baths1,545 sq. ft.
2741 N Neel Drive, Brownsville, TX 78526
MLS# 494822Listed by: Keller Williams Realty Rgv $290,000Active2 beds 2 baths45,341 sq. ft.
5285 Boca Chica Blvd., BROWNSVILLE, TX 78521
MLS# 29774898Listed by: REALTY SOLUTIONS $210,000Active3 beds 2 baths1,256 sq. ft.
575 Platano Ln., BROWNSVILLE, TX 78521
MLS# 29774899Listed by: RCR REAL CONNECT REALTY $175,000Pending3 beds 2 baths1,380 sq. ft.
7525 Maryland Avenue, Brownsville, TX 78521
MLS# 75747009Listed by: LPT REALTY, LLC $329,000Active3 beds 3 baths2,090 sq. ft.
3330 Calle Bolivia, BROWNSVILLE, TX 78521
MLS# 29774892Listed by: ACCESS REALTY RGV $259,000Active3 beds 2 baths1,453 sq. ft.
43842 Red Valley Ave, BROWNSVILLE, TX 78521
MLS# 29774891Listed by: ACCESS REALTY RGV $274,999Active3 beds 3 baths1,710 sq. ft.
2412 Grove Ln, BROWNSVILLE, TX 78526
MLS# 29774883Listed by: KELLER WILLIAMS LRGV $498,000Active6 Acres
10667 Alabama Rd., BROWNSVILLE, TX 78521
MLS# 29774873Listed by: RCR REAL CONNECT REALTY $209,999Active3 beds 2 baths1,100 sq. ft.
6504 Montebello Cir., BROWNSVILLE, TX 78521
MLS# 29774865Listed by: REALTY ONE GROUP, MODERN EDGE $325,000Active-- beds -- baths2,025 sq. ft.
7137 Calles Avenue, BROWNSVILLE, TX 78575
MLS# 29774861Listed by: ARIA GROUP REAL ESTATE $105,000Active0.25 Acres
0000 Lulu St, BROWNSVILLE, TX 78526
MLS# 29774849Listed by: RESACA REALTY $210,000Pending3 beds 2 baths1,195 sq. ft.
1264 Titusville, BROWNSVILLE, TX 78521
MLS# 29774844Listed by: COLDWELL BANKER LA MANSION REAL ESTATE BROWNSVILLE $399,900Active3.7 Acres
0000 Coyote St., BROWNSVILLE, TX 78520
MLS# 29774832Listed by: RIO REALTY $264,000Active3 beds 2 baths1,700 sq. ft.
2723 N Vermillion Street, Brownsville, TX 78526
MLS# 470987Listed by: Pinnacle Realty Advisors $753,371Active4 beds 3 baths3,259 sq. ft.
1716 Autumn Sage Drive, Argyle, TX 76226
MLS# 21205427Listed by: HOMESUSA.COM $671,614Active4 beds 3 baths2,505 sq. ft.
1828 Autumn Sage Drive, Argyle, TX 76226
MLS# 21205228Listed by: HOMESUSA.COM $110,000Active3 beds 2 baths896 sq. ft.
673 Santa Fe Street, Brownsville, TX 78521
MLS# 497976Listed by: Real Broker Llc $960,000Active6.06 Acres
00 Boca Chica Blvd., BROWNSVILLE, TX 78521
MLS# 29774807Listed by: D1 TEXAS REALTY $310,000Active4 beds 3 baths1,837 sq. ft.
3720 Paseo Cafetos St, BROWNSVILLE, TX 78526
MLS# 29774801Listed by: RCR REAL CONNECT REALTY $439,000Active4 beds 3 baths2,314 sq. ft.
5929 Willow Palm Court, BROWNSVILLE, TX 78526
MLS# 29774802Listed by: COLDWELL BANKER LA MANSION REAL ESTATE BROWNSVILLE $375,000Active4 beds 4 baths1,999 sq. ft.
7436 Burr Oak Loop, BROWNSVILLE, TX 78526
MLS# 29774782Listed by: BALBOA REALTY $267,000Active0.33 Acres
LOT 11 Wilderness Dr., BROWNSVILLE, TX 78526
MLS# 29774783Listed by: RGV REALTY, LLC $258,000Active0.31 Acres
LOT 12 Wilderness Dr., BROWNSVILLE, TX 78526
MLS# 29774784Listed by: RGV REALTY, LLC $217,000Active3 beds 2 baths1,179 sq. ft.
6205 Panther Dr., BROWNSVILLE, TX 78521
MLS# 29774780Listed by: RE/MAX ELITE BROWNSVILLE $739,104Active4 beds 3 baths3,249 sq. ft.
1824 Autumn Sage Drive, Argyle, TX 76226
MLS# 21203507Listed by: HOMESUSA.COM $289,500Active3 beds 3 baths1,578 sq. ft.
19 Saint Andrews, BROWNSVILLE, TX 78520
MLS# 29774777Listed by: EXCEL REALTY $400,000Active4 beds 3 baths2,095 sq. ft.
2607 Arely Ln, BROWNSVILLE, TX 78526
MLS# 29774778Listed by: RE/MAX ELITE BROWNSVILLE $319,000Active3 beds 2 baths2,146 sq. ft.
6945 Wild Olive, Brownsville, TX 78526
MLS# 1947427Listed by: LUGO REALTY, LLC $369,999Active5 beds 3 baths2,983 sq. ft.
1675 Chipinque Dr., BROWNSVILLE, TX 78526
MLS# 29774744Listed by: GRT REALTY $120,000Pending0.24 Acres
LOT 40 Wilderness Dr., BROWNSVILLE, TX 78526
MLS# 29774750Listed by: RGV REALTY, LLC $240,000Active0.32 Acres
0 Emerald Valley Boulevard, Brownsville, TX 78526
MLS# 497744Listed by: Ursa Real Estate $155,000Active2 beds 1 baths984 sq. ft.
1643 Morton St. #795-796, BROWNSVILLE, TX 78521
MLS# 29774737Listed by: REALTY ONE GROUP, MODERN EDGE $285,000Active4 beds 3 baths3,271 sq. ft.
441 Champions Dr., BROWNSVILLE, TX 78520
MLS# 29774731Listed by: BADIOLA REAL ESTATE LLC $235,000Active3 beds 3 baths1,470 sq. ft.
142 Country Club Rd. #5, BROWNSVILLE, TX 78520
MLS# 29774732Listed by: MKZ REALTY $393,000Pending4 beds 3 baths2,121 sq. ft.
5913 Willow Palm Court, BROWNSVILLE, TX 78526
MLS# 29774722Listed by: RGV REALTY, LLC $320,000Active3 beds 3 baths1,662 sq. ft.
1821 Joaquin St, BROWNSVILLE, TX 78526
MLS# 29774719Listed by: ENDURE REAL ESTATE, LLC $247,000Pending3 beds 2 baths1,708 sq. ft.
4962 Las Cruces Ct., BROWNSVILLE, TX 78526
MLS# 29774716Listed by: ZAVALETA REALTY, LLC $210,000Pending4 beds 2 baths1,368 sq. ft.
9177 Alamosa Dr, BROWNSVILLE, TX 78520
MLS# 29774708Listed by: EXCEL REALTY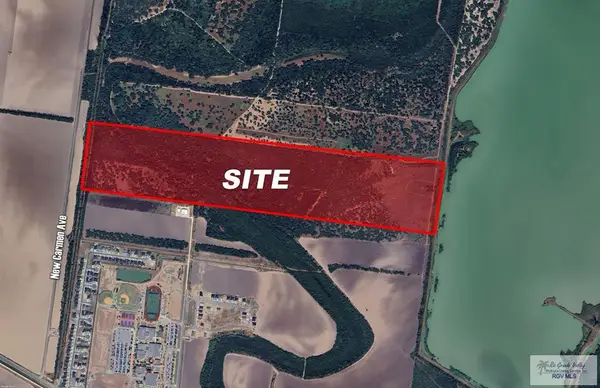 $1,275,000Active75 Acres
TBD New Carmen, BROWNSVILLE, TX 78520
MLS# 29774698Listed by: COLDWELL BANKER LA MANSION REAL ESTATE BROWNSVILLE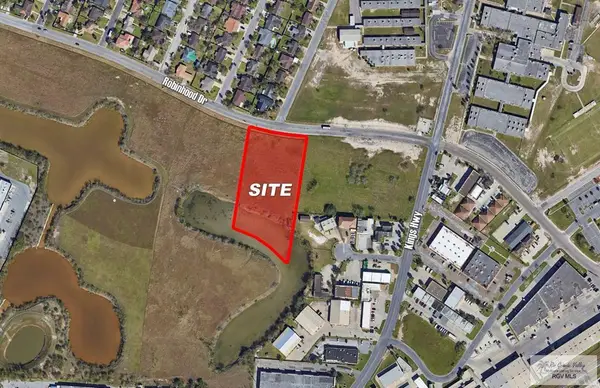 $1,905,750Active2.5 Acres
1000 Robinhood Dr, BROWNSVILLE, TX 78521
MLS# 29774695Listed by: COLDWELL BANKER LA MANSION REAL ESTATE BROWNSVILLE $245,000Active3 beds 2 baths1,462 sq. ft.
2344 W Dorcas Circle, BROWNSVILLE, TX 78521
MLS# 29773683Listed by: ENDURE REAL ESTATE, LLC $125,000Active0.33 Acres
518 & 528 Truman Dr., BROWNSVILLE, TX 78520
MLS# 29774683Listed by: EXCEL REALTY $446,900Pending4 beds 4 baths2,297 sq. ft.
6215 Windmill Palm Court, BROWNSVILLE, TX 78526
MLS# 29772515Listed by: WILLIAM P SWANTNER $155,000Active3 beds 2 baths1,088 sq. ft.
1175 Milam Ave., BROWNSVILLE, TX 78521
MLS# 29772680Listed by: GRT REALTY $334,000Active4 beds 4 baths2,063 sq. ft.
4121 Rhine River St, BROWNSVILLE, TX 78520
MLS# 29772678Listed by: RE/MAX ELITE BROWNSVILLE $259,000Active3 beds 2 baths1,353 sq. ft.
14 Sonora Ct., BROWNSVILLE, TX 78526
MLS# 29772673Listed by: RCR REAL CONNECT REALTY $272,000Pending3 beds 2 baths1,554 sq. ft.
43898 Red Valley Ave, BROWNSVILLE, TX 78521
MLS# 29772666Listed by: ACCESS REALTY RGV- New
 $1,400,000Active6 beds 6 baths5,004 sq. ft.
3111 Emerald Valley Boulevard, Brownsville, TX 78526
MLS# 500489Listed by: Ursa Real Estate  $239,000Active-- beds -- baths1,599 sq. ft.
10 Country Club Rd. #A and B, BROWNSVILLE, TX 78520
MLS# 29772652Listed by: BADIOLA REAL ESTATE LLC $295,000Active3 beds 3 baths1,875 sq. ft.
3882 Vivian Dr., BROWNSVILLE, TX 78521
MLS# 29772638Listed by: RE/MAX SUN VALLEY REALTORS $319,900Active4 beds 4 baths2,235 sq. ft.
1442 Mckinley St, BROWNSVILLE, TX 78521
MLS# 29772623Listed by: THE MBTEAM $430,000Pending4 beds 3 baths2,765 sq. ft.
1255 Sandy Hill Dr., BROWNSVILLE, TX 78520
MLS# 29772604Listed by: COLDWELL BANKER LA MANSION REAL ESTATE BROWNSVILLE $210,000Active2 beds 3 baths1,300 sq. ft.
3000 Old Alice Rd. #601, BROWNSVILLE, TX 78521
MLS# 29772601Listed by: ZAVALETA REALTY, LLC $350,000Active1.83 Acres
0 Dreamway Dr. #3, BROWNSVILLE, TX 78526
MLS# 29772603Listed by: KELLER WILLIAMS LRGV $190,000Active2 beds 2 baths1,072 sq. ft.
2018 E 19th St., BROWNSVILLE, TX 78006
MLS# 29772599Listed by: PATRICK MCNULTY, BROKER $99,000Active2 beds 1 baths600 sq. ft.
1437 Mckinley St #120, BROWNSVILLE, TX 78520
MLS# 29772596Listed by: BOB TORRES PROPERTIES $400,000Pending4 beds 3 baths1,811 sq. ft.
167 Shoreline Dr., BROWNSVILLE, TX 78521
MLS# 29772576Listed by: MISSION REAL ESTATE GROUP $338,000Active4 beds 3 baths2,675 sq. ft.
3384 Burgundy Dr., BROWNSVILLE, TX 78526
MLS# 29772543Listed by: RE/MAX SUN VALLEY REALTORS $310,000Active-- beds -- baths2,340 sq. ft.
1803 Turqueza Dr., BROWNSVILLE, TX 78521
MLS# 29772564Listed by: COLDWELL BANKER LA MANSION REAL ESTATE BROWNSVILLE $32,000Pending6.5 Acres
122313 Old Port Isabel Road, Brownsville, TX 78578
MLS# 487941Listed by: Glass Realty $145,000Active4 beds 2 baths1,208 sq. ft.
6931 Nansa Dr., BROWNSVILLE, TX 78521
MLS# 29772538Listed by: COLDWELL BANKER LA MANSION REAL ESTATE BROWNSVILLE $340,000Active3 beds 4 baths2,573 sq. ft.
5016 Indian Shore Dr., BROWNSVILLE, TX 78526
MLS# 29772532Listed by: RE/MAX SUN VALLEY REALTORS $87,000Active0.2 Acres
8228 Fatima Ct, BROWNSVILLE, TX 78526
MLS# 29772529Listed by: RCR REAL CONNECT REALTY $295,900Active3 beds 2 baths1,876 sq. ft.
4802 Lakeway Dr., BROWNSVILLE, TX 78520
MLS# 29772523Listed by: GRT REALTY $109,000Active0.26 Acres
8217 Fatima Ct, BROWNSVILLE, TX 78526
MLS# 29772524Listed by: RCR REAL CONNECT REALTY $269,000Active3 beds 2 baths1,637 sq. ft.
1775 Guadalajara Ave., BROWNSVILLE, TX 78526
MLS# 29772525Listed by: RE/MAX SUN VALLEY REALTORS $108,000Active0.26 Acres
8232 Fatima Ct, BROWNSVILLE, TX 78526
MLS# 29772527Listed by: RCR REAL CONNECT REALTY $254,900Active2 beds 2 baths1,500 sq. ft.
6 Country Club Rd., BROWNSVILLE, TX 78520
MLS# 29772528Listed by: DURAN REALTY, LLC $100,000Active0.24 Acres
3345 Nazaret Ave, BROWNSVILLE, TX 78526
MLS# 29772520Listed by: RCR REAL CONNECT REALTY $275,000Pending3 beds 2 baths1,713 sq. ft.
776 Pine Falls Dr., BROWNSVILLE, TX 78526
MLS# 29772521Listed by: ZAVALETA REALTY, LLC $325,000Active4 beds 3 baths1,837 sq. ft.
3744 Paseo Cafetos St, BROWNSVILLE, TX 78526
MLS# 29772517Listed by: NEXTHOME RGV REALTY $92,000Active0.21 Acres
3335 Nazaret Ave, BROWNSVILLE, TX 78526
MLS# 29772519Listed by: RCR REAL CONNECT REALTY $375,000Active3 beds 3 baths2,714 sq. ft.
1908 Palm Blvd, Brownsville, TX 78520
MLS# 104950Listed by: THE INTERNATIONAL REAL ESTATE COMPANY $94,000Active0.19 Acres
00 Polanco Dr, BROWNSVILLE, TX 78526
MLS# 29772514Listed by: KELLER WILLIAMS LRGV $189,999Active3 beds 2 baths850 sq. ft.
58 Angel St., BROWNSVILLE, TX 78521
MLS# 29772508Listed by: KELLER WILLIAMS LRGV $110,000Pending0.12 Acres
4313-17 Casamigos St, HARLINGEN, TX 78522
MLS# 29772509Listed by: LIZ REALTY LLC $259,900Active3 beds 2 baths1,546 sq. ft.
8512 Blue Sage Ln, BROWNSVILLE, TX 78526
MLS# 29772483Listed by: COLDWELL BANKER LA MANSION REAL ESTATE BROWNSVILLE $105,000Active2 beds 2 baths1,024 sq. ft.
16-B Palmetto Ct., BROWNSVILLE, TX 78521
MLS# 29772482Listed by: KELLER WILLIAMS LRGV $59,500Active0.09 Acres
188 Mississippi River Blvd., BROWNSVILLE, TX 78520
MLS# 29772477Listed by: EXP REALTY, LLC $209,000Active4 beds 3 baths2,268 sq. ft.
203 Sweet Rose St., BROWNSVILLE, TX 78521
MLS# 29772469Listed by: REALTY ONE GROUP, MODERN EDGE $163,999Active3 beds 2 baths1,122 sq. ft.
55 W Jackson St., BROWNSVILLE, TX 78520
MLS# 29772466Listed by: RCR REAL CONNECT REALTY $224,900Pending3 beds 2 baths1,266 sq. ft.
4216 Sabine Ave, BROWNSVILLE, TX 78520
MLS# 29772462Listed by: REALTY ONE GROUP, MODERN EDGE $195,000Pending3 beds 2 baths1,097 sq. ft.
2720 Capri St., BROWNSVILLE, TX 78520
MLS# 29772455Listed by: EXP REALTY, LLC $145,000Pending2 beds 2 baths1,200 sq. ft.
2901 Central Blvd. #407, BROWNSVILLE, TX 78520
MLS# 29772450Listed by: COLDWELL BANKER LA MANSION REAL ESTATE BROWNSVILLE $105,000Active2 beds 2 baths1,087 sq. ft.
1900 University Blvd. #10F, BROWNSVILLE, TX 78520
MLS# 29772445Listed by: MKZ REALTY $249,000Active4 beds 2 baths1,304 sq. ft.
2706 Normandy St., BROWNSVILLE, TX 78520
MLS# 29772436Listed by: SUMMIT PROPERTIES $449,000Pending4 beds 3 baths2,440 sq. ft.
5936 Willow Palm Court, BROWNSVILLE, TX 78526
MLS# 29772426Listed by: REALTY ONE GROUP, MODERN EDGE $146,000Active3 beds 1 baths1,293 sq. ft.
20 Ofelia Cir, BROWNSVILLE, TX 78521
MLS# 29772429Listed by: ANDY CORTEZ REAL ESTATE $245,000Pending4 beds 2 baths1,434 sq. ft.
1068 Oro Blanco Ave, BROWNSVILLE, TX 78521
MLS# 29772423Listed by: RCR REAL CONNECT REALTY $199,000Active2 beds 3 baths1,589 sq. ft.
3744 Boca Chica Blvd. #100 B, BROWNSVILLE, TX 78521
MLS# 29772420Listed by: ENDURE REAL ESTATE, LLC $79,800Pending3 beds 1 baths1,612 sq. ft.
3334 East Avenue, Brownsville, TX 78521
MLS# 496554Listed by: Capstone Realty Pllc $57,000Active0.15 Acres
000 Lester Dr, BROWNSVILLE, TX 78521
MLS# 29772404Listed by: CORNERSTONE TX REALTY $794,691Active5 beds 5 baths3,686 sq. ft.
1820 Autumn Sage Drive, Argyle, TX 76226
MLS# 21191132Listed by: HOMESUSA.COM $274,500Active3 beds 2 baths1,590 sq. ft.
699 Foster Ln, BROWNSVILLE, TX 78521
MLS# 29772396Listed by: COLDWELL BANKER LA MANSION REAL ESTATE BROWNSVILLE $748,968Pending4 beds 4 baths3,287 sq. ft.
1816 Autumn Sage Drive, Argyle, TX 76226
MLS# 21190919Listed by: HOMESUSA.COM $440,000Active-- beds -- baths2,570 sq. ft.
3227 Villa Rosa Dr, BROWNSVILLE, TX 78526
MLS# 29772373Listed by: RE/MAX SUN VALLEY REALTORS $245,000Active3 beds 2 baths1,400 sq. ft.
6705 Georgia Pine, BROWNSVILLE, TX 78526
MLS# 29772372Listed by: MKZ REALTY $82,900Pending0.42 Acres
8710 Us Highway 281, BROWNSVILLE, TX 78520
MLS# 29772369Listed by: KELLER WILLIAMS LRGV $175,000Active3 beds 2 baths1,254 sq. ft.
48 S Bernal Drive, Brownsville, TX 78521
MLS# 492877Listed by: Tnt Real Estate $255,000Active3 beds 2 baths1,500 sq. ft.
1010 Silver Oak Dr., BROWNSVILLE, TX 78520
MLS# 29772357Listed by: RCR REAL CONNECT REALTY $350,000Active4 beds 3 baths1,976 sq. ft.
74 Arien Ct., BROWNSVILLE, TX 78521
MLS# 29772353Listed by: SANETI REALTY GROUP $310,000Pending3 beds 3 baths1,810 sq. ft.
3712 Paseo Cafetos St, BROWNSVILLE, TX 78526
MLS# 29772343Listed by: NEXTHOME RGV REALTY $210,000Active3 beds 2 baths1,440 sq. ft.
355 Avenida Estrella, BROWNSVILLE, TX 78526
MLS# 29772341Listed by: ELEMENT REALTY, LLC $1,650,000Active-- beds -- baths10,218 sq. ft.
1000 Wildrose Ln, BROWNSVILLE, TX 78520
MLS# 29772335Listed by: RCR REAL CONNECT REALTY $70,500Active3 beds 1 baths936 sq. ft.
1194 Fannin Avenue, Brownsville, TX 78521
MLS# 496585Listed by: Legacy Realty Group Rgv $290,000Active5 beds 2 baths2,368 sq. ft.
805 Lakeside Blvd., BROWNSVILLE, TX 78520
MLS# 29772325Listed by: RCR REAL CONNECT REALTY $235,000Active4 beds 2 baths1,406 sq. ft.
3260 Turquia St, BROWNSVILLE, TX 78520
MLS# 29772326Listed by: RE/MAX ELITE $299,900Pending4 beds 3 baths1,951 sq. ft.
9600 Lake Concordia Court, Los Fresnos, TX 78566
MLS# 496523Listed by: The Mbteam $270,000Active3 beds 3 baths1,501 sq. ft.
7093 Lake Tahoe, BROWNSVILLE, TX 78520
MLS# 29772322Listed by: RE/MAX SUN VALLEY REALTORS $290,000Active3 beds 2 baths1,551 sq. ft.
4955 Rioja Ln., BROWNSVILLE, TX 78521
MLS# 29772323Listed by: RCR REAL CONNECT REALTY $350,000Active4 beds 4 baths2,363 sq. ft.
3449 Heritage Cir, BROWNSVILLE, TX 78520
MLS# 29772308Listed by: ZAVALETA REALTY, LLC $464,000Pending4 beds 4 baths2,388 sq. ft.
6323 Sylverter Palm Court, BROWNSVILLE, TX 78526
MLS# 29772306Listed by: RGV REALTY, LLC $95,000Active2 beds 2 baths1,350 sq. ft.
1645 E Ringgold Street, Brownsville, TX 78520
MLS# 95860792Listed by: AGENT LIZ REAL ESTATE, LLC $279,000Active-- beds -- baths2,079 sq. ft.
553 Villanueva Ave., BROWNSVILLE, TX 78520
MLS# 29772299Listed by: RCR REAL CONNECT REALTY $110,000Active0.24 Acres
0 Bahama St., OLMITO, TX 78526
MLS# 29772298Listed by: RCR REAL CONNECT REALTY $2,600,000Active-- beds -- baths13,498 sq. ft.
5501 Campo Real Cir, BROWNSVILLE, TX 78575
MLS# 29772296Listed by: LEGACY REALTY GROUP RGV $45,000Active0.09 Acres
322 Mississippi River Blvd., BROWNSVILLE, TX 78520
MLS# 29772291Listed by: EXECUTIVE HOME REALTY $172,000Active4 beds 2 baths1,329 sq. ft.
526 Rey Jorge St., BROWNSVILLE, TX 78521
MLS# 29772290Listed by: RE/MAX ELITE BROWNSVILLE $135,000Active3 beds 2 baths1,200 sq. ft.
4749 Palacio Real Dr, BROWNSVILLE, TX 78521
MLS# 29772289Listed by: RESACA REALTY $155,000Pending2 beds 2 baths875 sq. ft.
8389 Raul A Cavazos, BROWNSVILLE, TX 78520
MLS# 29772283Listed by: ALTUS REAL ESTATE GROUP, LLC $228,000Pending3 beds 2 baths1,245 sq. ft.
1005 Flor Del Valle Dr., BROWNSVILLE, TX 78520
MLS# 29772284Listed by: COASTAL REALTY $289,500Active3 beds 2 baths1,626 sq. ft.
1215 Pinion Dr., BROWNSVILLE, TX 78526
MLS# 29772280Listed by: ENDURE REAL ESTATE, LLC $189,500Active4 beds 2 baths1,480 sq. ft.
7975 Date Dr., BROWNSVILLE, TX 78521
MLS# 29772276Listed by: KELLER WILLIAMS LRGV $325,000Active3 beds 3 baths1,788 sq. ft.
3072 Basque Dr., BROWNSVILLE, TX 78520
MLS# 29772263Listed by: REALTY SOLUTIONS $159,900Pending2 beds 1 baths918 sq. ft.
517 Ruby Red Ln., BROWNSVILLE, TX 78520
MLS# 29772265Listed by: ROCKING K REALTY & AUCTIONS
Local realty services provided by:CENTURY 21 Johnston Company, CENTURY 21 Judge Fite Company, CENTURY 21 Gold Coat Realtors, CENTURY 21 Middleton
Copyright 2026, Houston Realtors Information Service, Inc. All information provided is deemed reliable but is not guaranteed and should be independently verified. IDX information is provided exclusively for consumers' personal, non-commercial use, it may not be used for any purpose other than to identify prospective properties consumers may be interested in purchasing, and the data is deemed reliable but is not guaranteed accurate by the MLS.
Information provided, in part, by North Texas Real Estate Information Systems, Inc. Last Updated April 3, 2026 Listings with the NTREIS logo are listed by brokerages other than CENTURY 21 Gold Coat Realtors.
Neighborhoods near Brownsville, TX
Zip codes near Brownsville, TX
- 78520 homes for sale
- 78521 homes for sale
- 78522 homes for sale
- 78526 homes for sale
- 78535 homes for sale
- 78550 homes for sale
- 78552 homes for sale
- 78559 homes for sale
- 78566 homes for sale
- 78567 homes for sale
- 78568 homes for sale
- 78569 homes for sale
- 78570 homes for sale
- 78575 homes for sale
- 78578 homes for sale
- 78583 homes for sale
- 78586 homes for sale
- 78592 homes for sale
- 78593 homes for sale
- 78597 homes for sale
Popular searches near Brownsville, TX
- Bayview homes for sale
- Cameron Park homes for sale
- Del Mar Heights homes for sale
- Encantada-Ranchito El Calaboz homes for sale
- Green Valley Farms homes for sale
- Indian Lake homes for sale
- La Paloma homes for sale
- La Tina Ranch homes for sale
- Laguna Heights homes for sale
- Laguna Vista homes for sale
- Laureles homes for sale
- Los Fresnos homes for sale
- Los Fresnos-Laureles homes for sale
- Olmito homes for sale
- Port Isabel homes for sale
- Rancho Viejo homes for sale
- Reid Hope King homes for sale
- Rice Tracts homes for sale
- San Benito homes for sale
- South Point homes for sale
Protect your home and budget from life's surprises with an Assurant Home Warranty, backed by a partner that supports you through every step of homeownership. Explore Plans.
©2026 Century 21 Real Estate LLC. All rights reserved. CENTURY 21®, the CENTURY 21 Logo and C21® are service marks owned by Century 21 Real Estate LLC. Century 21 Real Estate LLC fully supports the principles of the Fair Housing Act and the Equal Opportunity Act. Each office is independently owned and operated. Listing information is deemed reliable but not guaranteed accurate.