- Bergland homes for sale
- Bergland Township homes for sale
- Carp Lake homes for sale
- Covington homes for sale
- Greenland Township homes for sale
- Iron River Township homes for sale
- Laird homes for sale
- Land O' Lakes homes for sale
- Land O'Lakes homes for sale
- Marenisco township homes for sale
- Nisula homes for sale
- Ontonagon homes for sale
- Ontonagon Township homes for sale
- Pelkie homes for sale
- Stambaugh Township homes for sale
- Stannard homes for sale
- Trout Creek homes for sale
- Watersmeet Township homes for sale
- Watersmeet homes for sale
- White Pine homes for sale
49912, MI - homes for sale
6 of 6 results displayed
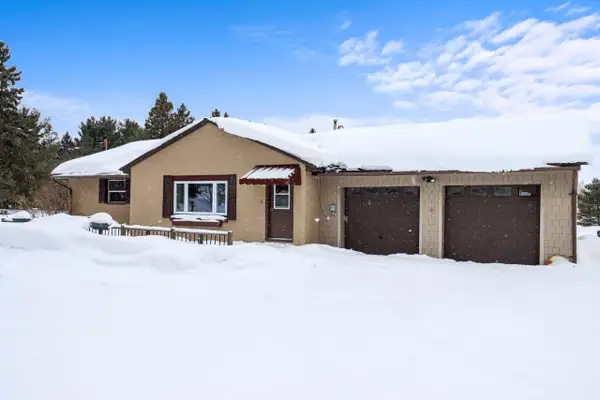
 $149,000Active3 beds 1 baths1,160 sq. ft.
14184 Hwy M28, Bruce Crossing, MI 49912
MLS# 215818Listed by: CENTURY 21 BURKETT - LOL $50,000Active26.84 Acres
OFF Hwy M28 #26.84AC, Bruce Crossing, MI 49912
MLS# 214653Listed by: CENTURY 21 BURKETT - LOL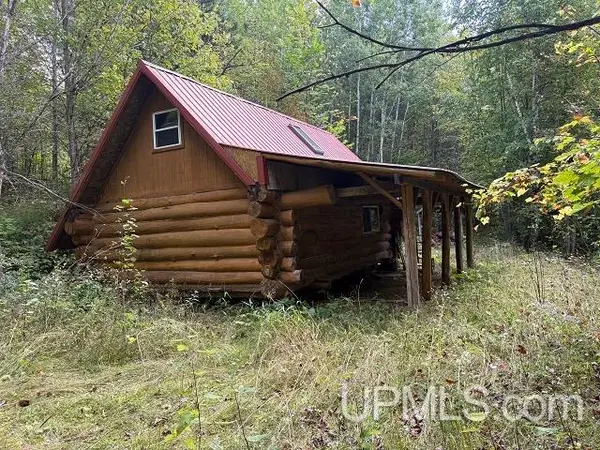 $130,000Active103 Acres
13733 Fh859, Mass City, MI 49948
MLS# 50189966Listed by: DOMITROVICH REALTY, INC $120,000Active80 Acres
Vacant Land Bruce Crossing, Ontonagon, MI 49912
MLS# 50182673Listed by: RE/MAX SUPERIORLAND $325,000Active176 Acres
14571 Holombo, Bruce Crossing, MI 49912
MLS# 50157612Listed by: NORTHERN MICHIGAN LAND BROKERS - H $89,900Active1.66 Acres
2468 Boat Landing Rd, Paulding, MI 49912
MLS# 212695Listed by: CENTURY 21 BURKETT - LOL
Local realty services provided by:CENTURY 21 Affiliated, CENTURY 21 Realty North
Popular searches near 49912
Counties near Bruce Crossing, 49912
- Ashland County homes for sale
- Baraga County homes for sale
- Bayfield County homes for sale
- Dickinson County homes for sale
- Florence County homes for sale
- Forest County homes for sale
- Gogebic County homes for sale
- Houghton County homes for sale
- Iron County homes for sale
- Iron County homes for sale
- Keweenaw County homes for sale
- Langlade County homes for sale
- Lincoln County homes for sale
- Marquette County homes for sale
- Oneida County homes for sale
- Ontonagon County homes for sale
- Price County homes for sale
- Vilas County homes for sale
Protect your home and budget from life's surprises with an Assurant Home Warranty, backed by a partner that supports you through every step of homeownership. Explore Plans.
©2026 Century 21 Real Estate LLC. All rights reserved. CENTURY 21®, the CENTURY 21 Logo and C21® are service marks owned by Century 21 Real Estate LLC. Century 21 Real Estate LLC fully supports the principles of the Fair Housing Act and the Equal Opportunity Act. Each office is independently owned and operated. Listing information is deemed reliable but not guaranteed accurate.