- Ardmore homes for sale
- Broomall homes for sale
- Bryn Mawr homes for sale
- Bryn Mawr homes for sale
- Conshohocken homes for sale
- Gladwyne homes for sale
- Haverford homes for sale
- Havertown homes for sale
- Lower Merion Township homes for sale
- Narberth homes for sale
- Penn Valley homes for sale
- Radnor Township homes for sale
- Rosemont homes for sale
- St Davids homes for sale
- Villanova homes for sale
- Villanova homes for sale
- Wayne homes for sale
- Wayne homes for sale
- West Conshohocken homes for sale
- Wynnewood homes for sale
19010, PA - homes for sale
52 of 52 results displayed
- Open Fri, 2 to 3pmNew
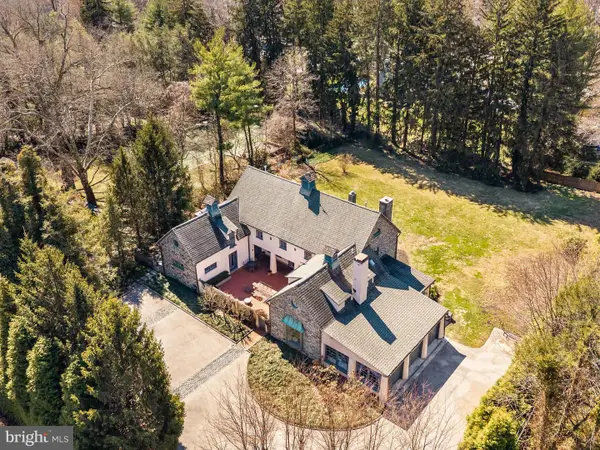 $2,995,000Active5 beds 4 baths5,960 sq. ft.
720 Morris Ave, BRYN MAWR, PA 19010
MLS# PAMC2171518Listed by: BHHS FOX & ROACH-HAVERFORD - Open Sun, 1 to 3pmNew
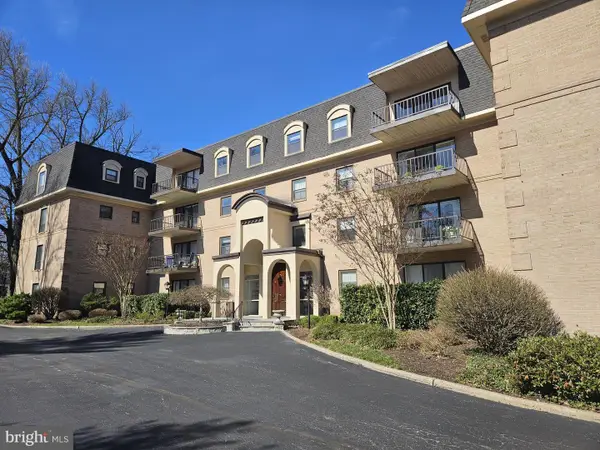
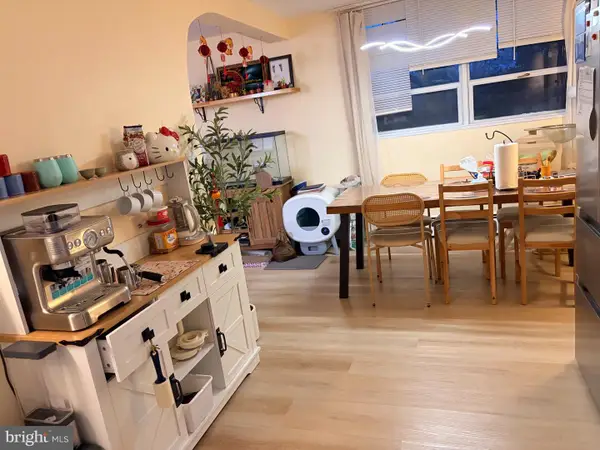 $250,000Active2 beds 1 baths914 sq. ft.
1030 E Lancaster Ave #203, BRYN MAWR, PA 19010
MLS# PADE2111076Listed by: APPRECIATION REALTY LLC - New
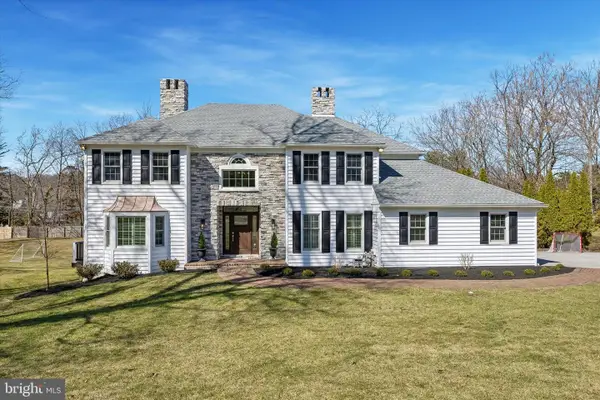
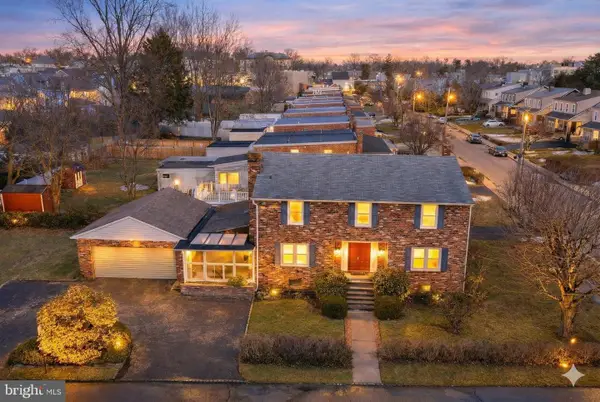 $725,000Active4 beds 4 baths3,834 sq. ft.
856 Martin Ave, BRYN MAWR, PA 19010
MLS# PADE2107006Listed by: COMPASS PENNSYLVANIA, LLC 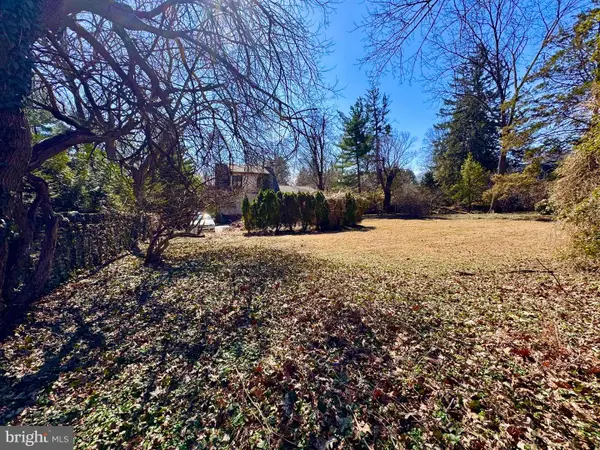 $799,000Pending2 beds 2 baths1,862 sq. ft.
114 Airdale Rd, BRYN MAWR, PA 19010
MLS# PAMC2171372Listed by: COMPASS PENNSYLVANIA, LLC- Open Sat, 2 to 4pmNew
 $3,650,000Active4 beds 7 baths6,567 sq. ft.
548 - 560 S Bryn Mawr Ave, BRYN MAWR, PA 19010
MLS# PADE2109748Listed by: KURFISS SOTHEBY'S INTERNATIONAL REALTY - New
 $169,900Active1 beds 1 baths750 sq. ft.
1030 E Lancaster Ave #128, BRYN MAWR, PA 19010
MLS# PADE2108708Listed by: SPRINGER REALTY GROUP - New
 $444,900Active2 beds 2 baths1,056 sq. ft.
601 Montgomery Ave #306, BRYN MAWR, PA 19010
MLS# PAMC2171284Listed by: LONG & FOSTER REAL ESTATE, INC. - Open Sat, 12 to 2pmNew
 $975,000Active4 beds 5 baths3,623 sq. ft.
705 Preston Ave, BRYN MAWR, PA 19010
MLS# PADE2110434Listed by: COLDWELL BANKER REALTY - Open Sat, 12 to 2pmNew
 $975,000Active4 beds 5 baths3,623 sq. ft.
703 Preston Ave, BRYN MAWR, PA 19010
MLS# PADE2110472Listed by: COLDWELL BANKER REALTY - Coming Soon
 $1,249,000Coming Soon3 beds 3 baths
245 S Bryn Mawr Ave #lot 2, BRYN MAWR, PA 19010
MLS# PADE2110784Listed by: KELLER WILLIAMS REAL ESTATE -EXTON  $280,000Active3 beds 1 baths996 sq. ft.
Address Withheld By Seller, BRYN MAWR, PA 19010
MLS# PADE2110014Listed by: KELLER WILLIAMS REALTY DEVON-WAYNE- Open Sat, 1 to 3pmNew
 $1,049,000Active4 beds 3 baths2,610 sq. ft.
305 Countryview Dr, BRYN MAWR, PA 19010
MLS# PADE2110518Listed by: KELLER WILLIAMS MAIN LINE  $4,990,000Pending5 beds 6 baths8,846 sq. ft.
1241 Ridgewood Rd, BRYN MAWR, PA 19010
MLS# PAMC2170496Listed by: KW EMPOWER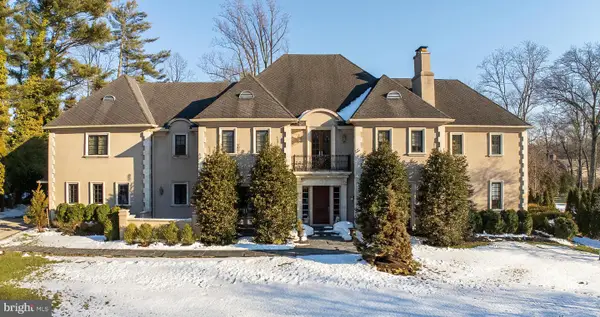 $3,650,000Active6 beds 9 baths10,856 sq. ft.
621 Great Springs Road, BRYN MAWR, PA 19010
MLS# PAMC2170352Listed by: COMPASS PENNSYLVANIA, LLC- Open Sun, 1 to 3pm
 $1,649,000Active4 beds 5 baths3,889 sq. ft.
872 Roscommon Rd, BRYN MAWR, PA 19010
MLS# PAMC2170250Listed by: BHHS FOX & ROACH-HAVERFORD  $1,900,000Pending6 beds 4 baths5,472 sq. ft.
621 Pembroke Rd, BRYN MAWR, PA 19010
MLS# PAMC2169184Listed by: COMPASS PENNSYLVANIA, LLC $1,595,000Pending4 beds 4 baths3,256 sq. ft.
505 Old Gulph Rd, BRYN MAWR, PA 19010
MLS# PAMC2168340Listed by: BHHS FOX & ROACH-HAVERFORD $1,700,000Active4 beds 6 baths4,286 sq. ft.
736 Woodleave Rd, BRYN MAWR, PA 19010
MLS# PAMC2169238Listed by: DUFFY REAL ESTATE-NARBERTH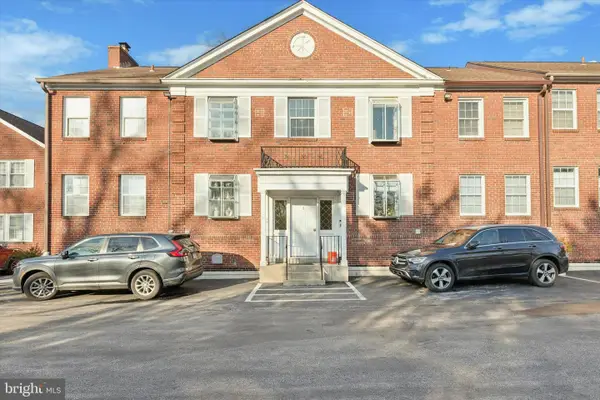 $298,000Pending2 beds 2 baths774 sq. ft.
922 W Montgomery Ave #i-2, BRYN MAWR, PA 19010
MLS# PAMC2168582Listed by: REAL OF PENNSYLVANIA $450,000Pending3 beds 2 baths1,780 sq. ft.
52 Wentworth Ln, BRYN MAWR, PA 19010
MLS# PADE2108526Listed by: BHHS FOX & ROACH MALVERN-PAOLI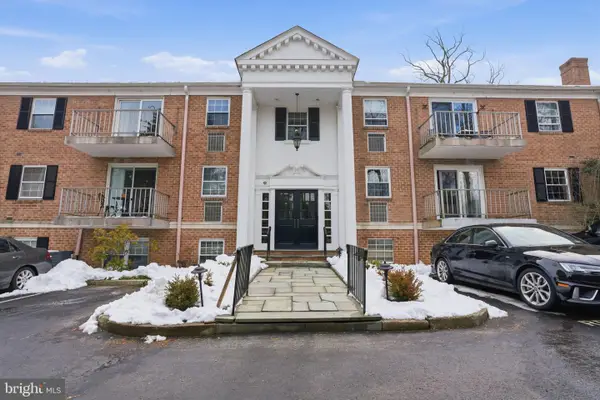 $359,999Active2 beds 2 baths980 sq. ft.
919 W. Montgomery Ave #g-1, BRYN MAWR, PA 19010
MLS# PAMC2168964Listed by: REAL OF PENNSYLVANIA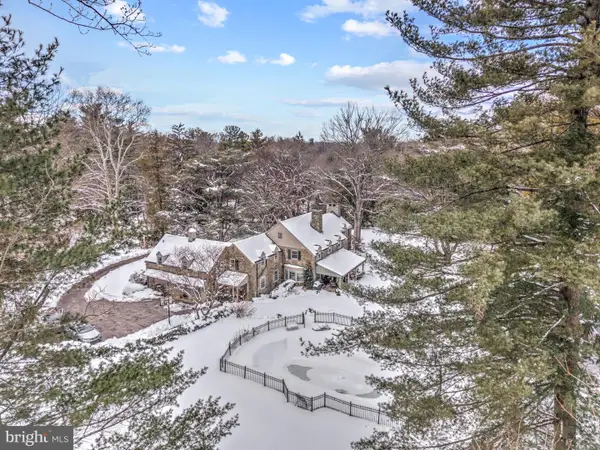 $3,500,000Pending4 beds 5 baths5,283 sq. ft.
435 Garden Ln, BRYN MAWR, PA 19010
MLS# PAMC2168518Listed by: KELLER WILLIAMS MAIN LINE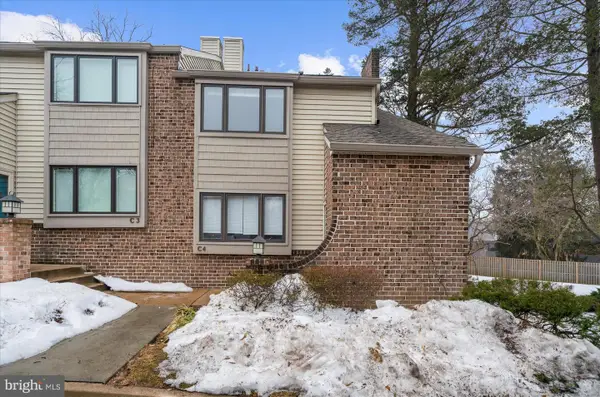 $495,000Pending3 beds 3 baths1,533 sq. ft.
200 S Roberts Rd #c-4, BRYN MAWR, PA 19010
MLS# PADE2108756Listed by: DUFFY REAL ESTATE-NARBERTH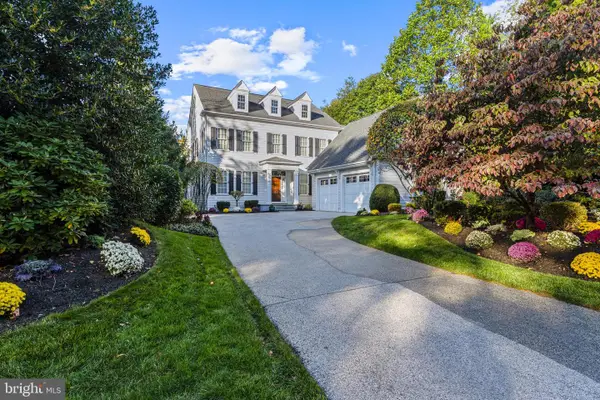 $1,795,000Pending4 beds 6 baths5,626 sq. ft.
1436 County Line Rd, BRYN MAWR, PA 19010
MLS# PADE2107896Listed by: DUFFY REAL ESTATE-NARBERTH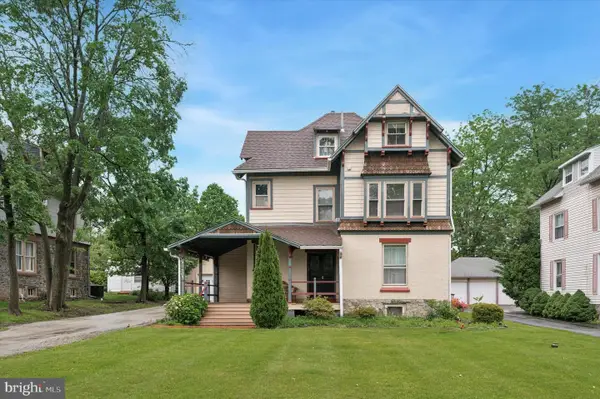 $940,000Pending5 beds -- baths2,888 sq. ft.
457 W Lancaster Ave, BRYN MAWR, PA 19010
MLS# PAMC2161788Listed by: COMPASS PENNSYLVANIA, LLC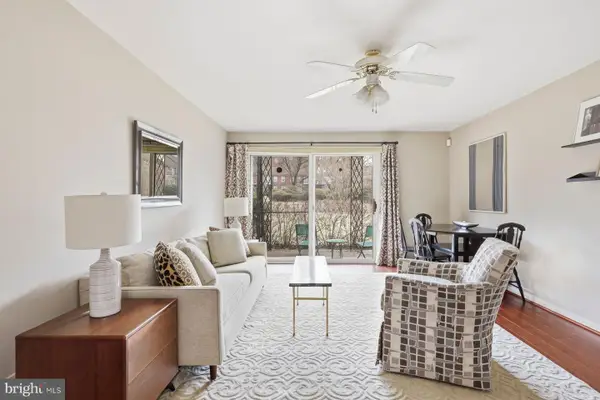 $301,000Pending2 beds 1 baths531 sq. ft.
922 Montgomery Ave #k2, BRYN MAWR, PA 19010
MLS# PAMC2166066Listed by: KURFISS SOTHEBY'S INTERNATIONAL REALTY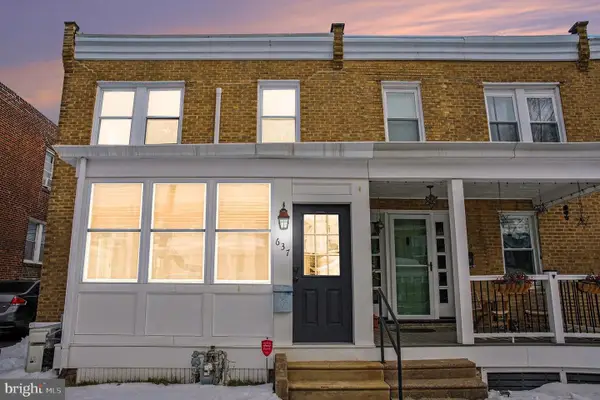 $445,000Pending3 beds 2 baths1,630 sq. ft.
637 Dayton Rd, BRYN MAWR, PA 19010
MLS# PADE2108290Listed by: RE/MAX READY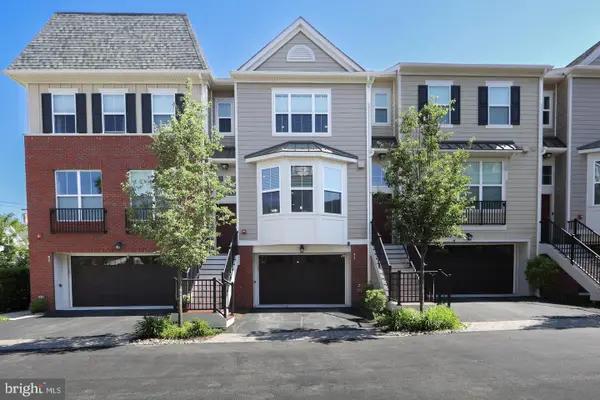 $849,999Pending3 beds 5 baths2,600 sq. ft.
53 S Merion Ave, BRYN MAWR, PA 19010
MLS# PAMC2168656Listed by: COLDWELL BANKER REALTY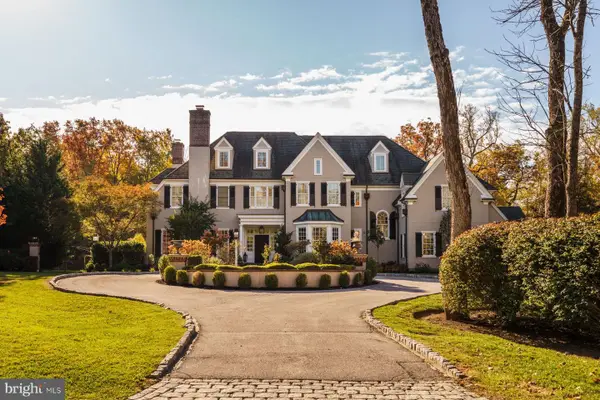 $3,350,000Pending7 beds 8 baths9,562 sq. ft.
423 Boxwood Rd, BRYN MAWR, PA 19010
MLS# PADE2102880Listed by: KURFISS SOTHEBY'S INTERNATIONAL REALTY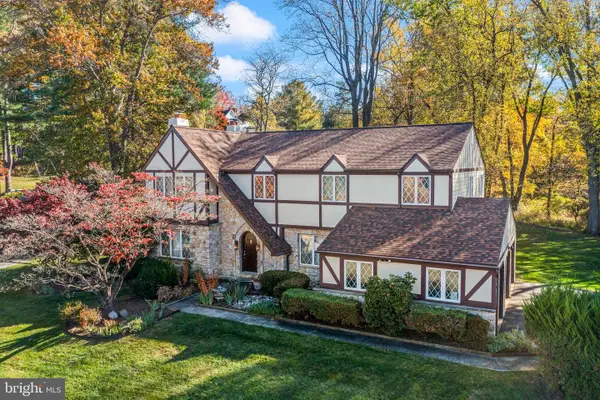 $1,150,000Pending4 beds 3 baths4,554 sq. ft.
806 Northwinds Dr, BRYN MAWR, PA 19010
MLS# PADE2108076Listed by: BHHS FOX & ROACH WAYNE-DEVON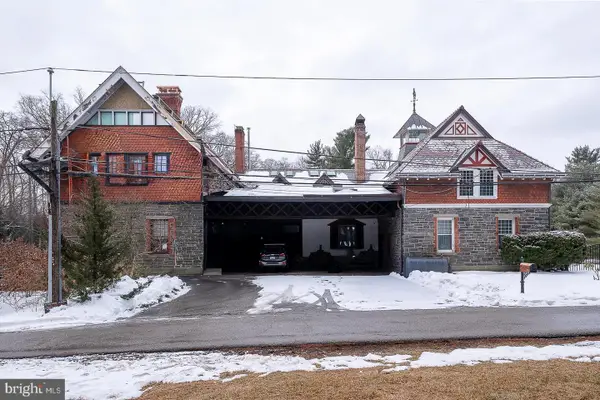 $1,675,000Active5 beds 4 baths4,630 sq. ft.
Address Withheld By Seller, BRYN MAWR, PA 19010
MLS# PADE2108250Listed by: KELLER WILLIAMS MAIN LINE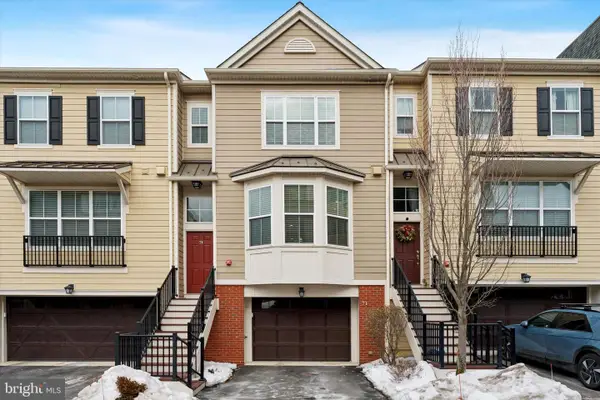 $849,900Pending3 beds 5 baths2,435 sq. ft.
71 S Merion Ave, BRYN MAWR, PA 19010
MLS# PAMC2166526Listed by: BHHS FOX & ROACH-HAVERFORD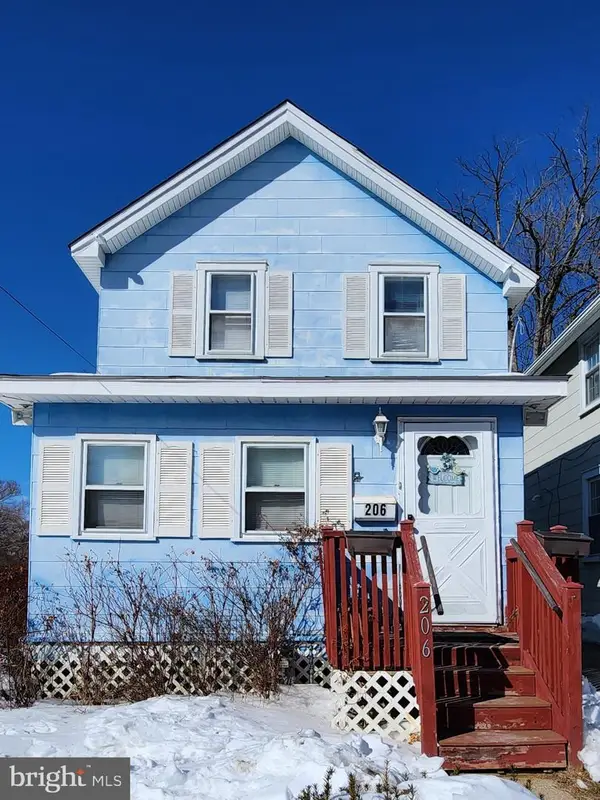 $525,000Pending3 beds 1 baths1,322 sq. ft.
206 Lowrys Ln, BRYN MAWR, PA 19010
MLS# PADE2107838Listed by: KELLER WILLIAMS REALTY DEVON-WAYNE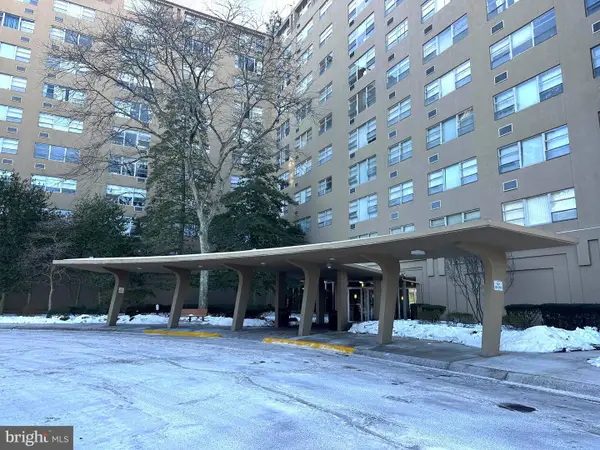 $149,900Pending1 beds 1 baths675 sq. ft.
1030 E Lancaster Ave #817, BRYN MAWR, PA 19010
MLS# PADE2107726Listed by: BHHS FOX & ROACH-ROSEMONT $398,000Pending2 beds 2 baths1,325 sq. ft.
201a-a Summit Dr ##a, BRYN MAWR, PA 19010
MLS# PADE2107680Listed by: LONG & FOSTER REAL ESTATE, INC.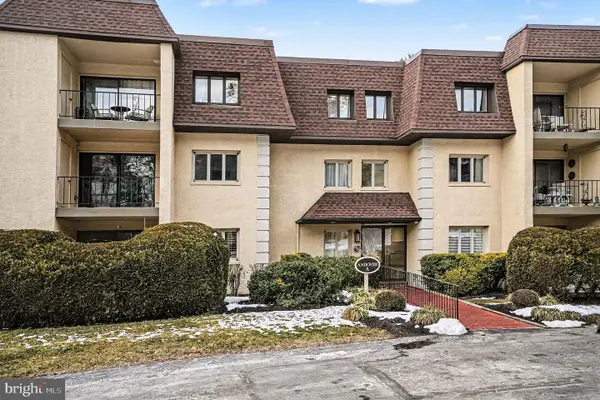 $400,000Pending2 beds 2 baths1,325 sq. ft.
202a Summit Dr #202a, BRYN MAWR, PA 19010
MLS# PADE2107064Listed by: KELLER WILLIAMS REAL ESTATE-BLUE BELL $1,400,000Active5 beds 5 baths3,834 sq. ft.
1256 Round Hill Rd, BRYN MAWR, PA 19010
MLS# PAMC2164916Listed by: COMPASS PENNSYLVANIA, LLC $205,000Active2 beds 1 baths914 sq. ft.
1030 E Lancaster Ave #1019, BRYN MAWR, PA 19010
MLS# PADE2106666Listed by: MICHAEL REALTY INC $525,000Active2 beds 3 baths1,590 sq. ft.
30 Park Ave, BRYN MAWR, PA 19010
MLS# PADE2106610Listed by: SWAYNE REAL ESTATE GROUP, LLC $3,499,990Active5 beds 7 baths5,486 sq. ft.
474 Barclay Rd, BRYN MAWR, PA 19010
MLS# PADE2106246Listed by: BHHS FOX & ROACH-WEST CHESTER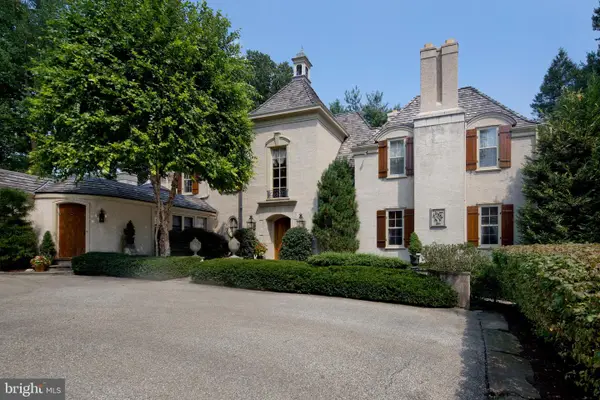 $2,195,000Pending4 beds 4 baths4,311 sq. ft.
510 Hillbrook Rd, BRYN MAWR, PA 19010
MLS# PAMC2165224Listed by: COMPASS PENNSYLVANIA, LLC $289,000Pending2 beds 1 baths800 sq. ft.
922 Montgomery Ave #c-2, BRYN MAWR, PA 19010
MLS# PAMC2164250Listed by: DUFFY REAL ESTATE-NARBERTH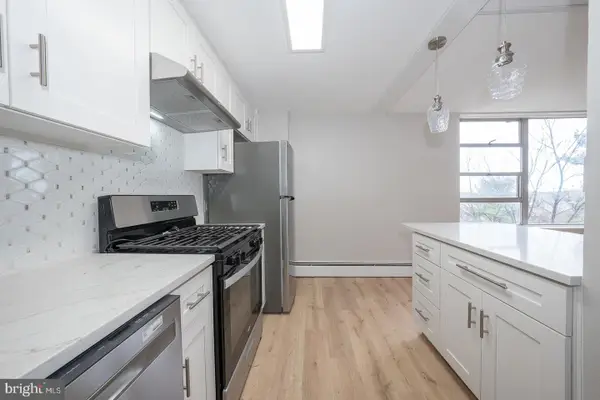 $239,500Pending2 beds 1 baths830 sq. ft.
1030 E Lancaster Ave #702, BRYN MAWR, PA 19010
MLS# PADE2105346Listed by: COMPASS PENNSYLVANIA, LLC $699,900Pending4 beds 2 baths1,767 sq. ft.
128 Clemson Rd, BRYN MAWR, PA 19010
MLS# PADE2105334Listed by: BHHS FOX & ROACH-HAVERFORD $515,000Pending6 beds 2 baths1,829 sq. ft.
50 Prospect Ave, BRYN MAWR, PA 19010
MLS# PAMC2158560Listed by: WHITNEY SIMS REALTY LLC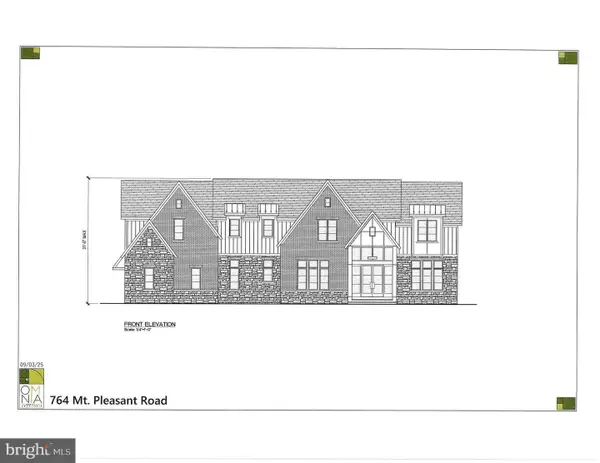 $4,250,000Pending5 beds 5 baths6,111 sq. ft.
764 Mount Pleasant Rd, BRYN MAWR, PA 19010
MLS# PAMC2156540Listed by: COMPASS PENNSYLVANIA, LLC $1,500,000Pending4 beds 4 baths2,951 sq. ft.
1034 Raffles Ln, BRYN MAWR, PA 19010
MLS# PAMC2153632Listed by: BHHS FOX & ROACH-HAVERFORD $610,000Pending4 beds 3 baths2,016 sq. ft.
145 Landover Rd, BRYN MAWR, PA 19010
MLS# PADE2097818Listed by: RE/MAX PRIME REAL ESTATE $873,000Pending3 beds 5 baths2,522 sq. ft.
71 S Merion Ave, BRYN MAWR, PA 19010
MLS# PAMC2148758Listed by: COMPASS PENNSYLVANIA, LLC $3,999,999Active5 beds 8 baths8,700 sq. ft.
726 John Barry Dr, BRYN MAWR, PA 19010
MLS# PAMC2135044Listed by: SERHANT PENNSYLVANIA LLC $1,800,000Active1.42 Acres
22 Foxwood Cir, BRYN MAWR, PA 19010
MLS# PAMC2129420Listed by: COMPASS PENNSYLVANIA, LLC $13,000Active0.01 Acres
741 County Line Rd, BRYN MAWR, PA 19010
MLS# PAMC2165676Listed by: AMO REALTY
Local realty services provided by:CENTURY 21 Above and Beyond
Popular searches near 19010
Popular neighborhoods near 19010
- Andorra, Philadelphia homes for sale
- Ardmore, Ardmore homes for sale
- Bala Cynwyd, Bala Cynwyd homes for sale
- Bryn Mawr, Bryn Mawr homes for sale
- Carroll Park, Philadelphia homes for sale
- Dearnley Park, Philadelphia homes for sale
- Gladwyne, Gladwyne homes for sale
- Haddington, Philadelphia homes for sale
- Haverford, Haverford homes for sale
- Manayunk, Philadelphia homes for sale
- Merion Station, Merion Station homes for sale
- Narberth, Narberth homes for sale
- Overbrook, Philadelphia homes for sale
- Penn Wynne, Wynnewood homes for sale
- Roxborough, Philadelphia homes for sale
- Villanova, Villanova homes for sale
- West Philadelphia, Philadelphia homes for sale
- Wynnefield, Philadelphia homes for sale
- Wynnefield Heights, Philadelphia homes for sale
- Wynnewood, Wynnewood homes for sale
Counties near Bryn Mawr, 19010
- Atlantic County homes for sale
- Berks County homes for sale
- Bucks County homes for sale
- Burlington County homes for sale
- Camden County homes for sale
- Cecil County homes for sale
- Chester County homes for sale
- Cumberland County homes for sale
- Delaware County homes for sale
- Gloucester County homes for sale
- Hunterdon County homes for sale
- Lancaster County homes for sale
- Lehigh County homes for sale
- Mercer County homes for sale
- Montgomery County homes for sale
- New Castle County homes for sale
- Northampton County homes for sale
- Philadelphia County homes for sale
- Salem County homes for sale
- Somerset County homes for sale
Protect your home and budget from life's surprises with an Assurant Home Warranty, backed by a partner that supports you through every step of homeownership. Explore Plans.
©2026 Century 21 Real Estate LLC. All rights reserved. CENTURY 21®, the CENTURY 21 Logo and C21® are service marks owned by Century 21 Real Estate LLC. Century 21 Real Estate LLC fully supports the principles of the Fair Housing Act and the Equal Opportunity Act. Each office is independently owned and operated. Listing information is deemed reliable but not guaranteed accurate.