- Anna homes for sale
- Bloomfield homes for sale
- Buncombe homes for sale
- Cobden homes for sale
- Elvira homes for sale
- Goreville homes for sale
- Goreville No. 1 homes for sale
- Goreville No. 2 homes for sale
- Grassy homes for sale
- Jonesboro homes for sale
- Lake No. 1 homes for sale
- Lake No. 2 homes for sale
- Lick Creek homes for sale
- Makanda homes for sale
- Southern homes for sale
- Tunnel Hill homes for sale
- Vienna homes for sale
- Vienna No. 1 homes for sale
- Vienna No. 2 homes for sale
- Vienna No. 3 homes for sale
62912, IL - homes for sale
5 of 5 results displayed
- New
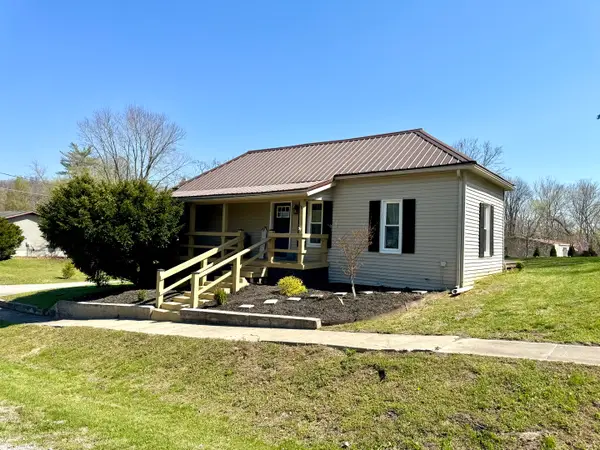 $124,500Active3 beds 2 baths1,455 sq. ft.
56 May Avenue, Buncombe, IL 62912
MLS# 12603542Listed by: SHAWNEE HILLS REAL ESTATE, LLC
 $1Pending4 beds 3 baths2,280 sq. ft.
1240 Hummingbird Road, Buncombe, IL 62912
MLS# 12544124Listed by: JOE OLLIS REAL ESTATE & AUCTIO $162,000Active2 beds 1 baths1,100 sq. ft.
7280 Buncombe Road, Buncombe, IL 62912
MLS# EB455718Listed by: MIDWEST REAL ESTATE $550,000Active2 beds 1 baths2,040 sq. ft.
20 Mount Pisgah Road, Buncombe, IL 62912
MLS# EB460800Listed by: RE/MAX REALTY CENTRAL $154,900Active3 beds 2 baths1,280 sq. ft.
860 N Lick Creek Road, Buncombe, IL 62912
MLS# PA1263421Listed by: HOUSE 2 HOME REALTY
Local realty services provided by:CENTURY 21 New Beginnings, CENTURY 21 Broughton Team
Copyright 2026 Midwest Real Estate Data LLC. All rights reserved. The data relating to real estate for sale on this web site comes in part from the Broker Reciprocity Program of the Midwest Real Estate Data LLC. Listing information is deemed reliable but not guaranteed.
Popular searches near 62912
Popular neighborhoods near 62912
- Arnold, Arnold homes for sale
- Barnhart, Barnhart homes for sale
- Claremont, East Saint Louis homes for sale
- Crystal City, Crystal City homes for sale
- Fort Campbell, Woodlawn homes for sale
- Fountain Place, Fairview Heights homes for sale
- Imperial, Imperial homes for sale
- Iroquois Gardens, Evansville homes for sale
- Lemay, Saint Louis homes for sale
- Oakville, Saint Louis homes for sale
- Patch, Saint Louis homes for sale
- Reunion, Belleville homes for sale
- Tanglewood, Caseyville homes for sale
- The Orchards, Belleville homes for sale
Counties near Buncombe, 62912
- Alexander County homes for sale
- Cape Girardeau County homes for sale
- Franklin County homes for sale
- Gallatin County homes for sale
- Hamilton County homes for sale
- Hardin County homes for sale
- Jackson County homes for sale
- Johnson County homes for sale
- Livingston County homes for sale
- Massac County homes for sale
- McCracken County homes for sale
- Mississippi County homes for sale
- Perry County homes for sale
- Perry County homes for sale
- Pope County homes for sale
- Pulaski County homes for sale
- Saline County homes for sale
- Scott County homes for sale
- Union County homes for sale
- Williamson County homes for sale
Protect your home and budget from life's surprises with an Assurant Home Warranty, backed by a partner that supports you through every step of homeownership. Explore Plans.
©2026 Century 21 Real Estate LLC. All rights reserved. CENTURY 21®, the CENTURY 21 Logo and C21® are service marks owned by Century 21 Real Estate LLC. Century 21 Real Estate LLC fully supports the principles of the Fair Housing Act and the Equal Opportunity Act. Each office is independently owned and operated. Listing information is deemed reliable but not guaranteed accurate.