- Arlington Park, Greensboro properties for sale
- Ashbury, Mebane properties for sale
- Bryson Ridge, Greensboro properties for sale
- Clinton Hills, Greensboro properties for sale
- Cone Mills Community, Greensboro properties for sale
- Downtown Greensboro, Greensboro properties for sale
- Fisher Park, Greensboro properties for sale
- Glendale Hills, Greensboro properties for sale
- Logan, Greensboro properties for sale
- Martin Area, Greensboro properties for sale
- O Henry Oaks, Greensboro properties for sale
- Old Irving Park, Greensboro properties for sale
- Ole Asheboro, Greensboro properties for sale
- Phillips Ave, Greensboro properties for sale
- Rankin Area, Greensboro properties for sale
- Textile Dr. / Waugh St., Greensboro properties for sale
- White Oaks, Greensboro properties for sale
- Willow Oaks, Greensboro properties for sale
- Woodlea, Greensboro properties for sale
- Woodmere Park, Greensboro properties for sale
Burlington, NC - homes for sale
300 of 373 results displayed
- New
 $200,000Active3 beds 2 baths
417 Piedmont Way, Burlington, NC 27217
MLS# 1204627Listed by: BARBOUR & COMPANY
- New
 $135,000Active2 beds 1 baths756 sq. ft.
611 E Willowbrook Drive, Burlington, NC 27215
MLS# 10137641Listed by: MAY REALTY GROUP, LLC - New
 $248,990Active2 beds 3 baths1,416 sq. ft.
168 Canopy Drive, Graham, NC 27253
MLS# 10137652Listed by: D. R. HORTON, INC. - New
 $248,990Active2 beds 3 baths1,416 sq. ft.
180 Canopy Drive, Graham, NC 27253
MLS# 10137654Listed by: D. R. HORTON, INC. - New
 $250,990Active3 beds 3 baths1,429 sq. ft.
186 Canopy Drive, Graham, NC 27253
MLS# 10137655Listed by: D. R. HORTON, INC. - New
 $135,000Active2 beds 1 baths
611 E Willowbrook Drive, Burlington, NC 27215
MLS# 1204390Listed by: MAY REALTY GROUP LLC - New
 $190,000Active2 beds 1 baths1,060 sq. ft.
909 E Morehead Street, Burlington, NC 27215
MLS# 10137627Listed by: NEWSTONE REALTY, LLC - Coming Soon
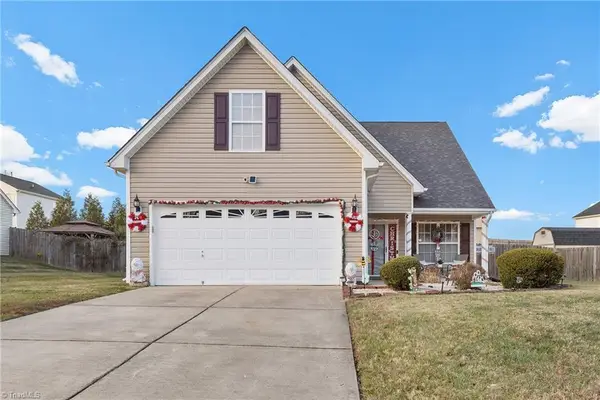
 $310,000Coming Soon3 beds 2 baths
1315 Springdale Drive, Burlington, NC 27215
MLS# 10137628Listed by: ALLEN TATE/BURLINGTON - New
 $310,000Active3 beds 2 baths1,398 sq. ft.
825 Graham Street, Burlington, NC 27217
MLS# 10137566Listed by: KEYSTAR REALTY & MANAGEMENT LL - New
 $258,990Active3 beds 3 baths
174 Canopy Drive, Graham, NC 27253
MLS# 1203415Listed by: DR HORTON - New
 $270,990Active3 beds 3 baths
162 Canopy Drive, Graham, NC 27253
MLS# 1203416Listed by: DR HORTON - New
 $235,000Active3 beds 2 baths
1111 Morningside Drive, Burlington, NC 27217
MLS# 1204235Listed by: REAL BROKER, LLC - New
 $210,000Active2 beds 1 baths
1217 Border Street, Burlington, NC 27217
MLS# 1204417Listed by: MOVIL REALTY  $150,000Pending3 beds 1 baths984 sq. ft.
159 Hazel Drive, Burlington, NC 27217
MLS# 10137168Listed by: COMPASS -- RALEIGH- New
 $197,000Active2 beds 2 baths
2202 Huntington Road #B5, Burlington, NC 27215
MLS# 1204421Listed by: EXP REALTY - New
 $197,000Active2 beds 2 baths1,215 sq. ft.
2202 Huntington Road #Unit B5, Burlington, NC 27215
MLS# 10137140Listed by: EXP REALTY OF PIEDMONT NC LLC  $240,000Pending2 beds 2 baths
3027 Maple Avenue #R-1, Burlington, NC 27215
MLS# 1204031Listed by: ELEVATION REALTY- Open Sat, 2 to 4pm
 $195,000Pending2 beds 2 baths1,092 sq. ft.
2431 Moran Street #Apt C, Burlington, NC 27215
MLS# 10136968Listed by: NORTHGROUP REAL ESTATE LLC  $375,000Pending3 beds 2 baths
118 Random Lane, Burlington, NC 27215
MLS# 1204342Listed by: HOWARD HANNA ALLEN TATE - BURLINGTON $310,000Pending3 beds 2 baths
1950 Tweed Lane, Burlington, NC 27215
MLS# 1204345Listed by: BARBOUR & COMPANY $310,000Pending3 beds 2 baths1,501 sq. ft.
1950 Tweed Lane, Burlington, NC 27215
MLS# 10136941Listed by: BARBOUR & COMPANY- New
 $135,000Active1 beds 1 baths692 sq. ft.
1918 Durham Street, Burlington, NC 27217
MLS# 10136895Listed by: EXP REALTY  $240,000Pending2 beds 2 baths1,385 sq. ft.
3027 Maple Avenue #Apt R1, Burlington, NC 27215
MLS# 10136831Listed by: ELEVATION REALTY, LLC- New
 $260,000Active3 beds 3 baths1,218 sq. ft.
416 Hallie Long Lane, Burlington, NC 27217
MLS# 10136840Listed by: EXP REALTY OF PIEDMONT NC LLC - Open Sat, 2am to 4pm
 $195,000Pending2 beds 2 baths
2431 Moran Street #C, Burlington, NC 27215
MLS# 1203908Listed by: NORTHGROUP REAL ESTATE - New
 $265,000Active3 beds 2 baths1,731 sq. ft.
2421 Lacy Street, Burlington, NC 27215
MLS# 10136729Listed by: ALLEN TATE/BURLINGTON - New
 $285,000Active2 beds 3 baths1,776 sq. ft.
2857 Willoughby Court, Burlington, NC 27215
MLS# 10136667Listed by: HENDREN REALTY - New
 $285,000Active2 beds 3 baths
2857 Willoughby Court, Burlington, NC 27215
MLS# 1204051Listed by: HENDREN REALTY - New
 $357,500Active3 beds 2 baths
514 Country Club Drive, Burlington, NC 27215
MLS# 1203629Listed by: EXP REALTY - New
 $285,000Active3 beds 3 baths
825 Lockesley Lane, Burlington, NC 27217
MLS# 1204061Listed by: EXP REALTY 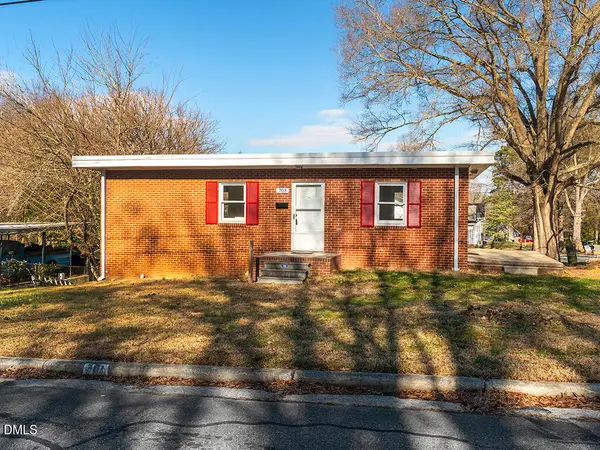 $150,000Pending3 beds 1 baths1,325 sq. ft.
703 Wicker Street, Burlington, NC 27217
MLS# 10136463Listed by: KELLY WIRT REALTY GROUP, LLC $150,000Pending3 beds 1 baths
703 Wicker Street, Burlington, NC 27217
MLS# 1203646Listed by: KELLY WIRT REALTY GROUP- New
 $320,000Active3 beds 3 baths
629 Brassfield Drive, Burlington, NC 27217
MLS# 1204068Listed by: CKG REALTY LLC - New
 $425,000Active4 beds 3 baths
2919 Victoria Falls Drive, Burlington, NC 27215
MLS# 1203720Listed by: EXP REALTY - New
 $250,000Active2 beds 2 baths1,305 sq. ft.
3027 Maple Avenue #Apt J2, Burlington, NC 27215
MLS# 10136323Listed by: KELLY WIRT REALTY GROUP, LLC - New
 $250,000Active2 beds 2 baths
3027 Maple Avenue #J2, Burlington, NC 27215
MLS# 1203755Listed by: KELLY WIRT REALTY GROUP  $199,900Active2 beds 1 baths700 sq. ft.
525 Lee Street, Burlington, NC 27217
MLS# 10136210Listed by: ADAMS HOMES REALTY, INC $275,000Pending3 beds 2 baths
204 Trail Four, Burlington, NC 27215
MLS# 1203634Listed by: KELLER WILLIAMS CENTRAL $440,000Active4 beds 3 baths
3326 Brookstone Drive, Burlington, NC 27215
MLS# 1203808Listed by: REDFIN CORPORATION $65,500Pending-- Acres
2243 Durham Street Extension, Burlington, NC 27217
MLS# 1203769Listed by: CHOSEN REALTY OF NC $190,000Active0.62 Acres
427 Rauhut Street, Burlington, NC 27217
MLS# 10135897Listed by: CITYSCAPES PROPERTIES LLC- Open Sun, 1 to 3pm
 $450,000Active3 beds 3 baths2,383 sq. ft.
533 Parkview Drive, Burlington, NC 27215
MLS# 10135824Listed by: INVESTED REALTY 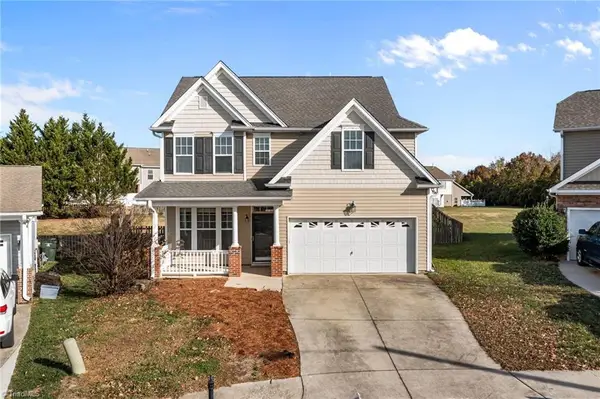 $328,000Active3 beds 3 baths
4018 Bow Court, Burlington, NC 27215
MLS# 1203665Listed by: KELLER WILLIAMS ONE $329,900Pending3 beds 3 baths
2407 Saddle Club Road, Burlington, NC 27215
MLS# 1203430Listed by: HOWARD HANNA ALLEN TATE OAK RIDGE COMMONS $260,000Pending3 beds 2 baths1,275 sq. ft.
609 Fernway Drive, Burlington, NC 27217
MLS# 10135609Listed by: LPT REALTY, LLC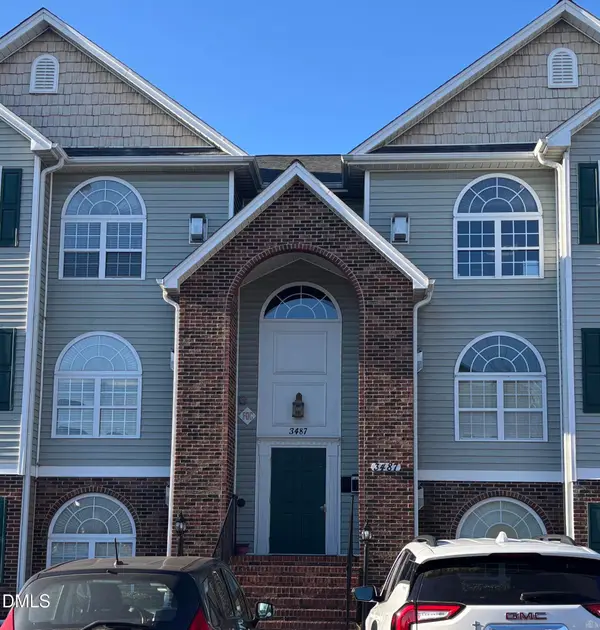 $195,000Active2 beds 2 baths1,195 sq. ft.
3487 Forestdale Drive #1c, Burlington, NC 27215
MLS# 10135429Listed by: KELLER WILLIAMS CENTRAL- Open Fri, 8am to 7pm
 $440,000Active5 beds 3 baths
2297 Lakeview Terrace, Burlington, NC 27215
MLS# 1203456Listed by: OPENDOOR BROKERAGE LLC  $195,000Active2 beds 2 baths
3487 Forestdale Drive #1C, Burlington, NC 27215
MLS# 1203341Listed by: KELLER WILLIAMS CENTRAL $475,000Pending3 beds 3 baths
4543 Freedom Drive, Burlington, NC 27215
MLS# 1203062Listed by: KELLY WIRT REALTY GROUP $333,000Active3 beds 2 baths
114 Cale Drive, Burlington, NC 27215
MLS# 1203357Listed by: 360 REALTY $410,000Active4 beds 3 baths
2075 Glenkirk Drive, Burlington, NC 27215
MLS# 1203339Listed by: RE/MAX DIAMOND REALTY $210,000Active2 beds 1 baths
1020 Lakeside Avenue, Burlington, NC 27217
MLS# 1203307Listed by: NORTHGROUP REAL ESTATE $175,000Active2 beds 1 baths
1710 Wood Avenue, Burlington, NC 27215
MLS# 1203326Listed by: NORTHGROUP REAL ESTATE $509,000Active6 beds 5 baths3,593 sq. ft.
523 Wildwood Lane, Burlington, NC 27215
MLS# 10135166Listed by: COLDWELL BANKER HPW $285,000Active3 beds 3 baths
401 Trail One, Burlington, NC 27215
MLS# 1202964Listed by: PREFERRED REALTY TRIAD $284,000Active2 beds 2 baths
207 W Holt Street, Burlington, NC 27217
MLS# 1203147Listed by: NORTHGROUP REAL ESTATE $595,000Pending4 beds 3 baths2,624 sq. ft.
1117 W Davis Street, Burlington, NC 27215
MLS# 10134963Listed by: BARBOUR & COMPANY $322,222Active2 beds 2 baths
2643 Trail Five, Burlington, NC 27215
MLS# 1203152Listed by: REAL BROKER LLC $260,000Pending2 beds 2 baths1,223 sq. ft.
2913 Alamance Road, Burlington, NC 27215
MLS# 10134841Listed by: RE/MAXDIAMOND REALTY $249,900Active2 beds 2 baths790 sq. ft.
1207 Jackson Street, Burlington, NC 27217
MLS# 10134792Listed by: PSC REALTY LLC $203,000Active3 beds 1 baths
1112 W Webb Avenue, Burlington, NC 27217
MLS# 1203018Listed by: KELLER WILLIAMS REALTY- Open Sat, 2 to 4pm
 $140,000Active2 beds 1 baths876 sq. ft.
1713 Lower Hopedale Road, Burlington, NC 27217
MLS# 10134586Listed by: STOIC PROPERTIES LLC  $344,900Active3 beds 2 baths2,089 sq. ft.
3105 Maple Avenue, Burlington, NC 27215
MLS# 10134567Listed by: NORTHGROUP REAL ESTATE, INC. $344,900Active3 beds 2 baths
3105 Maple Avenue, Burlington, NC 27215
MLS# 1202739Listed by: NORTHGROUP REAL ESTATE $279,000Pending3 beds 2 baths
1104 Tarleton Avenue, Burlington, NC 27215
MLS# 1202944Listed by: VICKY HUNLEY REAL ESTATE- Open Sun, 2 to 4pm
 $1,050,000Active4 beds 4 baths
2915 Truitt Drive, Burlington, NC 27215
MLS# 1202895Listed by: ELLINGTON REAL ESTATE GROUP  $248,990Active3 beds 3 baths
209 Moyer Drive, Graham, NC 27253
MLS# 1202909Listed by: DR HORTON $248,990Active3 beds 3 baths
215 Moyer Drive, Graham, NC 27253
MLS# 1202913Listed by: DR HORTON $260,990Active3 beds 3 baths
223 Moyer Drive, Graham, NC 27253
MLS# 1202914Listed by: DR HORTON $250,990Active3 beds 3 baths
205 Moyer Drive, Graham, NC 27253
MLS# 1202904Listed by: DR HORTON $335,000Active3 beds 2 baths
2712 Peachtree Street, Burlington, NC 27205
MLS# 1202466Listed by: FLEMANIA LEGACY GROUP $230,000Active3 beds 3 baths1,625 sq. ft.
2202 Huntington Road #Unit E3, Burlington, NC 27215
MLS# 10134114Listed by: DAVID MASSEY REAL ESTATE $149,000Pending2 beds 1 baths
905 N Park Road, Burlington, NC 27217
MLS# 1202744Listed by: R&B LEGACY GROUP $275,000Pending2 beds 2 baths
1021 Tarleton Avenue, Burlington, NC 27215
MLS# 1202646Listed by: KELLER WILLIAMS CENTRAL- Open Fri, 8am to 7pm
 $337,000Active3 beds 3 baths
2821 Edgewood Avenue, Burlington, NC 27215
MLS# 1202720Listed by: OPENDOOR BROKERAGE LLC  $279,000Pending3 beds 2 baths1,587 sq. ft.
3027 Maple Avenue #Q3, Burlington, NC 27215
MLS# 10133802Listed by: DAVID MASSEY REAL ESTATE $395,000Active2 beds 2 baths
301 Trail One, Burlington, NC 27215
MLS# 1202328Listed by: KAY HUNKINS, BROKER $335,000Active3 beds 2 baths
2068 Dresden Drive, Burlington, NC 27217
MLS# 1202454Listed by: AHB REALTY AND PROPERTY MGT $215,000Active3 beds 2 baths
1215 Cleveland Avenue, Burlington, NC 27217
MLS# 1201854Listed by: KELLER WILLIAMS CENTRAL $185,000Active4 beds 1 baths
814 Elizabeth Street, Burlington, NC 27217
MLS# 1202450Listed by: AHB REALTY AND PROPERTY MGT $185,000Pending2 beds 1 baths
1204 Wallace Street, Burlington, NC 27217
MLS# 1202394Listed by: SJL PROPERTIES OF THE TRIAD $493,206Active3 beds 2 baths
1275 Talisker Way, Burlington, NC 27215
MLS# 1202066Listed by: KEYSTONE REALTY GROUP $473,866Active3 beds 2 baths
1265 Talisker Way, Burlington, NC 27215
MLS# 1201933Listed by: KEYSTONE REALTY GROUP $105,000Active1 beds 1 baths
515 Smith Street, Burlington, NC 27217
MLS# 1201934Listed by: KELLER WILLIAMS CENTRAL $254,000Pending3 beds 3 baths
219 Moyer Drive, Graham, NC 27253
MLS# 1201938Listed by: DR HORTON $450,000Pending4 beds 3 baths
1108 Falkirk Drive, Burlington, NC 27215
MLS# 1202033Listed by: BARBOUR & COMPANY $328,000Active3 beds 2 baths
1931 Henry Road, Graham, NC 27253
MLS# 1201735Listed by: HOWARD HANNA ALLEN TATE - BURLINGTON $475,000Active4 beds 3 baths
2209 Walker Avenue, Burlington, NC 27215
MLS# 1201773Listed by: KELLER WILLIAMS REALTY $265,000Active3 beds 2 baths
1835 Greentree Road, Burlington, NC 27217
MLS# 1201810Listed by: EXP REALTY $83,000Pending2 beds 1 baths
1107 Alden Street, Burlington, NC 27217
MLS# 1201910Listed by: HOWARD HANNA ALLEN TATE - BURLINGTON $74,900Pending2 beds 1 baths
1302 Sidney Avenue, Burlington, NC 27217
MLS# 1201912Listed by: HOWARD HANNA ALLEN TATE - BURLINGTON $400,000Active3 beds 2 baths
411 Shadowbrook Drive, Burlington, NC 27215
MLS# 1201064Listed by: EXP REALTY $335,000Active3 beds 4 baths
4125 Shepherd Court, Burlington, NC 27215
MLS# 1201856Listed by: MARK SPAIN REAL ESTATE $299,999Active3 beds 2 baths
1526 Regency Court, Burlington, NC 27215
MLS# 1202023Listed by: MARK SPAIN REAL ESTATE $185,000Active3 beds 1 baths1,122 sq. ft.
507 S Mebane Street, Burlington, NC 27215
MLS# 10133286Listed by: AD REALTY PARTNERS, LLC $240,000Active3 beds 2 baths
621 Grace Avenue, Burlington, NC 27217
MLS# 1202237Listed by: AHB REALTY AND PROPERTY MGT $175,000Pending2 beds 1 baths765 sq. ft.
306 Thompson Street, Burlington, NC 27215
MLS# 10132958Listed by: KELLER WILLIAMS CENTRAL $493,206Active3 beds 2 baths2,079 sq. ft.
1275 Talisker Way #50, Burlington, NC 27215
MLS# 10132821Listed by: KEYSTONE REALTY GROUP, INC. $473,866Active3 beds 2 baths1,904 sq. ft.
1265 Talisker Way #49, Burlington, NC 27215
MLS# 10132595Listed by: KEYSTONE REALTY GROUP, INC. $449,000Pending4 beds 4 baths
817 Kimberly Road, Burlington, NC 27215
MLS# 1201494Listed by: PREFERRED REALTY TRIAD $479,000Pending4 beds 3 baths
1824 Abernethy Trail, Burlington, NC 27215
MLS# 1201617Listed by: HOWARD HANNA ALLEN TATE - BURLINGTON $259,900Active3 beds 2 baths
1703 N Mebane Street, Burlington, NC 27217
MLS# 1201221Listed by: HOWARD HANNA ALLEN TATE - BURLINGTON $275,000Active3 beds 2 baths1,230 sq. ft.
2222 Sunset Hills Drive, Burlington, NC 27215
MLS# 10132113Listed by: PROFIT POINT REAL ESTATE $100,000Active3 beds 2 baths1,489 sq. ft.
438 Dudley Street, Burlington, NC 27217
MLS# 10132019Listed by: COLDWELL BANKER HPW $259,000Active3 beds 2 baths1,424 sq. ft.
2323 Buckingham Road, Burlington, NC 27217
MLS# 10131916Listed by: KEYSTAR REALTY & MANAGEMENT LL $190,000Active2 beds 2 baths1,246 sq. ft.
3475 Forestdale Drive #2a, Burlington, NC 27215
MLS# 10131926Listed by: NEXT STAGE REALTY $250,000Pending3 beds 2 baths1,420 sq. ft.
1335 Granville Street, Burlington, NC 27215
MLS# 10131787Listed by: 3 BROTHERS REALTY OF ALAMANCE $259,900Pending3 beds 2 baths
234 Foster Street, Burlington, NC 27217
MLS# 1200931Listed by: HOWARD HANNA ALLEN TATE - BURLINGTON $77,000Pending3 beds 1 baths
2039 Lower Hopedale Road, Burlington, NC 27217
MLS# 1201156Listed by: KELLER WILLIAMS CENTRAL $38,000Pending-- Acres
00 Lower Hopedale Road, Burlington, NC 27217
MLS# 1201160Listed by: KELLER WILLIAMS CENTRAL $315,000Active3 beds 2 baths
1926 W Front Street, Burlington, NC 27215
MLS# 1201305Listed by: KELLER WILLIAMS CENTRAL $497,000Pending4 beds 3 baths
2908 Moser Lane, Burlington, NC 27215
MLS# 1200830Listed by: MARK SPAIN REAL ESTATE $649,900Active5 beds 3 baths
4111 Dublin Court, Burlington, NC 27215
MLS# 1201381Listed by: TYLER REDHEAD & MCALISTER REAL ESTATE, LLC $480,000Active4 beds 3 baths
1457 Kernodle Landing Drive, Burlington, NC 27217
MLS# 1200709Listed by: KELLER WILLIAMS ONE $285,000Active3 beds 3 baths
1162 Woodsman Drive, Burlington, NC 27217
MLS# 1201003Listed by: JEFF COOK REAL ESTATE LPT REALTY $268,000Pending3 beds 2 baths1,395 sq. ft.
1725 Glenn Street, Burlington, NC 27217
MLS# 10131359Listed by: FATHOM REALTY NC $430,000Active3 beds 2 baths
418 Westhampton Drive, Burlington, NC 27215
MLS# 1201216Listed by: KELLER WILLIAMS CENTRAL $44,000Active-- Acres
TBD Hooker Street, Burlington, NC 27217
MLS# 1201173Listed by: GSO REALTY PARTNERS $1,500,000Active-- Acres
0 Garden Road, Burlington, NC 27215
MLS# 1201178Listed by: EXP REALTY $228,000Active3 beds 2 baths1,040 sq. ft.
825 Parkwood Street, Burlington, NC 27215
MLS# 10131270Listed by: FATHOM REALTY NC, LLC $165,000Pending2 beds 3 baths
2474 Moran Street, Burlington, NC 27215
MLS# 1201152Listed by: HOWARD HANNA ALLEN TATE - BURLINGTON $165,000Pending2 beds 3 baths1,232 sq. ft.
2474 Moran Street #Apt H, Burlington, NC 27215
MLS# 10131259Listed by: ALLEN TATE/BURLINGTON $538,500Pending4 beds 4 baths
3232 Hiddenwood Lane, Burlington, NC 27215
MLS# 1200951Listed by: EXP REALTY $639,000Pending5 beds 5 baths3,279 sq. ft.
127 Bannockburn, Burlington, NC 27215
MLS# 10131013Listed by: NORTHGROUP REAL ESTATE LLC $499,900Active-- beds -- baths
215 N Logan Street, Burlington, NC 27217
MLS# 1200908Listed by: COLDWELL BANKER - HP&W $350,000Active3 beds 3 baths
1267 Westview Terrace, Burlington, NC 27215
MLS# 1200142Listed by: BARBOUR & COMPANY $195,000Active3 beds 2 baths
3009 Winston Drive #84, Burlington, NC 27215
MLS# 1200534Listed by: EXCLUSIVE REALTY GROUP LLC $175,000Pending2 beds 1 baths
2302 Mckinney Street, Burlington, NC 27217
MLS# 1200613Listed by: ALAMANCE COUNTY REALTY $299,000Pending3 beds 2 baths1,200 sq. ft.
1811 Brown Avenue, Burlington, NC 27215
MLS# 100538525Listed by: EXP REALTY $250,000Active3 beds 3 baths1,728 sq. ft.
4032 Comrie Lane, Burlington, NC 27215
MLS# 10130199Listed by: HOWARD HANNA ALLEN TATE GREENSBORO $245,000Pending3 beds 2 baths
315 Stokes Street, Burlington, NC 27215
MLS# 1200468Listed by: HOWARD HANNA ALLEN TATE - BURLINGTON $475,500Active5 beds 3 baths2,783 sq. ft.
2055 Shirley Drive, Burlington, NC 27215
MLS# 10130006Listed by: LOCAL TO COASTAL REALTY $59,000Active0.29 Acres
0 Lewis Drive, Burlington, NC 27253
MLS# 10129958Listed by: DALTON WADE, INC. $61,000Active0.3 Acres
0 Lewis Drive, Burlington, NC 27253
MLS# 10129959Listed by: DALTON WADE, INC. $349,900Active4 beds 3 baths
1108 Aster Way, Burlington, NC 27215
MLS# 1200309Listed by: REALTY ONE GROUP RESULTS $399,000Active4 beds 3 baths
2174 Woodland Avenue, Burlington, NC 27215
MLS# 1199985Listed by: HOWARD HANNA ALLEN TATE - BURLINGTON $240,000Active-- beds -- baths
916 - 918 Harris Street, Burlington, NC 27217
MLS# 1200067Listed by: MAY REALTY GROUP LLC $1,399,900Active6 beds 7 baths
4229 Limerick Drive, Burlington, NC 27215
MLS# 1198831Listed by: EXP REALTY $299,000Active3 beds 2 baths1,911 sq. ft.
1331 Granville Street, Burlington, NC 27215
MLS# 10129416Listed by: MOVIL REALTY $325,000Active3 beds 2 baths1,683 sq. ft.
2415 Trail Five, Burlington, NC 27215
MLS# 10129386Listed by: MARK SPAIN REAL ESTATE $320,000Pending3 beds 2 baths
2511 Hickory Avenue, Burlington, NC 27215
MLS# 1199924Listed by: EXP REALTY $144,900Active2 beds 1 baths
516 Avon Avenue, Burlington, NC 27215
MLS# 1199955Listed by: COLDWELL BANKER - HP&W $300,000Active3 beds 2 baths
1004 Sherwood Drive, Burlington, NC 27215
MLS# 1199952Listed by: HOWARD HANNA ALLEN TATE - BURLINGTON $270,990Pending3 beds 3 baths
216 Canopy Drive, Graham, NC 27253
MLS# 1199901Listed by: DR HORTON $345,000Pending3 beds 2 baths
3015 Juniper Drive, Burlington, NC 27215
MLS# 1198419Listed by: HOWARD HANNA ALLEN TATE - BURLINGTON $250,000Active3 beds 3 baths1,664 sq. ft.
2926 Grove Park Drive, Burlington, NC 27215
MLS# 10128955Listed by: PILLAR REAL ESTATE $250,000Active3 beds 3 baths
2926 Grove Park Drive, Burlington, NC 27215
MLS# 1199801Listed by: PILLAR REAL ESTATE $265,000Active3 beds 2 baths
1917 Edgewood Avenue, Burlington, NC 27215
MLS# 1199617Listed by: HERNANDEZ REALTY $410,000Active5 beds 3 baths
346 Sapphire Road, Burlington, NC 27215
MLS# 1199368Listed by: GOLDEN HARVEST REALTY LLC $825,000Active5 beds 4 baths
4109 Cheek Point Place, Burlington, NC 27215
MLS# 1199376Listed by: EXP REALTY $229,999Pending3 beds 2 baths
1234 Kenwood Drive, Burlington, NC 27215
MLS# 1199338Listed by: CLIFTON PROPERTY INVESTMENT LLC $925,000Active5 beds 5 baths
1096 Crestwell Drive, Burlington, NC 27215
MLS# 1198933Listed by: KELLER WILLIAMS CENTRAL $247,490Active3 beds 3 baths
204 Canopy Drive, Graham, NC 27253
MLS# 1199387Listed by: DR HORTON $247,490Active3 beds 3 baths
208 Canopy Drive, Graham, NC 27253
MLS# 1199390Listed by: DR HORTON $249,490Active3 beds 3 baths
212 Canopy Drive, Graham, NC 27253
MLS# 1199391Listed by: DR HORTON $258,990Active3 beds 3 baths
200 Canopy Drive, Graham, NC 27253
MLS# 1199380Listed by: DR HORTON $345,000Active3 beds 3 baths1,981 sq. ft.
2346 Campbell Loop #32, Burlington, NC 27215
MLS# 4313144Listed by: MINO REALTY LLC $259,999Pending3 beds 2 baths1,395 sq. ft.
2307 Pinecroft Drive, Burlington, NC 27217
MLS# 10127717Listed by: MARK SPAIN REAL ESTATE $468,526Active2 beds 3 baths2,238 sq. ft.
1225 Talisker Way #42, Burlington, NC 27215
MLS# 10127396Listed by: KEYSTONE REALTY GROUP, INC. $468,526Active2 beds 3 baths
1225 Talisker Way, Burlington, NC 27215
MLS# 1198968Listed by: KEYSTONE REALTY GROUP $469,701Active2 beds 3 baths2,256 sq. ft.
1229 Talisker Way #44, Burlington, NC 27215
MLS# 10127378Listed by: KEYSTONE REALTY GROUP, INC. $469,701Active2 beds 3 baths
1229 Talisker Way, Burlington, NC 27215
MLS# 1198954Listed by: KEYSTONE REALTY GROUP $212,000Pending2 beds 1 baths772 sq. ft.
828 Buckner Street, Graham, NC 27253
MLS# 10127367Listed by: THE CEDENO GROUP REAL ESTATE LLC $200,000Active2 beds 2 baths1,102 sq. ft.
3489 Forestdale Drive #1c, Burlington, NC 27215
MLS# 10127225Listed by: FATHOM REALTY NC, LLC $749,000Active4 beds 4 baths
509 Fieldstone Drive, Burlington, NC 27215
MLS# 1198814Listed by: KELLER WILLIAMS CENTRAL $200,000Active2 beds 2 baths
3489 Forestdale Drive #1C, Burlington, NC 27215
MLS# 1198751Listed by: FATHOM REALTY $760,000Active5 beds 6 baths
240 Coachlight Trail, Burlington, NC 27215
MLS# 1198613Listed by: KELLER WILLIAMS CENTRAL $350,000Active5 beds 3 baths
1023 S Main Street, Burlington, NC 27215
MLS# 1198591Listed by: 1800 REAL ESTATE INC $415,000Active4 beds 2 baths
2323 Pineview Drive, Burlington, NC 27215
MLS# 1198425Listed by: ELEVATION REALTY $74,900Pending2 beds 1 baths856 sq. ft.
1615 Preston Street, Burlington, NC 27217
MLS# 10126288Listed by: ALAMANCE-TRIAD REAL ESTATE $380,000Active4 beds 3 baths
1086 Salters Street, Burlington, NC 27215
MLS# 1198330Listed by: KELLER WILLIAMS CENTRAL $114,000Active3 beds 2 baths
817 Williams Street, Burlington, NC 27217
MLS# 1198273Listed by: EXP REALTY $409,900Active3 beds 3 baths3,145 sq. ft.
2007 Sunnybrook Drive, Burlington, NC 27215
MLS# 10125874Listed by: KELLER WILLIAMS CENTRAL $497,900Active4 beds 4 baths
3608 Steeplegate Court, Burlington, NC 27215
MLS# 1197957Listed by: ELEVATION REALTY $269,900Pending3 beds 2 baths
2517 Watt Drive, Burlington, NC 27215
MLS# 1197562Listed by: REAL BROKER LLC $185,000Pending3 beds 2 baths
2249 Pinecroft Drive, Burlington, NC 27217
MLS# 1197729Listed by: EXP REALTY $498,000Pending5 beds 4 baths
4236 Aviemore Run, Burlington, NC 27215
MLS# 1197617Listed by: REAL BROKER LLC $829,900Pending-- beds -- baths
312 Stokes Street, Burlington, NC 27215
MLS# 1197508Listed by: ELEVATION REALTY $339,990Active2 beds 3 baths
1055 Talisker Way, Burlington, NC 27215
MLS# 1197464Listed by: KEYSTONE REALTY GROUP $439,990Active2 beds 3 baths
1061 Talisker Way, Burlington, NC 27215
MLS# 1197466Listed by: KEYSTONE REALTY GROUP $33,900Pending0.61 Acres
0 N Ireland Street, Burlington, NC 27217
MLS# 10124664Listed by: CHOSEN REAL ESTATE GROUP $290,000Pending3 beds 2 baths1,628 sq. ft.
3402 Garden Road, Burlington, NC 27215
MLS# 10124598Listed by: RE/MAXDIAMOND REALTY $375,000Active3 beds 2 baths1,890 sq. ft.
1074 Stowe Street, Burlington, NC 27215
MLS# 10124569Listed by: PREFERRED REALTY TRIAD $375,000Active3 beds 2 baths
1074 Stowe Street, Burlington, NC 27215
MLS# 1196735Listed by: PREFERRED REALTY TRIAD $550,000Pending4 beds 4 baths
2037 Gurney Court, Burlington, NC 27215
MLS# 1197313Listed by: HOWARD HANNA ALLEN TATE - BURLINGTON $250,000Active3 beds 3 baths1,576 sq. ft.
7358 Colleen Park Drive, Whitsett, NC 27377
MLS# 10124469Listed by: BETTER HOMES & GARDENS REAL ES- Open Sat, 1 to 3pm
 $259,900Active3 beds 2 baths
639 Woodhaven Drive, Burlington, NC 27217
MLS# 1197090Listed by: CAROLINA HOME PARTNERS BY EXP REALTY  $289,000Active3 beds 3 baths1,311 sq. ft.
737 Grover Lane, Burlington, NC 27217
MLS# 10124365Listed by: MOVIL REALTY $285,000Active3 beds 2 baths
2032 Nc Highway 62 W, Burlington, NC 27215
MLS# 1196444Listed by: ALLEN TATE - BURLINGTON $345,000Pending4 beds 3 baths
287 Thistle Downs Drive, Burlington, NC 27215
MLS# 1196658Listed by: EXP REALTY $375,920Active3 beds 3 baths1,788 sq. ft.
1227 Talisker Way #43, Burlington, NC 27215
MLS# 10123822Listed by: KEYSTONE REALTY GROUP, INC. $375,920Active3 beds 3 baths
1227 Talisker Way, Burlington, NC 27215
MLS# 1196893Listed by: KEYSTONE REALTY GROUP $125,000Active2 beds 1 baths875 sq. ft.
1700 Roslyn Drive # 29d, Burlington, NC 27215
MLS# 10123631Listed by: BEAUSOLEIL REALTY GROUP LLC $125,000Active2 beds 1 baths
1700 Roslyn Drive #29 D, Burlington, NC 27215
MLS# 1196531Listed by: BEAUSOLEIL REALTY GROUP LLC $207,500Pending3 beds 2 baths
1434 Morningside Drive, Burlington, NC 27217
MLS# 1196771Listed by: SWEATT REALTY LLC $455,000Active4 beds 4 baths
665 Brycewood Drive, Burlington, NC 27215
MLS# 1196741Listed by: EXP REALTY $599,990Active4 beds 3 baths3,265 sq. ft.
1083 Tulloch Court #206, Burlington, NC 27215
MLS# 10123268Listed by: KEYSTONE REALTY GROUP, INC. $599,990Active4 beds 3 baths
1083 Tulloch Court, Burlington, NC 27215
MLS# 1196505Listed by: KEYSTONE REALTY GROUP $765,000Active5 beds 3 baths
115 Coachlight Trail, Burlington, NC 27215
MLS# 1196345Listed by: KELLER WILLIAMS CENTRAL $247,000Active3 beds 3 baths1,429 sq. ft.
204 Moyer Drive, Graham, NC 27253
MLS# 10122993Listed by: D. R. HORTON, INC. $247,000Active3 beds 3 baths1,429 sq. ft.
208 Moyer Drive, Graham, NC 27253
MLS# 10123003Listed by: D. R. HORTON, INC. $254,000Pending3 beds 3 baths1,416 sq. ft.
240 Canopy Drive, Graham, NC 27253
MLS# 10122966Listed by: D. R. HORTON, INC. $247,000Active3 beds 3 baths1,416 sq. ft.
212 Moyer Drive, Graham, NC 27253
MLS# 10122876Listed by: D. R. HORTON, INC. $254,000Pending3 beds 3 baths1,416 sq. ft.
236 Canopy Drive, Graham, NC 27253
MLS# 10122893Listed by: D. R. HORTON, INC. $170,000Active2 beds 2 baths1,152 sq. ft.
3015 Winston Drive #112, Burlington, NC 27215
MLS# 10122902Listed by: HCO PROPERTIES $170,000Active2 beds 2 baths
3015 Winston Drive, Burlington, NC 27215
MLS# 1196341Listed by: H-CO PROPERTIES $248,000Active3 beds 3 baths1,416 sq. ft.
200 Moyer Drive, Graham, NC 27253
MLS# 10122839Listed by: D. R. HORTON, INC. $220,000Pending2 beds 1 baths
705 Durham Street, Burlington, NC 27217
MLS# 1196281Listed by: BARBOUR & COMPANY $319,990Active2 beds 3 baths
1110 Talisker Way, Burlington, NC 27215
MLS# 1176890Listed by: KEYSTONE REALTY GROUP $225,000Active3 beds 2 baths1,399 sq. ft.
625 N Mebane Street, Burlington, NC 27217
MLS# 10122649Listed by: ELEVATION REALTY, LLC $609,990Active4 beds 4 baths
1097 Tulloch Court, Burlington, NC 27215
MLS# 1194990Listed by: KEYSTONE REALTY GROUP $599,990Active4 beds 3 baths
1092 Tulloch Court, Burlington, NC 27215
MLS# 1195147Listed by: KEYSTONE REALTY GROUP $299,000Pending3 beds 2 baths
2272 May Drive, Burlington, NC 27215
MLS# 1195738Listed by: TKB REALTY GROUP LLC $495,000Pending4 beds 3 baths
1311 Lael Forest Trail, Burlington, NC 27215
MLS# 1195618Listed by: UNITED REALTY GROUP INC $367,500Pending3 beds 3 baths
3202 Overlook Court, Burlington, NC 27215
MLS# 1195418Listed by: EXP REALTY $150,000Active2 beds 1 baths
735 Everett Street, Burlington, NC 27215
MLS# 1195366Listed by: RE/MAX DIAMOND REALTY $472,500Pending4 beds 4 baths
1314 Lael Forest Trail, Burlington, NC 27215
MLS# 1195319Listed by: BARBOUR & COMPANY $800,000Active4 beds 4 baths3,275 sq. ft.
4104 Limerick Drive, Burlington, NC 27215
MLS# 10120959Listed by: EXP REALTY $599,990Active4 beds 3 baths3,265 sq. ft.
1092 Tulloch Court #210, Burlington, NC 27215
MLS# 10120794Listed by: KEYSTONE REALTY GROUP, INC. $340,000Active5 beds 3 baths2,297 sq. ft.
1023 S Main Street, Burlington, NC 27215
MLS# 10120797Listed by: 1800 REAL ESTATE, INC. $609,990Active4 beds 4 baths3,139 sq. ft.
1097 Tulloch Court #208, Burlington, NC 27215
MLS# 10120594Listed by: KEYSTONE REALTY GROUP, INC. $395,000Pending4 beds 4 baths
818 Colonial Drive, Burlington, NC 27215
MLS# 1194693Listed by: HOWARD HANNA ALLEN TATE - BURLINGTON $47,500Active-- Acres
TBD Dudley Street, Burlington, NC 27217
MLS# 1194669Listed by: GSO REALTY PARTNERS $285,000Active3 beds 2 baths1,258 sq. ft.
915 Apple Street, Burlington, NC 27217
MLS# 10119619Listed by: EXP REALTY, LLC - C $144,900Pending2 beds 1 baths
505 Brookline Drive, Burlington, NC 27217
MLS# 1194401Listed by: ALAMANCE COUNTY REALTY- Open Fri, 8am to 7pm
 $550,000Active4 beds 4 baths
330 Macallan Drive, Burlington, NC 27215
MLS# 1194332Listed by: OPENDOOR BROKERAGE LLC  $345,000Active3 beds 3 baths2,023 sq. ft.
2320 Campbell Loop, Burlington, NC 27215
MLS# 10119187Listed by: COLDWELL BANKER HPW $314,000Pending4 beds 3 baths
191 Prairie Court, Burlington, NC 27217
MLS# 1195316Listed by: BARBOUR & COMPANY $244,999Active2 beds 3 baths
1016 Pinnix Loop, Burlington, NC 27217
MLS# 1193940Listed by: RE/MAX DIAMOND REALTY $239,999Active2 beds 2 baths
1022 Pinnix Loop, Burlington, NC 27217
MLS# 1193941Listed by: RE/MAX DIAMOND REALTY $273,999Pending3 beds 3 baths
1007 Pinnix Loop, Burlington, NC 27217
MLS# 1193939Listed by: RE/MAX DIAMOND REALTY $280,999Active3 beds 2 baths
1030 Pinnix Loop, Burlington, NC 27217
MLS# 1193913Listed by: RE/MAX DIAMOND REALTY $279,999Active3 beds 2 baths
1008 Pinnix Loop, Burlington, NC 27217
MLS# 1193908Listed by: RE/MAX DIAMOND REALTY $200,000Active2 beds 1 baths
1731 E Webb Avenue, Burlington, NC 27217
MLS# 1193551Listed by: KELLER WILLIAMS CENTRAL $457,900Active4 beds 3 baths
2804 Edgewood Avenue, Burlington, NC 27215-4453
MLS# 1193460Listed by: NORTHGROUP REAL ESTATE $457,900Active4 beds 3 baths2,294 sq. ft.
2804 Edgewood Avenue, Burlington, NC 27215
MLS# 10117799Listed by: NORTHGROUP REAL ESTATE, INC. $250,000Active3 beds 3 baths
4032 Comrie Lane, Burlington, NC 27215
MLS# 1193227Listed by: HOWARD HANNA ALLEN TATE - GREENSBORO $925,000Pending-- Acres
0 Quail Run Lane, Burlington, NC 27215
MLS# 1191478Listed by: ZANE GERRINGER REAL ESTATE, INC $335,500Active3 beds 3 baths
1413 Keogh Street, Burlington, NC 27215
MLS# 1191553Listed by: TRIAD HOMES REAL ESTATE $335,500Active3 beds 3 baths
2518 Macleod Street, Burlington, NC 27217
MLS# 1191979Listed by: EXP REALTY $215,000Active3 beds 2 baths
1322 Elm Street, Burlington, NC 27217
MLS# 1191924Listed by: ELEVATION REALTY $295,000Pending4 beds 3 baths
259 Brassfield Drive, Burlington, NC 27217
MLS# 1191841Listed by: NORTHGROUP REAL ESTATE $140,000Active-- beds -- baths
112 Tucker Street, Burlington, NC 27215
MLS# 1191387Listed by: KELLER WILLIAMS CENTRAL $247,000Active3 beds 3 baths
208 Moyer Drive, Graham, NC 27253
MLS# 1191618Listed by: DR HORTON $253,000Pending3 beds 3 baths
244 Canopy Drive, Graham, NC 27253
MLS# 1191620Listed by: DR HORTON $247,000Active3 beds 3 baths
204 Moyer Drive, Graham, NC 27253
MLS# 1191555Listed by: DR HORTON $254,000Pending3 beds 3 baths
240 Canopy Drive, Graham, NC 27253
MLS# 1191552Listed by: DR HORTON $247,000Pending3 beds 3 baths
212 Moyer Drive, Graham, NC 27253
MLS# 1191533Listed by: DR HORTON $255,990Pending3 beds 3 baths
236 Canopy Drive, Graham, NC 27253
MLS# 1191542Listed by: DR HORTON $248,000Active3 beds 3 baths
200 Moyer Drive, Graham, NC 27253
MLS# 1191531Listed by: DR HORTON $205,000Active2 beds 1 baths1,092 sq. ft.
625 Columbia Ave Avenue, Burlington, NC 27217
MLS# 10116419Listed by: EXP REALTY OF PIEDMONT NC LLC $260,000Active3 beds 2 baths
3047 Winston Drive #171, Burlington, NC 27215
MLS# 1190830Listed by: THE WHITFIELD PROPERTIES TEAM $260,000Active3 beds 3 baths1,761 sq. ft.
3047 Winston Drive #Apt 171, Burlington, NC 27215
MLS# 10115433Listed by: WHITFIELD PROPERTIES TEAM $229,900Pending3 beds 2 baths
639 Holly Street, Burlington, NC 27217
MLS# 1190843Listed by: R&B LEGACY GROUP $29,900Active1.15 Acres
1449 Knollwood Drive, Burlington, NC 27217
MLS# 10115107Listed by: LISTWITHFREEDOM.COM $1,195,000Active4 beds 4 baths
1150 Lochshire Drive, Burlington, NC 27215
MLS# 1189687Listed by: EXP REALTY $218,500Pending3 beds 2 baths1,821 sq. ft.
316 Richmond Avenue, Burlington, NC 27217
MLS# 10115072Listed by: KELLER WILLIAMS CENTRAL $479,999Active4 beds 3 baths2,904 sq. ft.
3116 Longpine Road, Burlington, NC 27215
MLS# 10114626Listed by: EXP REALTY OF PIEDMONT NC LLC $219,000Active3 beds 1 baths
312 Somers Avenue, Burlington, NC 27215
MLS# 1189405Listed by: EXP REALTY $170,000Pending2 beds 1 baths758 sq. ft.
319 Cates Avenue, Burlington, NC 27215
MLS# 10114280Listed by: COLDWELL BANKER ADVANTAGE $247,000Active3 beds 3 baths
2006 Landon Court, Burlington, NC 27217
MLS# 1190291Listed by: OPENDOOR BROKERAGE LLC $253,500Pending4 beds 3 baths1,507 sq. ft.
1159 Kenross Drive, Burlington, NC 27215
MLS# 10113794Listed by: BERKSHIRE HATHAWAY HOMESERVICE $420,000Active2 beds 3 baths
1083 Talisker Way, Burlington, NC 27215
MLS# 1189142Listed by: KELLER WILLIAMS ONE $375,000Active3 beds 3 baths
403 Edinburgh Drive, Burlington, NC 27215
MLS# 1193452Listed by: BARBOUR & COMPANY
 $1,350,000Active4 beds 5 baths6,308 sq. ft.
1326 Lochshire Drive, Burlington, NC 27215
MLS# 10113308Listed by: THE INSIGHT GROUP $253,500Pending4 beds 3 baths
1159 Kenross Drive, Burlington, NC 27215
MLS# 1189334Listed by: BERKSHIRE HATHAWAY HOMESERVICES YOST & LITTLE REALTY $250,000Pending3 beds 3 baths1,241 sq. ft.
1708 Longshadow Drive, Burlington, NC 27217
MLS# 10111860Listed by: PAULETTE SIMS REALTY LLC $225,000Active2 beds 1 baths
1510 W Davis Street, Burlington, NC 27215
MLS# 1188834Listed by: MOVIL REALTY $225,000Active3 beds 2 baths
625 N Mebane Street, Burlington, NC 27217
MLS# 1188771Listed by: ELEVATION REALTY $271,999Active3 beds 3 baths
1042 Pinnix Loop, Burlington, NC 27217
MLS# 1188812Listed by: RE/MAX DIAMOND REALTY $264,999Active3 beds 2 baths
1035 Pinnix Loop, Burlington, NC 27217
MLS# 1188815Listed by: RE/MAX DIAMOND REALTY $249,999Pending2 beds 2 baths
1015 Pinnix Loop, Burlington, NC 27217
MLS# 1188816Listed by: RE/MAX DIAMOND REALTY $444,900Active3 beds 3 baths
480 Whitt Avenue, Burlington, NC 27215
MLS# 1188421Listed by: EXP REALTY $585,000Active4 beds 4 baths
2228 Walker Avenue, Burlington, NC 27215
MLS# 1188453Listed by: PATE REAL ESTATE $410,000Active4 beds 3 baths2,668 sq. ft.
617 Fountain Place, Burlington, NC 27215
MLS# 10110618Listed by: JONES REALTY GROUP $510,433Active3 beds 2 baths2,079 sq. ft.
1247 Talisker Way #47, Burlington, NC 27215
MLS# 10109961Listed by: KEYSTONE REALTY GROUP, INC. $510,433Active3 beds 2 baths
1247 Talisker Way, Burlington, NC 27215
MLS# 1188196Listed by: KEYSTONE REALTY GROUP $609,990Active4 beds 4 baths
1077 Tulloch Court, Burlington, NC 27215
MLS# 1188129Listed by: KEYSTONE REALTY GROUP $339,000Active4 beds 3 baths1,453 sq. ft.
1907 Wilkins Street, Burlington, NC 27217
MLS# 10108580Listed by: 360 REALTY $279,999Active3 beds 3 baths
1029 Pinnix Loop, Burlington, NC 27217
MLS# 1187410Listed by: RE/MAX DIAMOND REALTY $220,000Pending3 beds 2 baths
1016 Rauhut Street, Burlington, NC 27217
MLS# 1186255Listed by: KELLER WILLIAMS CENTRAL $225,000Active-- beds -- baths
511 Cameron Street, Burlington, NC 27215
MLS# 1186546Listed by: KELLER WILLIAMS CENTRAL $244,500Pending2 beds 2 baths
2129 Wrenn Street, Burlington, NC 27215
MLS# 1186137Listed by: LOCAL TO COASTAL REALTY, INC $599,900Active6 beds 3 baths
1926 Downing Drive, Burlington, NC 27215
MLS# 1195315Listed by: BARBOUR & COMPANY $399,900Active3 beds 2 baths
1229 Lawndale Road, Graham, NC 27253
MLS# 1185826Listed by: RE/MAX DIAMOND REALTY $319,900Pending4 beds 2 baths1,553 sq. ft.
1709 Hawthorne Lane Lane, Burlington, NC 27215
MLS# 10104547Listed by: EXP REALTY LLC $249,500Active4 beds 3 baths
1144 Kenross Drive, Burlington, NC 27215
MLS# 1184189Listed by: PARAGON HOME PARTNERS LLC $445,000Pending3 beds 3 baths
1732 Edgewood Avenue, Burlington, NC 27215-5404
MLS# 1184534Listed by: KELLER WILLIAMS CENTRAL $264,000Active3 beds 2 baths
1181 Flora Avenue, Burlington, NC 27217
MLS# 1183216Listed by: EXP REALTY $614,990Active4 beds 4 baths
1089 Tulloch Court, Burlington, NC 27215
MLS# 1184120Listed by: KEYSTONE REALTY GROUP $349,000Active6 beds 2 baths
424 Camp Road, Burlington, NC 27217
MLS# 1182312Listed by: KELLER WILLIAMS CENTRAL $349,000Active6 beds 2 baths3,205 sq. ft.
424 Camp Road, Burlington, NC 27217
MLS# 10099621Listed by: KELLER WILLIAMS CENTRAL $225,000Active3 beds 1 baths1,339 sq. ft.
780 Indian Village Trail, Burlington, NC 27217
MLS# 10098617Listed by: FAIRCLOTH INVESTMENT REALTY LLC $339,990Active2 beds 3 baths1,788 sq. ft.
1033 Talisker Way #16, Burlington, NC 27215
MLS# 10095749Listed by: KEYSTONE REALTY GROUP, INC. $290,000Active3 beds 2 baths1,380 sq. ft.
409 S Flanner St Street, Burlington, NC 27215
MLS# 10095782Listed by: 1800 REAL ESTATE, INC. $290,000Active2 beds 2 baths1,254 sq. ft.
1917 Tucker Street, Burlington, NC 27215
MLS# 10133349Listed by: WINLAND REALTY, LLC $595,000Pending3 beds 4 baths
1217 Aycock Avenue, Burlington, NC 27215
MLS# 1180655Listed by: KELLER WILLIAMS CENTRAL $363,310Active4 beds 3 baths
258 Plains Drive, Burlington, NC 27217
MLS# 1180952Listed by: KEYSTONE REALTY GROUP $339,990Active2 beds 3 baths
1033 Talisker Way, Burlington, NC 27215
MLS# 1180772Listed by: KEYSTONE REALTY GROUP $310,000Pending3 beds 3 baths1,405 sq. ft.
1303 Cherry Drive, Burlington, NC 27215
MLS# 10092502Listed by: FAB REAL ESTATE SERVICES, LLC
Local realty services provided by:CENTURY 21 Total Real Estate Solutions, CENTURY 21 The Realty Group, CENTURY 21 First Choice Realty
2025 Triad MLS, Inc. All rights reserved. IDX information is provided exclusively for personal, non-commercial use, and may not be used for any purpose other than to identify prospective properties consumers may be interested in purchasing. Information is deemed reliable but not guaranteed. This site will be monitored for ‘scraping’ and any use of search facilities of data on the site other than by potential buyers/sellers is prohibited. All Sale data is for informational purposes only and is not an indication of a market analysis or appraisal. Properties marked with the Triad MLS, Inc. icon are provided courtesy of the Triad MLS, Inc.’s, Internet Data Exchange Database.
Listings marked with a Doorify MLS icon are provided courtesy of the Doorify MLS, of North Carolina, Internet Data Exchange Database. Brokers make an effort to deliver accurate information, but buyers should independently verify any information on which they will rely in a transaction. The listing broker shall not be responsible for any typographical errors, misinformation, or misprints, and they shall be held totally harmless from any damages arising from reliance upon this data. This data is provided exclusively for consumers’ personal, non-commercial use. Copyright 2025 Doorify MLS of North Carolina. All rights reserved.
Listings courtesy of Canopy MLS as distributed by MLS GRID. Copyright 2021 Canopy MLS. All rights reserved. Canopy MLS, provides content displayed here (“provided content”) on an “as is” basis and makes no representations or warranties regarding the provided content, including, but not limited to those of non-infringement, timeliness, accuracy, or completeness. Individuals and companies using information presented are responsible for verification and validation of information they utilize and present to their customers and clients. Canopy MLS will not be liable for any damage or loss resulting from use of the provided content or the products available through Portals, IDX, VOW, and/or Syndication. Recipients of this information shall not resell, redistribute, reproduce, modify, or otherwise copy any portion thereof without the expressed written consent of Canopy MLS.
Neighborhoods near Burlington, NC
Zip codes near Burlington, NC
- 27214 properties for sale
- 27215 properties for sale
- 27217 properties for sale
- 27233 properties for sale
- 27243 properties for sale
- 27244 properties for sale
- 27249 properties for sale
- 27253 properties for sale
- 27258 properties for sale
- 27283 properties for sale
- 27298 properties for sale
- 27301 properties for sale
- 27302 properties for sale
- 27340 properties for sale
- 27349 properties for sale
- 27377 properties for sale
- 27401 properties for sale
- 27405 properties for sale
- 27406 properties for sale
- 27516 properties for sale
Popular searches near Burlington, NC
- 10, Melville properties for sale
- 12, Burlington properties for sale
- 13, Haw River properties for sale
- 2, Coble properties for sale
- 3, Boone Station properties for sale
- 4, Morton properties for sale
- 5, Faucette properties for sale
- 6, Graham properties for sale
- 7, Albright properties for sale
- Alamance properties for sale
- Altamahaw properties for sale
- Elon properties for sale
- Gibsonville properties for sale
- Glen Raven properties for sale
- Graham properties for sale
- Green Level properties for sale
- Haw River properties for sale
- Rock Creek properties for sale
- Swepsonville properties for sale
- Whitsett properties for sale
©2025 Century 21 Real Estate LLC. All rights reserved. CENTURY 21®, the CENTURY 21 Logo and C21® are service marks owned by Century 21 Real Estate LLC. Century 21 Real Estate LLC fully supports the principles of the Fair Housing Act and the Equal Opportunity Act. Each office is independently owned and operated. Listing information is deemed reliable but not guaranteed accurate.
©2025 Century 21 Real Estate LLC. All rights reserved. CENTURY 21®, the CENTURY 21 Logo and C21® are service marks owned by Century 21 Real Estate LLC. Century 21 Real Estate LLC fully supports the principles of the Fair Housing Act and the Equal Opportunity Act. Each office is independently owned and operated. Listing information is deemed reliable but not guaranteed accurate.