- Airline, Oklahoma City homes for sale
- Airpark, Oklahoma City homes for sale
- Capitol Hill, Oklahoma City homes for sale
- Core to Shore District, Oklahoma City homes for sale
- Draper Park, Oklahoma City homes for sale
- Hathaway Heights, Oklahoma City homes for sale
- Heronville, Oklahoma City homes for sale
- Highlander Community South, Oklahoma City homes for sale
- Hillcrest, Oklahoma City homes for sale
- Jackson, Oklahoma City homes for sale
- Mayridge, Oklahoma City homes for sale
- Oklahoma National Stockyards, Oklahoma City homes for sale
- Rancho Village, Oklahoma City homes for sale
- Rockwood, Oklahoma City homes for sale
- Shidler-Wheeler, Oklahoma City homes for sale
- Shields-Davis, Oklahoma City homes for sale
- Shields South, Oklahoma City homes for sale
- South Walker, Oklahoma City homes for sale
- Southern Hills, Oklahoma City homes for sale
- Southern Oaks, Oklahoma City homes for sale
Campbell Acres, Oklahoma City, OK - homes for sale
6 of 6 results displayed
- New
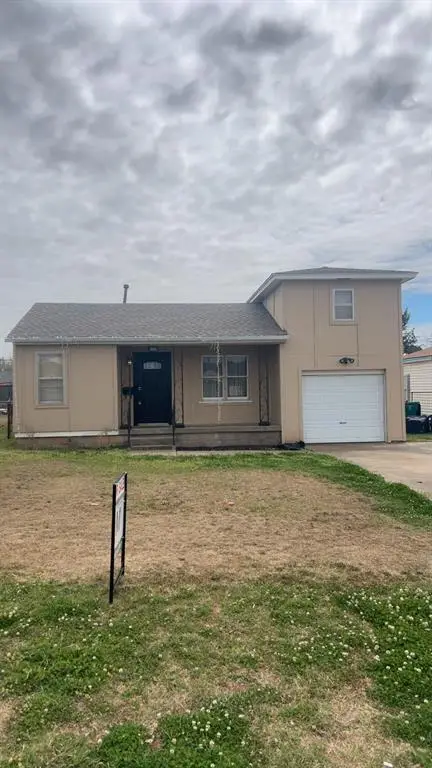 $125,000Active3 beds 2 baths1,124 sq. ft.
1528 SW 45th Street, Oklahoma City, OK 73119
MLS# 1218779Listed by: MELROSE REALTY LLC  $165,000Active3 beds 1 baths969 sq. ft.
1321 SW 46th Street, Oklahoma City, OK 73119
MLS# 1216567Listed by: METRO FIRST REALTY GROUP $160,000Active2 beds 1 baths720 sq. ft.
1338 South Drive, Oklahoma City, OK 73119
MLS# 1216627Listed by: LIME REALTY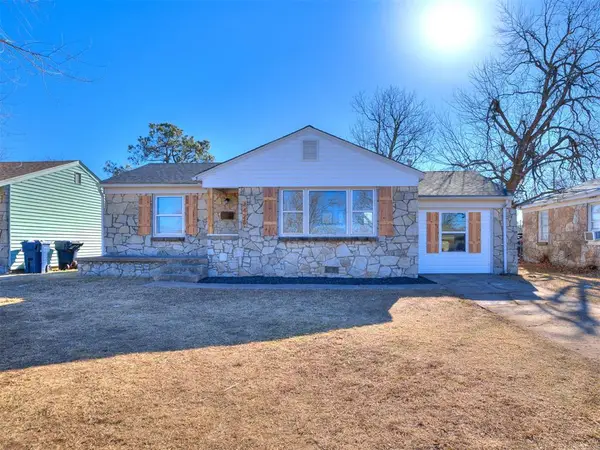 $144,900Active3 beds 1 baths992 sq. ft.
1428 SW 44th Street, Oklahoma City, OK 73119
MLS# 1212118Listed by: OK FLAT FEE REALTY $175,900Pending3 beds 1 baths1,107 sq. ft.
1448 Lafayette Drive, Oklahoma City, OK 73119
MLS# 1200106Listed by: CROSSLAND REAL ESTATE $184,333Active4 beds 2 baths1,760 sq. ft.
1545 SW 45th Street, Oklahoma City, OK 73119
MLS# 1134004Listed by: LIONSHEAD PROPERTY MANAGEMENT
Local realty services provided by:CENTURY 21 Altus Prestige Realty
Popular neighborhoods near Campbell Acres, Oklahoma City, OK
Zip codes near Campbell Acres, Oklahoma City, OK
- 73102 homes for sale
- 73103 homes for sale
- 73104 homes for sale
- 73106 homes for sale
- 73107 homes for sale
- 73108 homes for sale
- 73109 homes for sale
- 73115 homes for sale
- 73117 homes for sale
- 73119 homes for sale
- 73129 homes for sale
- 73135 homes for sale
- 73139 homes for sale
- 73149 homes for sale
- 73159 homes for sale
- 73160 homes for sale
- 73169 homes for sale
- 73170 homes for sale
- 73173 homes for sale
- 73179 homes for sale
Counties near Campbell Acres, Oklahoma City, OK
- Blaine County homes for sale
- Caddo County homes for sale
- Canadian County homes for sale
- Cleveland County homes for sale
- Garfield County homes for sale
- Garvin County homes for sale
- Grady County homes for sale
- Kingfisher County homes for sale
- Lincoln County homes for sale
- Logan County homes for sale
- McClain County homes for sale
- Murray County homes for sale
- Noble County homes for sale
- Okfuskee County homes for sale
- Oklahoma County homes for sale
- Payne County homes for sale
- Pontotoc County homes for sale
- Pottawatomie County homes for sale
- Seminole County homes for sale
- Stephens County homes for sale
Protect your home and budget from life's surprises with an Assurant Home Warranty, backed by a partner that supports you through every step of homeownership. Explore Plans.
©2026 Century 21 Real Estate LLC. All rights reserved. CENTURY 21®, the CENTURY 21 Logo and C21® are service marks owned by Century 21 Real Estate LLC. Century 21 Real Estate LLC fully supports the principles of the Fair Housing Act and the Equal Opportunity Act. Each office is independently owned and operated. Listing information is deemed reliable but not guaranteed accurate.