- Arnett Benson, Lubbock homes for sale
- Blue Sky, Lubbock homes for sale
- Bozeman Heights, Lubbock homes for sale
- Chapel Hill, Lubbock homes for sale
- City View, Amarillo homes for sale
- Clayton - Carter, Lubbock homes for sale
- Hunsley Hills, Canyon homes for sale
- Jackson-Mahon, Lubbock homes for sale
- North By Northwest, Lubbock homes for sale
- North Overton, Lubbock homes for sale
- Parkway - Cherry Point, Lubbock homes for sale
- Pleasant Ridge, Lubbock homes for sale
- Plemons Eakle Historic District, Amarillo homes for sale
- Shadow Hills, Lubbock homes for sale
- Skyview, Lubbock homes for sale
- South Georgia, Amarillo homes for sale
- Westchester, Lubbock homes for sale
- Westchester Park, Lubbock homes for sale
- Whisperwood, Lubbock homes for sale
- Wilshire Park, Lubbock homes for sale
Canyon, TX - homes for sale
9 of 9 results displayed
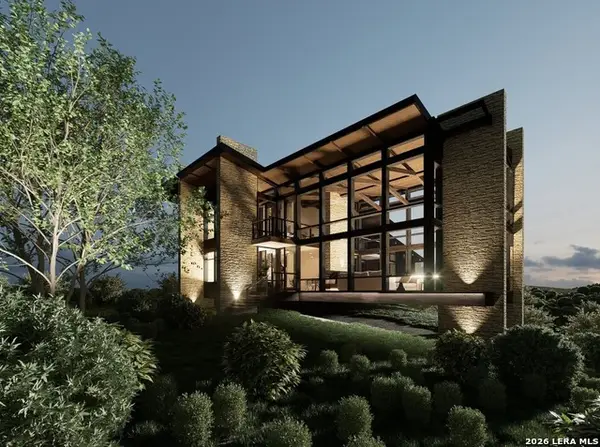 $2,068,000Active3 beds 3 baths
LOT 11 Canyon Rim, Helotes, TX 78023
MLS# 1941182Listed by: COLDWELL BANKER D'ANN HARPER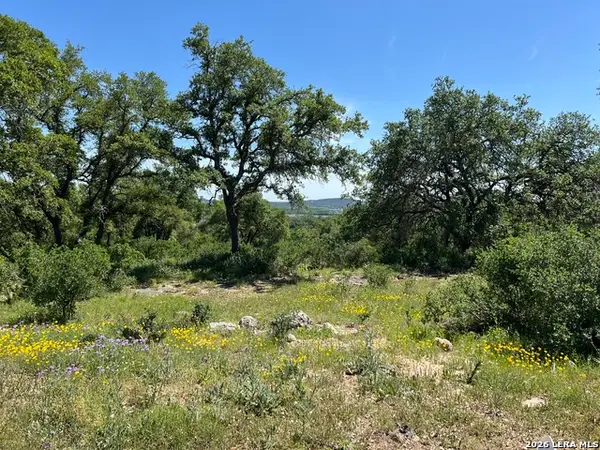 $168,000Active3.01 Acres
PHASE 6 LOT 11 Canyon Rim, Helotes, TX 78023
MLS# 1923235Listed by: COLDWELL BANKER D'ANN HARPER $147,000Active3.01 Acres
LOT 12 Canyon Rim, Helotes, TX 78023
MLS# 1938173Listed by: KELLER WILLIAMS LEGACY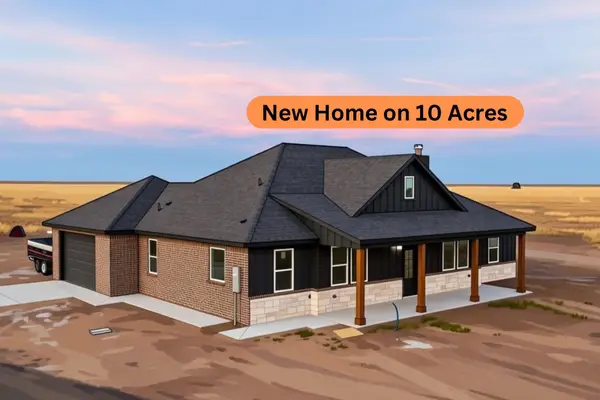 $445,900Active4 beds 3 baths1,944 sq. ft.
0 City Lake Road, Canyon, TX 79015
MLS# 21153149Listed by: FATHOM REALTY LLC $375,000Pending3 beds 2 baths2,117 sq. ft.
31 Canyon E Parkway, Canyon, TX 79015
MLS# 202564563Listed by: ROCKONE REALTY, LLC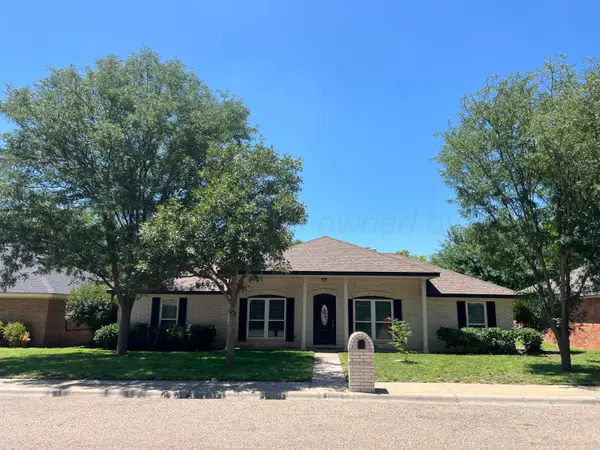 $290,000Pending3 beds 2 baths1,808 sq. ft.
1006 Santa Fe Trail, Canyon, TX 79015-5004
MLS# 25-6843Listed by: FRENCH AND CO., REALTORS $339,000Pending3 beds 2 baths1,758 sq. ft.
44 Faith Step Lane, Canyon, TX 79015
MLS# 25-6096Listed by: FATHOM REALTY, LLC $390,700Pending4 beds 2 baths2,114 sq. ft.
10 Spring Canyon Parkway, Canyon, TX 79015-1724
MLS# 25-3806Listed by: ROCKONE REALTY, LLC $556,900Pending4 beds 3 baths2,575 sq. ft.
14 Thicket Drive, Canyon, TX 79015
MLS# 25-3072Listed by: LYONS REALTY
Local realty services provided by:CENTURY 21 Judge Fite Company, CENTURY 21 Middleton, CENTURY 21 Kearney & Associates,
Information provided, in part, by North Texas Real Estate Information Systems, Inc. Last Updated March 31, 2026 Listings with the NTREIS logo are listed by brokerages other than CENTURY 21 Middleton.
Neighborhoods near Canyon, TX
Zip codes near Canyon, TX
- 79007 homes for sale
- 79015 homes for sale
- 79019 homes for sale
- 79031 homes for sale
- 79036 homes for sale
- 79041 homes for sale
- 79045 homes for sale
- 79064 homes for sale
- 79072 homes for sale
- 79088 homes for sale
- 79102 homes for sale
- 79106 homes for sale
- 79107 homes for sale
- 79109 homes for sale
- 79110 homes for sale
- 79118 homes for sale
- 79119 homes for sale
- 79124 homes for sale
- 79226 homes for sale
- 79241 homes for sale
Popular searches near Canyon, TX
- Amarillo homes for sale
- Amarillo homes for sale
- Borger homes for sale
- Canadian River Breaks homes for sale
- Claude homes for sale
- Farwell-Bovina homes for sale
- Fritch homes for sale
- Hale Center homes for sale
- Hereford homes for sale
- Hereford East homes for sale
- Howardwick homes for sale
- Lockney homes for sale
- Muleshoe homes for sale
- Olton homes for sale
- Pampa homes for sale
- Plainview homes for sale
- Sudan-Amherst homes for sale
- Timbercreek Canyon homes for sale
- Tulia homes for sale
- Turkey homes for sale
Protect your home and budget from life's surprises with an Assurant Home Warranty, backed by a partner that supports you through every step of homeownership. Explore Plans.
©2026 Century 21 Real Estate LLC. All rights reserved. CENTURY 21®, the CENTURY 21 Logo and C21® are service marks owned by Century 21 Real Estate LLC. Century 21 Real Estate LLC fully supports the principles of the Fair Housing Act and the Equal Opportunity Act. Each office is independently owned and operated. Listing information is deemed reliable but not guaranteed accurate.