- Capitol Hill, Little Rock homes for sale
- Downtown Little Rock, Little Rock homes for sale
- Dunbar School, Little Rock homes for sale
- Fair Park, Little Rock homes for sale
- Forest Hills, Little Rock homes for sale
- Governor's Mansion, Little Rock homes for sale
- Heights, Little Rock homes for sale
- Hillcrest, Little Rock homes for sale
- Hope, Little Rock homes for sale
- Love, Little Rock homes for sale
- Midtown, Little Rock homes for sale
- Oak Forest, Little Rock homes for sale
- Piedmont, Little Rock homes for sale
- Pine To Woodrow, Little Rock homes for sale
- Pulaski Heights, Little Rock homes for sale
- Quapaw Quarter, Little Rock homes for sale
- River Market, Little Rock homes for sale
- South End, Little Rock homes for sale
- Stephens Area Faith, Little Rock homes for sale
- Wright Avenue, Little Rock homes for sale
Capitol View, Little Rock, AR - homes for sale
3 of 3 results displayed
- New
 $238,000Active-- beds -- baths1,779 sq. ft.
304-306 Rosetta Street, Little Rock, AR 72205
MLS# 26011454Listed by: JANET JONES COMPANY 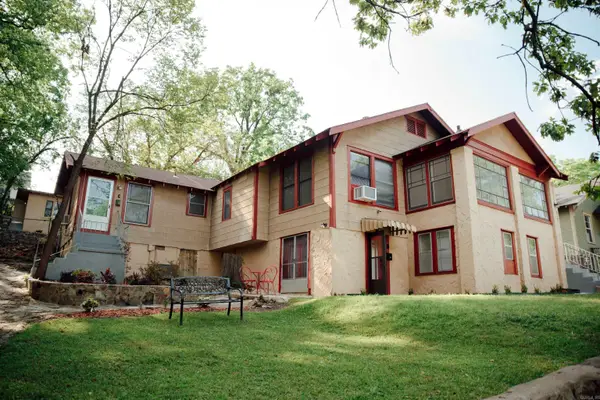 $359,900Active-- beds -- baths3,000 sq. ft.
312 S Barton Street, Little Rock, AR 72205
MLS# 26004402Listed by: JANET JONES COMPANY $210,000Active-- beds -- baths2,604 sq. ft.
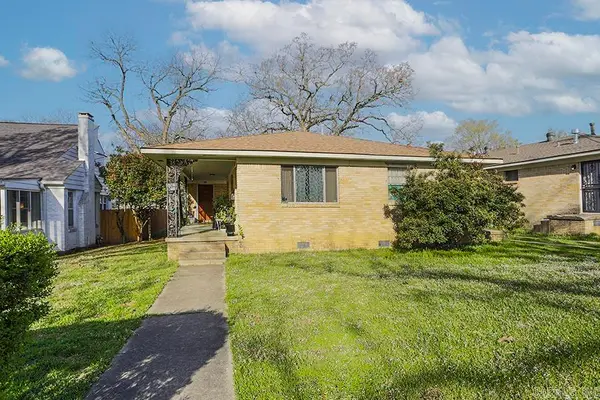
100 Dennison Street, Little Rock, AR 72205
MLS# 26003878Listed by: MID SOUTH REALTY
Local realty services provided by:CENTURY 21 Perry Real Estate
Popular neighborhoods near Capitol View, Little Rock, AR
Zip codes near Capitol View, Little Rock, AR
- 72103 homes for sale
- 72113 homes for sale
- 72114 homes for sale
- 72116 homes for sale
- 72117 homes for sale
- 72118 homes for sale
- 72120 homes for sale
- 72199 homes for sale
- 72201 homes for sale
- 72202 homes for sale
- 72204 homes for sale
- 72205 homes for sale
- 72206 homes for sale
- 72207 homes for sale
- 72209 homes for sale
- 72210 homes for sale
- 72211 homes for sale
- 72212 homes for sale
- 72223 homes for sale
- 72227 homes for sale
Counties near Capitol View, Little Rock, AR
- Arkansas County homes for sale
- Cleburne County homes for sale
- Cleveland County homes for sale
- Conway County homes for sale
- Dallas County homes for sale
- Faulkner County homes for sale
- Garland County homes for sale
- Grant County homes for sale
- Hot Spring County homes for sale
- Jefferson County homes for sale
- Lincoln County homes for sale
- Lonoke County homes for sale
- Monroe County homes for sale
- Perry County homes for sale
- Pope County homes for sale
- Prairie County homes for sale
- Pulaski County homes for sale
- Saline County homes for sale
- Van Buren County homes for sale
- White County homes for sale
Protect your home and budget from life's surprises with an Assurant Home Warranty, backed by a partner that supports you through every step of homeownership. Explore Plans.
©2026 Century 21 Real Estate LLC. All rights reserved. CENTURY 21®, the CENTURY 21 Logo and C21® are service marks owned by Century 21 Real Estate LLC. Century 21 Real Estate LLC fully supports the principles of the Fair Housing Act and the Equal Opportunity Act. Each office is independently owned and operated. Listing information is deemed reliable but not guaranteed accurate.