- Bonsall homes for sale
- Camp Pendleton homes for sale
- Cardiff homes for sale
- Cardiff by the Sea homes for sale
- Carlsbad homes for sale
- Del Mar homes for sale
- Elfin Forest homes for sale
- Encinitas homes for sale
- Escondido homes for sale
- Fairbanks Ranch homes for sale
- Fallbrook homes for sale
- Harmony Grove homes for sale
- Hidden Meadows homes for sale
- Lake San Marcos homes for sale
- Oceanside homes for sale
- Oceanside-Escondido homes for sale
- Rancho Santa Fe homes for sale
- San Marcos homes for sale
- Solana Beach homes for sale
- Vista homes for sale
92008, CA - homes for sale
135 of 135 results displayed
- Coming Soon
 $2,500,000Coming Soon2 beds 2 baths
367 Beech Ave, Carlsbad, CA 92008
MLS# NDP2603048Listed by: COLDWELL BANKER REALTY - Open Fri, 4 to 6pmNew
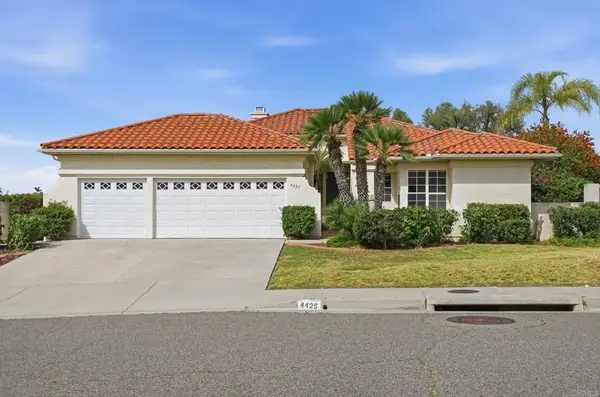 $1,675,000Active4 beds 3 baths2,033 sq. ft.
4425 Sunnyhill Drive, Carlsbad, CA 92008
MLS# NDP2603021Listed by: GOLDEN KEY PROPERTIES, INC. - New
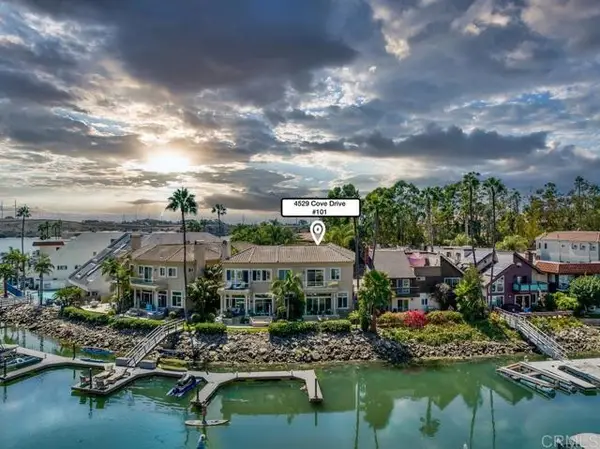 $2,199,000Active4 beds 4 baths2,220 sq. ft.
4529 Cove Drive #101, Carlsbad, CA 92008
MLS# CRNDP2602569Listed by: PACIFIC SUN PROPERTIES - New
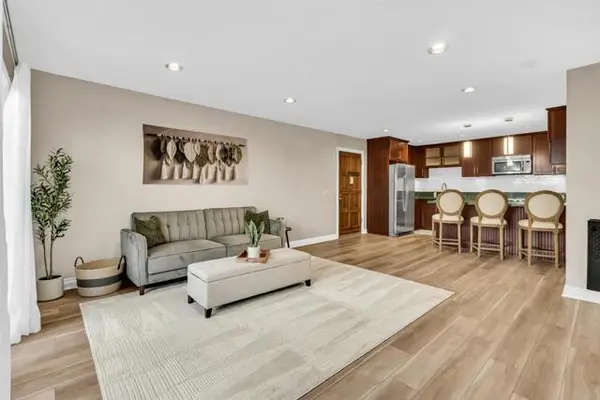
 $2,099,000Active4 beds 3 baths2,502 sq. ft.
4860 Park Drive, Carlsbad, CA 92008
MLS# NDP2603016Listed by: COMPASS - Open Fri, 2 to 5pmNew
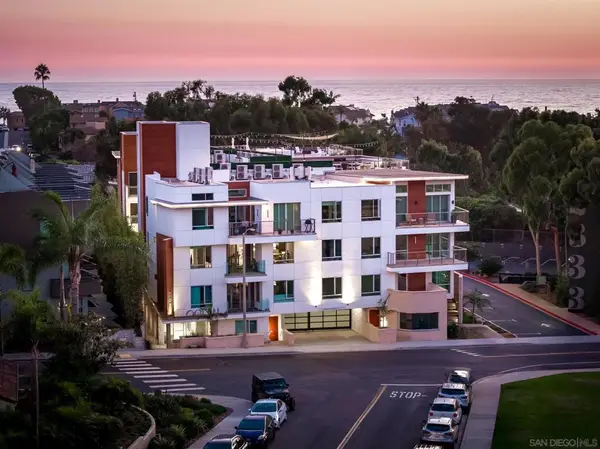 $1,999,900Active2 beds 3 baths2,030 sq. ft.
2501 State Street #205, Carlsbad, CA 92008
MLS# 260007452SDListed by: COMPASS - New
 $519,000Active2 beds 1 baths810 sq. ft.
2382 Hosp Way #143, Carlsbad, CA 92008
MLS# CRNDP2602968Listed by: GILLESPIE REALTY, INC. - Coming Soon
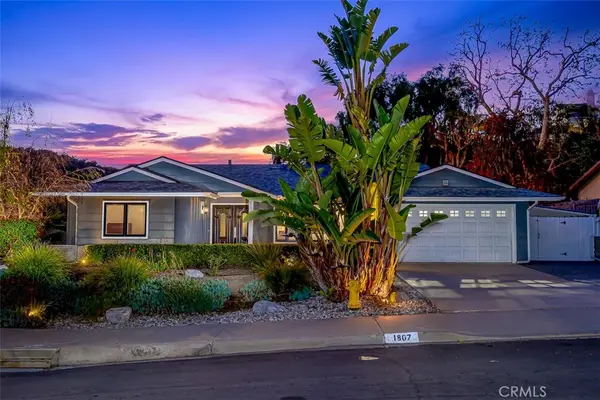 $2,499,000Coming Soon4 beds 3 baths
1807 Valencia, Carlsbad, CA 92008
MLS# OC26063827Listed by: COMPASS - Coming SoonOpen Sat, 11am to 2pm
 $1,879,000Coming Soon4 beds 4 baths
4862 Sevilla Way, Carlsbad, CA 92008
MLS# TR26067184Listed by: HOMECOIN.COM - Coming Soon
 $2,249,000Coming Soon2 beds 2 baths
4619 Park Drive, Carlsbad, CA 92008
MLS# NDP2602958Listed by: THREE LAGOONS REALTY - New
 $1,960,000Active4 beds 2 baths1,498 sq. ft.
2537 Davis Avenue, Carlsbad, CA 92008
MLS# PTP2602350Listed by: COLDWELL BANKER WEST - New
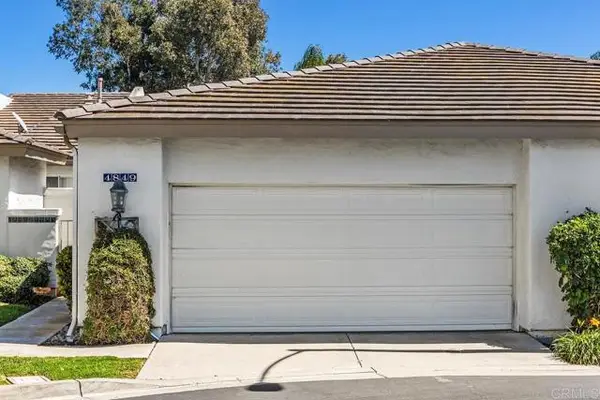 $885,000Active2 beds 2 baths1,210 sq. ft.
4849 Flying Cloud Way, Carlsbad, CA 92008
MLS# CRNDP2602947Listed by: WATERS END PROPERTIES - New
 $2,450,450Active4 beds 4 baths2,157 sq. ft.
1890 Basswood Avenue, Carlsbad, CA 92008
MLS# CRNDP2602944Listed by: COMPASS - New
 $2,450,450Active4 beds 4 baths2,157 sq. ft.
1890 Basswood Avenue, Carlsbad, CA 92008
MLS# NDP2602944Listed by: COMPASS - Open Fri, 3 to 5:30pmNew
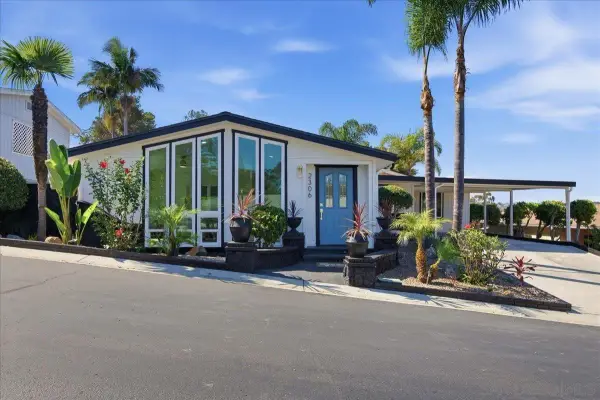 $849,999Active3 beds 2 baths1,812 sq. ft.
2306 Bryant, Carlsbad, CA 92008
MLS# 260007330Listed by: REAL BROKER - New
 $720,000Active2 beds 2 baths1,154 sq. ft.
832 Kalpati Circle #D, Carlsbad, CA 92008
MLS# CRNDP2602900Listed by: TOP TIER PROPERTY MANAGEMENT - Open Sat, 12 to 3pmNew
 $5,900,000Active6 beds 6 baths4,409 sq. ft.
135 Redwood, Carlsbad, CA 92008
MLS# PW26066248Listed by: JESSE CARLSON, BROKER - New
 $720,000Active2 beds 2 baths1,154 sq. ft.
832 Kalpati Circle #D, Carlsbad, CA 92008
MLS# NDP2602900Listed by: TOP TIER PROPERTY MANAGEMENT - New
 $1,995,000Active3 beds 4 baths2,373 sq. ft.
1351 Forest Avenue, Carlsbad, CA 92008
MLS# CRSR26029355Listed by: PINNACLE ESTATE PROPERTIES, INC. - New
 $1,595,000Active4 beds 2 baths1,584 sq. ft.
3960 Park Dr, Carlsbad, CA 92008
MLS# CROC26064871Listed by: COMPASS - Open Sat, 11am to 1pmNew
 $1,350,000Active2 beds 3 baths1,740 sq. ft.
4817 Windjammer Way, Carlsbad, CA 92008
MLS# 260006860Listed by: COMPASS - New
 $1,649,999Active3 beds 3 baths1,870 sq. ft.
2435 Garfield St, Carlsbad, CA 92008
MLS# CRNDP2602759Listed by: FIRST TEAM REAL ESTATE - New
 $1,649,999Active3 beds 3 baths1,870 sq. ft.
2435 Garfield St, Carlsbad, CA 92008
MLS# NDP2602759Listed by: FIRST TEAM REAL ESTATE - New
 $1,759,000Active3 beds 3 baths2,286 sq. ft.
4747 Bryce Circle, Carlsbad, CA 92008
MLS# NDP2602752Listed by: WISDOM PROPERTIES - New
 $1,159,990Active4 beds 4 baths1,994 sq. ft.
2522 Thyme Way, Carlsbad, CA 92008
MLS# NDP2602715Listed by: KB HOME SALES - SO CAL, INC. 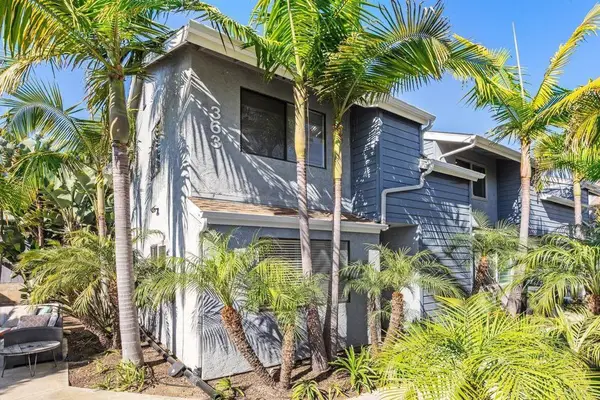 $965,000Pending2 beds 3 baths1,006 sq. ft.
363 Hemlock Avenue #C, Carlsbad, CA 92008
MLS# NDP2602659Listed by: COLDWELL BANKER REALTY $1,495,000Active-- beds -- baths825 sq. ft.
3258 Tyler Street, Carlsbad, CA 92008
MLS# CRNDP2602456Listed by: TURNER REAL ESTATE $1,849,000Pending4 beds 2 baths1,704 sq. ft.
1860 Valencia Avenue, Carlsbad, CA 92008
MLS# CRNDP2602558Listed by: NORTH COMPASS REALTY $2,795,000Active6 beds 7 baths4,051 sq. ft.
3780 Highland Dr., Carlsbad, CA 92008
MLS# NDP2602529Listed by: COMPASS $1,199,990Active4 beds 4 baths1,994 sq. ft.
4942 Spirea Way, Carlsbad, CA 92008
MLS# NDP2602562Listed by: KB HOME SALES - SO CAL, INC. $3,800,000Active6 beds -- baths2,551 sq. ft.
3379 Roosevelt St. Street, Carlsbad, CA 92008
MLS# CRNDP2602381Listed by: FIRST TEAM REAL ESTATE $5,995,000Active9 beds 6 baths4,936 sq. ft.
5140 Los Robles Dr, Carlsbad, CA 92008
MLS# 260006132Listed by: WHITEWATER CRE INC $1,795,000Active4 beds 2 baths1,826 sq. ft.
3880 Adams St, Carlsbad, CA 92008
MLS# 260005095Listed by: ZIMKIN REALTY $474,900Active1 beds 1 baths690 sq. ft.
2360 Hosp Way #331, Carlsbad, CA 92008
MLS# CRPTP2601916Listed by: CA-RES $1,699,000Active3 beds 2 baths1,514 sq. ft.
1733 Schooner Way, Carlsbad, CA 92008
MLS# CRNDP2602431Listed by: NUPACIFICA REALTY $1,400,000Pending3 beds 2 baths1,807 sq. ft.
4818 Refugio Avenue, Carlsbad, CA 92008
MLS# CRNDP2602428Listed by: KELLER WILLIAMS REALTY $500,000Pending2 beds 2 baths1,029 sq. ft.
2332 Hosp Way #207, Carlsbad, CA 92008
MLS# 260005913SDListed by: JEANIFY, INC $499,950Pending2 beds 1 baths810 sq. ft.
2336 Hosp Way #115, Carlsbad, CA 92008
MLS# 260005855SDListed by: REALTY DISCOUNT CORPORATION $2,489,000Active0.37 Acres
1115 Hoover Street, Carlsbad, CA 92008
MLS# CRIG26053411Listed by: KINETIC REAL ESTATE $2,500,000Active4 beds 5 baths3,504 sq. ft.
4390 Yuki Ln, Carlsbad, CA 92008
MLS# 260005867Listed by: EXP REALTY OF SOUTHERN CALIFORNIA, INC. $2,285,000Active0.38 Acres
4340 Adams Street, Carlsbad, CA 92008
MLS# IG26054522Listed by: KINETIC REAL ESTATE $2,070,000Pending4 beds 2 baths2,028 sq. ft.
3235 Donna Drive, Carlsbad, CA 92008
MLS# NDP2602147Listed by: ASCENT REAL ESTATE $2,285,000Active0.36 Acres
4332 Adams Street, Carlsbad, CA 92008
MLS# IG26052999Listed by: KINETIC REAL ESTATE $4,850,000Active4 beds 5 baths2,972 sq. ft.
270 Normandy Lane, Carlsbad, CA 92008
MLS# NDP2602313Listed by: RINCON HOMES, INC. $2,195,000Active4 beds 3 baths2,502 sq. ft.
4860 Park Drive, Carlsbad, CA 92008
MLS# CRNDP2602252Listed by: COMPASS $998,000Active3 beds 4 baths1,688 sq. ft.
2586 Delphinium Lane, Carlsbad, CA 92008
MLS# NDP2602213Listed by: KB HOME SALES - SO CAL, INC. $2,750,000Active5 beds 4 baths3,187 sq. ft.
3736 Donna Court, Carlsbad, CA 92008
MLS# NDP2602083Listed by: SRG $1,849,888Active4 beds 3 baths2,159 sq. ft.
4623 Telescope Avenue, Carlsbad, CA 92008
MLS# CRNDP2602132Listed by: WILLIS ALLEN REAL ESTATE $1,199,000Active2 beds 2 baths1,206 sq. ft.
725 Grand Avenue, Carlsbad, CA 92008
MLS# NDP2602141Listed by: ERA RANCH & SEA REALTY $1,399,000Active2 beds 3 baths1,610 sq. ft.
543 Laguna Drive, Carlsbad, CA 92008
MLS# OC25280799Listed by: PACIFIC SOTHEBY'S INT'L REALTY $1,329,990Active4 beds 4 baths2,212 sq. ft.
2500 Thyme Way, Carlsbad, CA 92008
MLS# CRNDP2602077Listed by: KB HOME SALES - SO CAL, INC. $899,000Pending1 beds 1 baths600 sq. ft.
3080 Lincoln Street #12, Carlsbad, CA 92008
MLS# CRNDP2602030Listed by: HAUSTAY, INC $2,999,999Active3 beds 3 baths1,656 sq. ft.
965 Home Ave, Carlsbad, CA 92008
MLS# 260004959Listed by: COMPASS $2,999,999Active3 beds 3 baths1,656 sq. ft.
965 Home Ave, Carlsbad, CA 92008
MLS# 260004959SDListed by: COMPASS $1,299,000Active2 beds 2 baths1,210 sq. ft.
4847 Flying Cloud, Carlsbad, CA 92008
MLS# OC26044305Listed by: LTF REAL ESTATE SERVICES $1,975,000Pending4 beds 4 baths2,265 sq. ft.
318 Chinquapin Avenue, Carlsbad, CA 92008
MLS# CRNDP2601897Listed by: RINCON HOMES, INC. $2,025,000Active2 beds 4 baths2,147 sq. ft.
2563 State Street, Carlsbad, CA 92008
MLS# CRNDP2601959Listed by: REAL BROKER $1,900,000Active2 beds 3 baths1,370 sq. ft.
175 Maple Ave #4, Carlsbad, CA 92008
MLS# 260004700Listed by: LPT REALTY,INC $1,900,000Active2 beds 3 baths1,370 sq. ft.
175 Maple Ave #4, Carlsbad, CA 92008
MLS# 260004700SDListed by: LPT REALTY,INC $3,699,000Active5 beds 4 baths2,275 sq. ft.
4627 Park Dr, Carlsbad, CA 92008
MLS# 260004367Listed by: COMPASS $3,995,000Active10 beds 6 baths5,044 sq. ft.
3177 Lincoln St, Carlsbad, CA 92008
MLS# 260004235Listed by: APARTMENT REALTY GROUP (ARG) $815,000Pending2 beds 3 baths1,502 sq. ft.
4008 Aguila St #I, Carlsbad, CA 92008
MLS# 260004141SDListed by: REDFIN CORPORATION $1,450,000Pending4 beds 2 baths1,652 sq. ft.
4809 Kelly Dr., Carlsbad, CA 92008
MLS# 260003991Listed by: COMPASS $919,000Active2 beds 3 baths1,502 sq. ft.
4011 Layang Layang Cir #F, Carlsbad, CA 92008
MLS# 260003855SDListed by: HOMESMART REALTY WEST $919,000Active2 beds 3 baths1,502 sq. ft.
4011 Layang Layang Cir #F, Carlsbad, CA 92008
MLS# 260003855Listed by: HOMESMART REALTY WEST $2,850,000Active4 beds -- baths1,522 sq. ft.
376 Acacia Drive, Carlsbad, CA 92008
MLS# CRNDP2601531Listed by: MARA REAL ESTATE $1,059,990Active3 beds 4 baths1,739 sq. ft.
2531 Delphinium Lane, Carlsbad, CA 92008
MLS# NDP2601495Listed by: KB HOME SALES - SO CAL, INC. $1,059,990Active3 beds 4 baths1,739 sq. ft.
2523 Delphinium Lane, Carlsbad, CA 92008
MLS# NDP2601496Listed by: KB HOME SALES - SO CAL, INC. $2,690,000Active2 beds 2 baths1,245 sq. ft.
5238 Carlsbad Boulevard, Carlsbad, CA 92008
MLS# NDP2601503Listed by: COLDWELL BANKER REALTY $1,110,990Active3 beds 4 baths1,739 sq. ft.
4600 Catmint Lane, Carlsbad, CA 92008
MLS# CRNDP2601494Listed by: KB HOME SALES - SO CAL, INC.- Open Sat, 1 to 3pm$3,278,000Active5 beds 4 baths2,788 sq. ft.
5303 Los Robles, Carlsbad, CA 92008
MLS# 260003471Listed by: COLDWELL BANKER REALTY  $479,000Active1 beds 1 baths690 sq. ft.
2360 Hosp Way, Carlsbad, CA 92008
MLS# PTP2601095Listed by: CA-RES $325,000Active0 Acres
0 Park, Carlsbad, CA 92008
MLS# PW26019531Listed by: KELLER WILLIAMS COASTAL PROP. $1,049,000Active2 beds 2 baths1,440 sq. ft.
4705 Marina, Carlsbad, CA 92008
MLS# NDP2601301Listed by: HOMESMART REALTY WEST $499,000Active2 beds 1 baths810 sq. ft.
2330 Hosp Way #202, Carlsbad, CA 92008
MLS# 260003181SDListed by: REDFIN CORPORATION $1,049,000Active2 beds 2 baths1,440 sq. ft.
4705 Marina #10, Carlsbad, CA 92008
MLS# NDP2601301Listed by: HOMESMART REALTY WEST $1,779,000Active3 beds 3 baths2,194 sq. ft.
4759 Bryce Circle, Carlsbad, CA 92008
MLS# NDP2601188Listed by: WISDOM PROPERTIES $439,000Active1 beds 1 baths690 sq. ft.
2380 Hosp Way #139, Carlsbad, CA 92008
MLS# 260002582SDListed by: COMPASS $1,700,000Active3 beds 3 baths2,014 sq. ft.
4556 Cove Drive, Carlsbad, CA 92008
MLS# CRNDP2601036Listed by: COMPASS $1,760,000Active-- beds -- baths
3630 Donna Drive, Carlsbad, CA 92008
MLS# NDP2602616Listed by: FIRST TEAM REAL ESTATE $1,760,000Active3 beds 2 baths1,611 sq. ft.
3630 Donna Drive, Carlsbad, CA 92008
MLS# NDP2601025Listed by: FIRST TEAM REAL ESTATE $1,899,000Active3 beds 4 baths2,329 sq. ft.
2648 State Street, Unit #e, Carlsbad, CA 92008
MLS# CRNDP2600988Listed by: DOUGLAS ELLIMAN OF CALIFORNIA $1,199,999Pending2 beds 3 baths1,392 sq. ft.
256 Juniper Ave #B6, Carlsbad, CA 92008
MLS# CRSW26019110Listed by: MOGUL REAL ESTATE $3,980,000Active3 beds 4 baths3,158 sq. ft.
150 Juniper Ave, Carlsbad, CA 92008
MLS# 260001765Listed by: COMPASS $2,700,000Active3 beds 3 baths2,539 sq. ft.
4235 Harrison Street, Carlsbad, CA 92008
MLS# NDP2600547Listed by: PACIFIC SOTHEBY'S INT'L REALTY $1,199,900Pending2 beds 2 baths1,240 sq. ft.
4747 Marina Dr #23, Carlsbad, CA 92008
MLS# 260001320Listed by: WINDERMERE DESERT PROPERTIES $1,399,000Active0.29 Acres
4874 Park Drive, Carlsbad, CA 92008
MLS# CRNDP2600375Listed by: COMPASS $3,599,000Active4 beds 3 baths3,415 sq. ft.
3354 Seacrest Drive, Carlsbad, CA 92008
MLS# NDP2600333Listed by: HOMESMART REALTY WEST $1,025,000Pending0.79 Acres
4269 Hillside Drive, Carlsbad, CA 92008
MLS# CRNDP2511605Listed by: COMPASS $2,025,000Active3 beds 2 baths1,102 sq. ft.
370 Tamarack Ave, Carlsbad, CA 92008
MLS# 250046281Listed by: EXP REALTY OF CALIFORNIA, INC. $1,229,990Pending4 beds 4 baths1,994 sq. ft.
2579 Elderberry Lane, Carlsbad, CA 92008
MLS# CRNDP2511351Listed by: KB HOME SALES - SO CAL, INC. $998,990Pending3 beds 4 baths1,688 sq. ft.
2559 Delphinium Lane, Carlsbad, CA 92008
MLS# CRNDP2511077Listed by: KB HOME SALES - SO CAL, INC. $849,000Active2 beds 3 baths1,463 sq. ft.
4020 Layang Layang Circle #C, Carlsbad, CA 92008
MLS# CRNDP2510995Listed by: DEL MAR REALTY ASSOC.,INC $2,625,000Active6 beds 6 baths3,811 sq. ft.
3747 Adams St, Carlsbad, CA 92008
MLS# 250044426Listed by: ACRE INVESTMENT REAL ESTATE $1,995,000Pending4 beds 4 baths2,265 sq. ft.
320 Chinquapin Avenue, Carlsbad, CA 92008
MLS# NDP2601953Listed by: RINCON HOMES, INC. $4,395,000Active4 beds 6 baths3,525 sq. ft.
2465 Garfield Street, Carlsbad, CA 92008
MLS# 260005988Listed by: SRG $1,978,000Pending3 beds 3 baths2,266 sq. ft.
4876 Park Dr., Carlsbad, CA 92008
MLS# NDP2510587Listed by: FIRST TEAM REAL ESTATE $1,069,990Active3 beds 4 baths1,739 sq. ft.
2541 Delphinium Lane, Carlsbad, CA 92008
MLS# CRNDP2510478Listed by: KB HOME SALES - SO CAL, INC. $6,795,000Active0.43 Acres
3056 Carlsbad Boulevard, Carlsbad, CA 92008
MLS# CRNDP2510447Listed by: LEE & ASSOCIATES $10,250,000Active6 beds 7 baths4,564 sq. ft.
2977 Ocean Street, Carlsbad, CA 92008
MLS# 250042739Listed by: COMPASS $10,250,000Active-- beds -- baths
2977 Ocean Street, Carlsbad, CA 92008
MLS# 250042739SDListed by: COMPASS $1,999,000Active2 beds 4 baths2,167 sq. ft.
2517 State Street, Carlsbad, CA 92008
MLS# NDP2510299Listed by: FIRST TEAM REAL ESTATE $449,000Active1 beds 1 baths690 sq. ft.
2336 Hosp Way #314, Carlsbad, CA 92008
MLS# CRNDP2602586Listed by: NORTH COMPASS REALTY $2,895,000Pending5 beds 4 baths3,665 sq. ft.
1199 Tamarack Ave, Carlsbad, CA 92008
MLS# NDP2509896Listed by: HILL REALTY GROUP $2,895,000Pending5 beds 4 baths3,665 sq. ft.
1199 Tamarack Ave, Carlsbad, CA 92008
MLS# NDP2509896Listed by: HILL REALTY GROUP $9,000,000Active0 Acres
0 Sunny Creek, Carlsbad, CA 92008
MLS# PI25230627Listed by: STEVEN LAWRENCE RELTH-BROKER $2,395,000Pending5 beds 3 baths3,038 sq. ft.
5077 Ashberry, Carlsbad, CA 92008
MLS# 250039530Listed by: COMPASS $1,249,990Active4 beds 4 baths2,070 sq. ft.
2536 Elderberry Lane, Carlsbad, CA 92008
MLS# NDP2511155Listed by: KB HOME SALES - SO CAL, INC. $1,349,000Active3 beds 3 baths1,870 sq. ft.
2829 Forest View Way, Carlsbad, CA 92008
MLS# 260004967Listed by: AMERICAN DREAMS REAL ESTATE $967,000Pending2 beds 1 baths728 sq. ft.
1271 Basswood Avenue, Carlsbad, CA 92008
MLS# CRNDP2508690Listed by: EAGLEVIEW REALTY $656,000Active3 beds 2 baths1,704 sq. ft.
2289 Bryant Drive, Carlsbad, CA 92008
MLS# PTP2506735Listed by: BALBOA REALTY $2,795,000Pending3 beds 2 baths1,474 sq. ft.
157 Maple Ave, Carlsbad, CA 92008
MLS# PTP2601940Listed by: NON LISTED OFFICE $3,689,000Pending3 beds 4 baths3,337 sq. ft.
1741 Bruce Rd, Carlsbad, CA 92008
MLS# NDP2507802Listed by: THE LUND TEAM, INC $1,179,990Pending4 beds 4 baths1,994 sq. ft.
2572 Elderberry Lane, Carlsbad, CA 92008
MLS# CRNDP2507624Listed by: KB HOME SALES - SO CAL, INC. $5,250,000Active3 beds 3 baths2,802 sq. ft.
2901 Ocean Street #3, Carlsbad, CA 92008
MLS# 250035096SDListed by: MCLAIN PROPERTIES $1,259,000Active2 beds 2 baths1,426 sq. ft.
4781 Argosy Lane, Carlsbad, CA 92008
MLS# CRNDP2601726Listed by: REALBLUE PROPERTIES $10,250,000Active6 beds 7 baths4,564 sq. ft.
2977 Ocean Street, Carlsbad, CA 92008
MLS# 250032918Listed by: COMPASS $16,200,000Active6 beds 8 baths5,285 sq. ft.
5143 Shore Drive, Carlsbad, CA 92008
MLS# 250032740Listed by: COMPASS $11,050,000Active-- beds -- baths5,935 sq. ft.
141-145 Cherry Ave, Carlsbad, CA 92008
MLS# 230009615Listed by: ACRE INVESTMENT REAL ESTATE $3,800,000Active1.39 Acres
0 Hoover Street, Carlsbad, CA 92008
MLS# OC25152630Listed by: COLDWELL BANKER ASSOC. BROKERS $1,899,000Active4 beds 4 baths2,520 sq. ft.
2336 Summerwind Place, Carlsbad, CA 92008
MLS# 225003546Listed by: COLDWELL BANKER REALTY $1,015,000Pending2 beds 2 baths1,450 sq. ft.
4025 Canario Street #142, Carlsbad, CA 92008
MLS# CRSW25151830Listed by: ABUNDANCE REAL ESTATE $10,250,000Active6 beds 7 baths4,564 sq. ft.
2977 Ocean Street, Carlsbad, CA 92008
MLS# 250032918SDListed by: COMPASS $16,200,000Active6 beds 8 baths5,285 sq. ft.
5143 Shore Drive, Carlsbad, CA 92008
MLS# 250032740SDListed by: COMPASS $1,125,000Pending2 beds 2 baths1,312 sq. ft.
2535 Jefferson Street #10, Carlsbad, CA 92008
MLS# CRNDP2506127Listed by: HOMESMART REALTY WEST $2,225,000Active5 beds 5 baths3,495 sq. ft.
5146 Delaney Court, Carlsbad, CA 92008
MLS# CRNDP2506116Listed by: HARCOURTS ONE $1,147,000Pending4 beds 3 baths1,842 sq. ft.
4031 Aidan Cir, Carlsbad, CA 92008
MLS# NDP2505158Listed by: FIRST TEAM REAL ESTATE $1,934,900Pending4 beds 3 baths2,419 sq. ft.
2334 Kimberly Ct, Carlsbad, CA 92008
MLS# 250023364Listed by: FOUR SEASONS PROPERTIES $8,249,000Active6 beds 7 baths7,076 sq. ft.
1095 Hoover Street, Carlsbad, CA 92008
MLS# NDP2500774Listed by: FONTAINE REALTY GROUP, INC $2,699,900Active0.88 Acres
0 Adams Street, Carlsbad, CA 92008
MLS# OC24201399Listed by: COLDWELL BANKER REALTY $1,849,000Pending3 beds 4 baths2,330 sq. ft.
2646 State Street, Unit #d, Carlsbad, CA 92008
MLS# NDP2600979Listed by: DOUGLAS ELLIMAN OF CALIFORNIA $1,235,791Pending4 beds 4 baths1,994 sq. ft.
4806 Parsley Lane, Carlsbad, CA 92008
MLS# CRNDP2403901Listed by: KB HOME SALES - SO CAL, INC. $2,861,000Pending3 beds 4 baths2,861 sq. ft.
2672 Roosevelt Street, Carlsbad, CA 92008
MLS# NDP2600612Listed by: COMPASS $4,000,000Active1 beds 2 baths2,728 sq. ft.
141 Cherry, Carlsbad, CA 92008
MLS# 230019662Listed by: ACRE INVESTMENT REAL ESTATE $875,000Pending2 beds 2 baths1,692 sq. ft.
2002 Avenue Of The Trees, Carlsbad, CA 92008
MLS# CRNDP2304048Listed by: COLDWELL BANKER REALTY $2,220,000Active3 beds 4 baths2,330 sq. ft.
2646 State Street #D, Carlsbad, CA 92008
MLS# NDP2202512Listed by: BERKSHIRE HATHAWAY HOMESERVICE
Local realty services provided by:CENTURY 21 Allstars, CENTURY 21 Affiliated, CENTURY 21 Wildwood Properties, Inc.
The information being provided by California Regional MLS (Southern California) is for the consumer's personal, non-commercial use and may not be used for any purpose other than to identify prospective properties consumer may be interested in purchasing. Any information relating to real estate for sale referenced on this web site comes from the Internet Data Exchange (IDX) program of the California Regional MLS (Southern California). CENTURY 21 Allstars is not a Multiple Listing Service (MLS), nor does it offer MLS access. This website is a service of CENTURY 21 Allstars, a broker participant of California Regional MLS (Southern California). This web site may reference real estate listing(s) held by a brokerage firm other than the broker and/or agent who owns this web site.
The accuracy of all information, regardless of source, including but not limited to open house information, square footages and lot sizes, is deemed reliable but not guaranteed and should be personally verified through personal inspection by and/or with the appropriate professionals. The data contained herein is copyrighted by California Regional MLS (Southern California) and is protected by all applicable copyright laws. Any unauthorized dissemination of this information is in violation of copyright laws and is strictly prohibited.
Copyright 2021 California Regional MLS (Southern California). All rights reserved.
This information is deemed reliable but not guaranteed. You should rely on this information only to decide whether or not to further investigate a particular property. BEFORE MAKING ANY OTHER DECISION, YOU SHOULD PERSONALLY INVESTIGATE THE FACTS (e.g. square footage and lot size) with the assistance of an appropriate professional. You may use this information only to identify properties you may be interested in investigating further. All uses except for personal, non-commercial use in accordance with the foregoing purpose are prohibited. Redistribution or copying of this information, any photographs or video tours is strictly prohibited. This information is derived from the Internet Data Exchange (IDX) service provided by San Diego MLS®. Displayed property listings may be held by a brokerage firm other than the broker and/or agent responsible for this display. The information and any photographs and video tours and the compilation from which they are derived is protected by copyright. Compilation © 2020 San Diego MLS®, Inc.
Popular searches near 92008
Popular neighborhoods near 92008
- Aviara, Carlsbad homes for sale
- Calavera Hills, Carlsbad homes for sale
- Carlsbad Village, Carlsbad homes for sale
- Hedionda Point, Carlsbad homes for sale
- Kelly Ranch, Carlsbad homes for sale
- La Costa Greens, Carlsbad homes for sale
- La Costa Resort, Carlsbad homes for sale
- Lake, Oceanside homes for sale
- North Beach, Carlsbad homes for sale
- Ocean Hills, Oceanside homes for sale
- Ocean Hills Country Club, Oceanside homes for sale
- Olde Carlsbad, Carlsbad homes for sale
- Poinsettia, Carlsbad homes for sale
- Rancho Carlsbad, Carlsbad homes for sale
- Robertson Ranch, Carlsbad homes for sale
- San Pacifico, Carlsbad homes for sale
- South Beach, Carlsbad homes for sale
- Tamarack Point, Carlsbad homes for sale
- The Foothills, Carlsbad homes for sale
- West of I-5, Carlsbad homes for sale
Protect your home and budget from life's surprises with an Assurant Home Warranty, backed by a partner that supports you through every step of homeownership. Explore Plans.
©2026 Century 21 Real Estate LLC. All rights reserved. CENTURY 21®, the CENTURY 21 Logo and C21® are service marks owned by Century 21 Real Estate LLC. Century 21 Real Estate LLC fully supports the principles of the Fair Housing Act and the Equal Opportunity Act. Each office is independently owned and operated. Listing information is deemed reliable but not guaranteed accurate.