- Automba homes for sale
- Barnum Township homes for sale
- Barnum homes for sale
- Carlton homes for sale
- Cloquet homes for sale
- Cromwell homes for sale
- Esko homes for sale
- Kalevala homes for sale
- Kerrick Township homes for sale
- Kerrick homes for sale
- Kettle River homes for sale
- Moose Lake homes for sale
- Moose Lake Township homes for sale
- Norman Township homes for sale
- Silver homes for sale
- Sturgeon Lake homes for sale
- Sturgeon Lake Township homes for sale
- Thomson homes for sale
- Willow River homes for sale
- Windemere Township homes for sale
Carlton County, MN - homes for sale
2 of 2 results displayed
- New
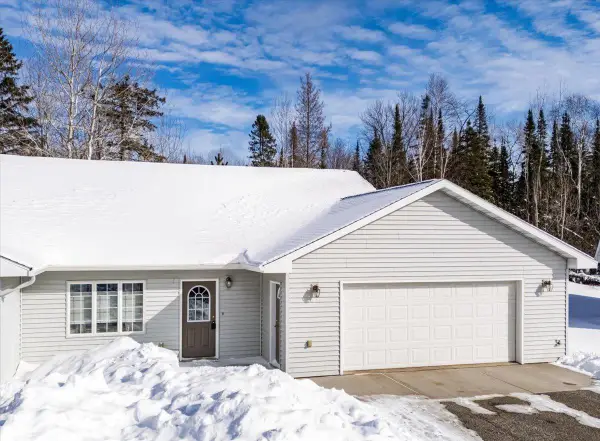 $300,000Active2 beds 1 baths1,296 sq. ft.
14 Michele Lane, Esko, MN 55733
MLS# 7030740Listed by: RE/MAX RESULTS - New
 $419,000Active2 beds 2 baths1,450 sq. ft.
4 Michele Lane, Esko, MN 55733
MLS# 7029545Listed by: RE/MAX RESULTS DULUTH
Local realty services provided by:CENTURY 21 FM Realty
Popular searches near Carlton County, MN
Popular neighborhoods near Carlton County, MN
- Arnold, Duluth homes for sale
- Bayview Heights, Duluth homes for sale
- Central Hillside, Duluth homes for sale
- Chester Park, Duluth homes for sale
- Cody, Duluth homes for sale
- Congdon Park, Duluth homes for sale
- Denfeld, Duluth homes for sale
- Downtown, Duluth homes for sale
- Duluth Heights, Duluth homes for sale
- East Hillside, Duluth homes for sale
- Endion, Duluth homes for sale
- Gary, Duluth homes for sale
- Hermantown, Duluth homes for sale
- Hunters Park, Duluth homes for sale
- Kenwood, Duluth homes for sale
- Lincoln Park, Duluth homes for sale
- Park Point, Duluth homes for sale
- Piedmont Heights, Duluth homes for sale
- Proctor, Duluth homes for sale
- Woodland, Duluth homes for sale
Zip codes near Carlton County, MN
- 54836 homes for sale
- 54880 homes for sale
- 55704 homes for sale
- 55707 homes for sale
- 55712 homes for sale
- 55718 homes for sale
- 55720 homes for sale
- 55726 homes for sale
- 55733 homes for sale
- 55756 homes for sale
- 55757 homes for sale
- 55767 homes for sale
- 55779 homes for sale
- 55783 homes for sale
- 55787 homes for sale
- 55795 homes for sale
- 55807 homes for sale
- 55808 homes for sale
- 55810 homes for sale
- 55811 homes for sale
Protect your home and budget from life's surprises with an Assurant Home Warranty, backed by a partner that supports you through every step of homeownership. Explore Plans.
©2026 Century 21 Real Estate LLC. All rights reserved. CENTURY 21®, the CENTURY 21 Logo and C21® are service marks owned by Century 21 Real Estate LLC. Century 21 Real Estate LLC fully supports the principles of the Fair Housing Act and the Equal Opportunity Act. Each office is independently owned and operated. Listing information is deemed reliable but not guaranteed accurate.