- 4S Ranch, San Diego homes for sale
- Auberge at del Sur, San Diego homes for sale
- Bernardo Vista del Lago, San Diego homes for sale
- Black Mountain Ranch, San Diego homes for sale
- Del Sur, San Diego homes for sale
- Golden City, Poway homes for sale
- Mira Mesa, San Diego homes for sale
- Miramar Ranch North, San Diego homes for sale
- Northeastern San Diego, San Diego homes for sale
- Oaks North, San Diego homes for sale
- Penasquitos Gardens, San Diego homes for sale
- Rancho Bernardo, San Diego homes for sale
- Rancho Encantada, San Diego homes for sale
- Rancho Peñasquitos, San Diego homes for sale
- Sabre Springs, San Diego homes for sale
- Santaluz, San Diego homes for sale
- Sunset Hills, San Diego homes for sale
- The Crosby Club, San Diego homes for sale
- Torrey Highlands, San Diego homes for sale
- Valle Verde Country Club Estates, Poway homes for sale
Carmel Mountain Ranch, San Diego, CA - homes for sale
16 of 16 results displayed
- New
 $798,000Active2 beds 2 baths1,068 sq. ft.
11240 Provencal Place, San Diego, CA 92128
MLS# 260007059SDListed by: 1ST CLASS REAL ESTATE SD - Open Sat, 1 to 3pmNew
 $1,695,000Active5 beds 3 baths3,008 sq. ft.
13673 Shoal Summit, San Diego, CA 92128
MLS# 260006935Listed by: EXP REALTY OF SOUTHERN CALIFORNIA, INC.  $1,379,000Active4 beds 4 baths2,323 sq. ft.
13847 Carmel Ridge Road, San Diego, CA 92128
MLS# 260006033Listed by: COMPASS $899,000Pending3 beds 3 baths1,576 sq. ft.
11378 Provencal Place, San Diego, CA 92128
MLS# NDP2602208Listed by: SWELL PROPERTY $1,499,000Active4 beds 3 baths2,423 sq. ft.
13820 Royal Dornoch Sq, San Diego, CA 92128
MLS# NDP2602153Listed by: COASTAL PREMIER PROPERTIES $800,000Pending2 beds 2 baths1,322 sq. ft.
11287 Provencal Pl, San Diego, CA 92128
MLS# 260005189Listed by: COMPASS $1,149,950Pending4 beds 3 baths1,490 sq. ft.
14192 Chicarita Creek Rd, San Diego, CA 92128
MLS# 260005012Listed by: CALIFORNIA LENDING & REALTY $765,000Active2 beds 2 baths1,101 sq. ft.
14110 Brent Wilsey Pl #1, San Diego, CA 92128
MLS# 260003960SDListed by: KELLER WILLIAMS REALTY $765,000Active2 beds 2 baths1,101 sq. ft.
14110 Brent Wilsey Pl #1, San Diego, CA 92128
MLS# 260003960Listed by: KELLER WILLIAMS REALTY $1,449,000Pending4 beds 4 baths2,406 sq. ft.
13957 Carmel Ridge Rd, San Diego, CA 92128
MLS# 260003875Listed by: LPT REALTY,INC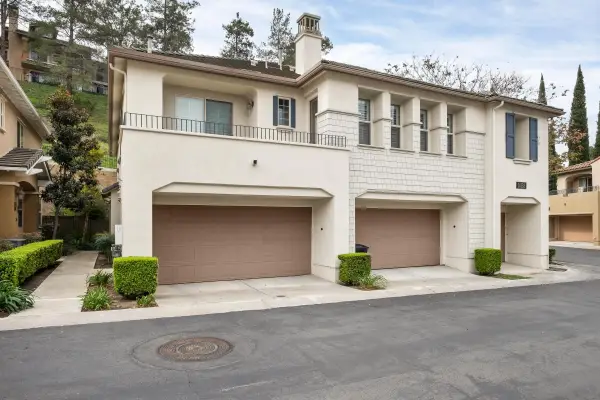 $888,888Pending3 beds 3 baths1,427 sq. ft.
14138 Brent Wilsey Place #3, San Diego, CA 92128
MLS# 260003567Listed by: COMPASS $998,000Active3 beds 2 baths1,322 sq. ft.
10366 Rancho Carmel Dr, San Diego, CA 92128
MLS# 260003490Listed by: EXP REALTY OF CALIFORNIA, INC $1,100,000Pending3 beds 2 baths1,271 sq. ft.
14872 Summerbreeze Way, San Diego, CA 92128
MLS# 260002925Listed by: COLDWELL BANKER WEST $1,169,000Pending4 beds 3 baths1,763 sq. ft.
12124 Riley Ln, San Diego, CA 92128
MLS# 260002210Listed by: EXP REALTY OF CALIFORNIA, INC.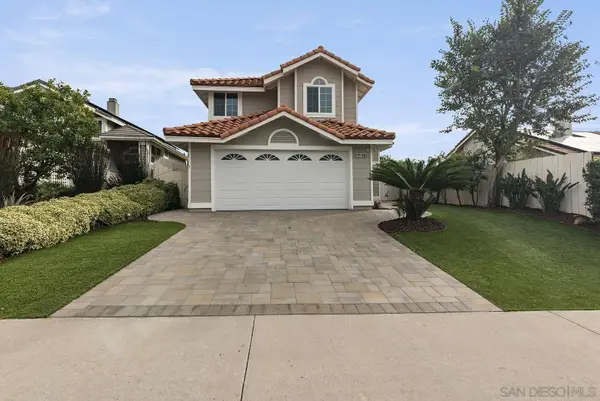 $1,279,999Pending3 beds 3 baths1,505 sq. ft.
14811 Summerbreeze Way, San Diego, CA 92128
MLS# 260001704Listed by: SUNDAE FUNDING, INC.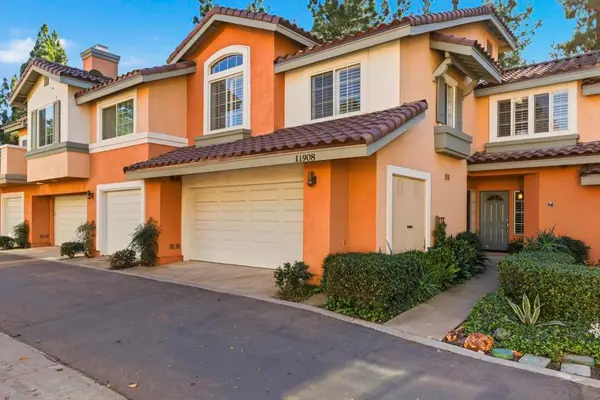 $899,000Pending3 beds 3 baths1,496 sq. ft.
11908 Tivoli Park Row #7, San Diego, CA 92128
MLS# 260002164SDListed by: COMPASS
Local realty services provided by:CENTURY 21 Jordan-Link, CENTURY 21 Affiliated
The information being provided by California Regional MLS (Southern California) is for the consumer's personal, non-commercial use and may not be used for any purpose other than to identify prospective properties consumer may be interested in purchasing. Any information relating to real estate for sale referenced on this web site comes from the Internet Data Exchange (IDX) program of the California Regional MLS (Southern California). CENTURY 21 Jordan-Link is not a Multiple Listing Service (MLS), nor does it offer MLS access. This website is a service of CENTURY 21 Jordan-Link, a broker participant of California Regional MLS (Southern California). This web site may reference real estate listing(s) held by a brokerage firm other than the broker and/or agent who owns this web site.
The accuracy of all information, regardless of source, including but not limited to open house information, square footages and lot sizes, is deemed reliable but not guaranteed and should be personally verified through personal inspection by and/or with the appropriate professionals. The data contained herein is copyrighted by California Regional MLS (Southern California) and is protected by all applicable copyright laws. Any unauthorized dissemination of this information is in violation of copyright laws and is strictly prohibited.
Copyright 2021 California Regional MLS (Southern California). All rights reserved.
This information is deemed reliable but not guaranteed. You should rely on this information only to decide whether or not to further investigate a particular property. BEFORE MAKING ANY OTHER DECISION, YOU SHOULD PERSONALLY INVESTIGATE THE FACTS (e.g. square footage and lot size) with the assistance of an appropriate professional. You may use this information only to identify properties you may be interested in investigating further. All uses except for personal, non-commercial use in accordance with the foregoing purpose are prohibited. Redistribution or copying of this information, any photographs or video tours is strictly prohibited. This information is derived from the Internet Data Exchange (IDX) service provided by San Diego MLS®. Displayed property listings may be held by a brokerage firm other than the broker and/or agent responsible for this display. The information and any photographs and video tours and the compilation from which they are derived is protected by copyright. Compilation © 2020 San Diego MLS®, Inc.
Popular neighborhoods near Carmel Mountain Ranch, San Diego, CA
Zip codes near Carmel Mountain Ranch, San Diego, CA
- 92014 homes for sale
- 92024 homes for sale
- 92025 homes for sale
- 92029 homes for sale
- 92064 homes for sale
- 92067 homes for sale
- 92071 homes for sale
- 92075 homes for sale
- 92078 homes for sale
- 92091 homes for sale
- 92121 homes for sale
- 92122 homes for sale
- 92123 homes for sale
- 92124 homes for sale
- 92126 homes for sale
- 92127 homes for sale
- 92128 homes for sale
- 92129 homes for sale
- 92130 homes for sale
- 92131 homes for sale
Counties near Carmel Mountain Ranch, San Diego, CA
Protect your home and budget from life's surprises with an Assurant Home Warranty, backed by a partner that supports you through every step of homeownership. Explore Plans.
©2026 Century 21 Real Estate LLC. All rights reserved. CENTURY 21®, the CENTURY 21 Logo and C21® are service marks owned by Century 21 Real Estate LLC. Century 21 Real Estate LLC fully supports the principles of the Fair Housing Act and the Equal Opportunity Act. Each office is independently owned and operated. Listing information is deemed reliable but not guaranteed accurate.