- Addison homes for sale
- Carrollton homes for sale
- Carrollton homes for sale
- Coppell homes for sale
- Dallas homes for sale
- Euless homes for sale
- Farmers Branch homes for sale
- Flower Mound homes for sale
- Grapevine homes for sale
- Hackberry homes for sale
- Highland Park homes for sale
- Highland Village homes for sale
- Irving homes for sale
- Lakewood Village homes for sale
- Lewisville homes for sale
- Plano homes for sale
- Richardson homes for sale
- Southwest Dallas homes for sale
- The Colony homes for sale
- University Park homes for sale
75006, TX - homes for sale
143 of 143 results displayed
- New
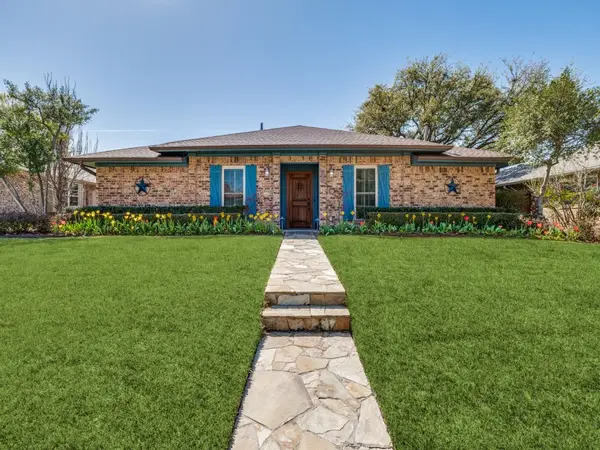
 $275,000Active3 beds 2 baths1,672 sq. ft.
1800 Highland Drive, Carrollton, TX 75006
MLS# 21223677Listed by: UNBUNDLE REALTY, L.L.C. - New
 $235,000Active2 beds 2 baths1,026 sq. ft.
3550 Country Square Drive #111, Carrollton, TX 75006
MLS# 21224409Listed by: COMPASS RE TEXAS, LLC - New
 $289,000Active3 beds 2 baths1,422 sq. ft.
2650 Via Sonoma, Carrollton, TX 75006
MLS# 21221926Listed by: ULTRA REAL ESTATE SERVICES - New
 $485,000Active3 beds 3 baths2,293 sq. ft.
2534 Briardale Drive, Carrollton, TX 75006
MLS# 21220428Listed by: FRASER REALTY - New
 $530,000Active3 beds 3 baths2,406 sq. ft.
2600 Belmeade Drive, Carrollton, TX 75006
MLS# 21218846Listed by: COMPASS RE TEXAS, LLC. - New
 $330,000Active3 beds 2 baths1,397 sq. ft.
2207 Dallas Drive, Carrollton, TX 75006
MLS# 21215842Listed by: REGAL, REALTORS - New
 $320,000Active3 beds 2 baths1,318 sq. ft.
1025 Terrace Trail, Carrollton, TX 75006
MLS# 21213926Listed by: LWE REAL ESTATE - New
 $590,000Active5 beds 4 baths3,064 sq. ft.
1433 Lincoln Place, Carrollton, TX 75006
MLS# 21218687Listed by: EXP REALTY LLC - New
 $365,000Active3 beds 2 baths1,799 sq. ft.
2517 Lawnview Drive, Carrollton, TX 75006
MLS# 21220161Listed by: NB ELITE REALTY - New
 $425,000Active2 beds 2 baths1,806 sq. ft.
2516 Lake Bend Terrace, Carrollton, TX 75006
MLS# 21215005Listed by: MAX FLAT FEE - New
 $237,500Active2 beds 3 baths1,252 sq. ft.
3550 Country Square Drive #505, Carrollton, TX 75006
MLS# 21218804Listed by: KELLER WILLIAMS NO. COLLIN CTY - New
 $345,000Active4 beds 3 baths1,227 sq. ft.
1914 Lawndale Drive, Carrollton, TX 75006
MLS# 21214951Listed by: EBBY HALLIDAY, REALTORS  $410,000Pending3 beds 2 baths1,831 sq. ft.
2621 Winterlake Drive, Carrollton, TX 75006
MLS# 21213422Listed by: COLDWELL BANKER REALTY FRISCO $355,000Active3 beds 2 baths1,654 sq. ft.
2519 Cattail Court, Carrollton, TX 75006
MLS# 21214393Listed by: FIRST CHOICE, REALTORS $390,000Active3 beds 3 baths1,566 sq. ft.
1031 Park Avenue, Carrollton, TX 75006
MLS# 21214382Listed by: FDEZ REALTY $209,970Active3 beds 2 baths1,083 sq. ft.
2240 Tarpley Road #293, Carrollton, TX 75006
MLS# 21212146Listed by: FATHOM REALTY, LLC $475,000Active4 beds 3 baths2,400 sq. ft.
1426 Northridge Drive, Carrollton, TX 75006
MLS# 21212339Listed by: REAL BROKER, LLC $499,000Active4 beds 3 baths2,347 sq. ft.
1514 Northland Street, Carrollton, TX 75006
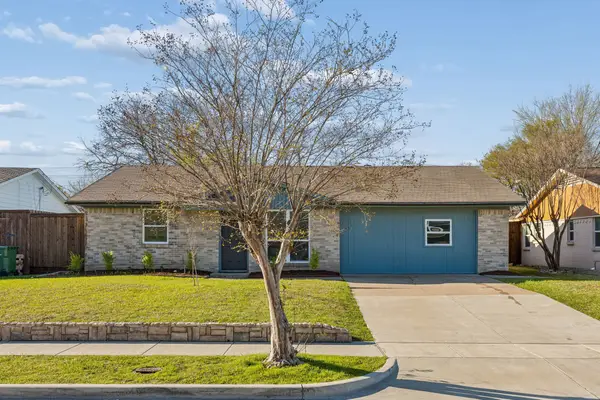
MLS# 21214209Listed by: BROOKS & MORGAN REAL ESTATE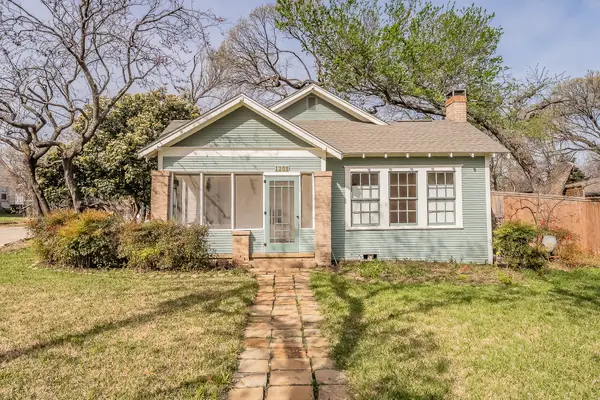 $225,000Active2 beds 1 baths1,252 sq. ft.
1201 Clint Street, Carrollton, TX 75006
MLS# 21206993Listed by: HOMESMART STARS $320,000Active4 beds 3 baths1,556 sq. ft.
2111 Via Catalina, Carrollton, TX 75006
MLS# 21212933Listed by: MONUMENT REALTY $270,000Active2 beds 2 baths1,176 sq. ft.
2628 Via Los Altos, Carrollton, TX 75006
MLS# 21211722Listed by: PIONEER DFW REALTY, LLC $515,000Pending3 beds 3 baths2,350 sq. ft.
2606 Belmeade Drive, Carrollton, TX 75006
MLS# 21212516Listed by: DAVE PERRY MILLER REAL ESTATE $425,000Active2 beds 2 baths1,752 sq. ft.
2531 Lake Bend Terrace, Carrollton, TX 75006
MLS# 21212067Listed by: EBBY HALLIDAY REALTORS- Open Fri, 4 to 6pm
 $484,998Active3 beds 2 baths1,733 sq. ft.
2516 Lawnview Drive, Carrollton, TX 75006
MLS# 21203215Listed by: REAL BROKER, LLC  $133,500Active1 beds 1 baths685 sq. ft.
1601 Marsh Lane #208, Carrollton, TX 75006
MLS# 21209405Listed by: MATT WATSON $444,000Pending3 beds 3 baths2,133 sq. ft.
2126 Nob Hill, Carrollton, TX 75006
MLS# 21208390Listed by: INNOVATIVE REALTY $899,990Active5 beds 4 baths3,487 sq. ft.
1633 Keneipp Road, Carrollton, TX 75006
MLS# 21207190Listed by: KELLER WILLIAMS REALTY LONE ST $289,000Active2 beds 2 baths1,176 sq. ft.
2643 Via Ventura Circle, Carrollton, TX 75006
MLS# 21205551Listed by: LILY MOORE REALTY $482,000Pending3 beds 3 baths2,385 sq. ft.
2602 Ramblewood Drive, Carrollton, TX 75006
MLS# 21205590Listed by: CREEKVIEW REALTY $525,000Pending4 beds 3 baths3,409 sq. ft.
2132 Cannes Drive, Carrollton, TX 75006
MLS# 21155253Listed by: KELLER WILLIAMS CENTRAL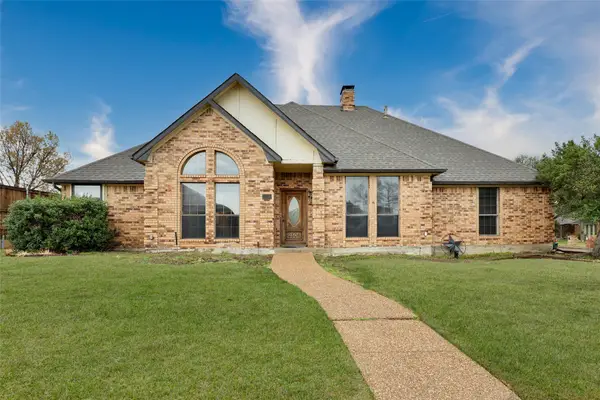 $420,000Pending4 beds 3 baths2,310 sq. ft.
2506 Springdale Drive, Carrollton, TX 75006
MLS# 21203933Listed by: COLDWELL BANKER APEX, REALTORS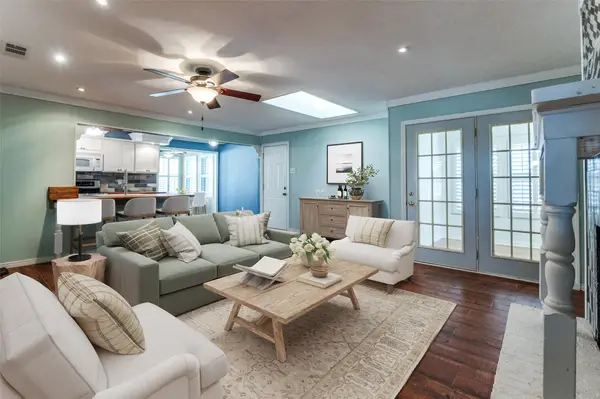 $448,000Active4 beds 2 baths2,247 sq. ft.
2508 Canterbury Drive, Carrollton, TX 75006
MLS# 21203533Listed by: KELLER WILLIAMS REALTY DPR $495,000Active3 beds 3 baths2,051 sq. ft.
1812 Haley Circle, Carrollton, TX 75006
MLS# 21203897Listed by: THE DUBRIEL GROUP, LLC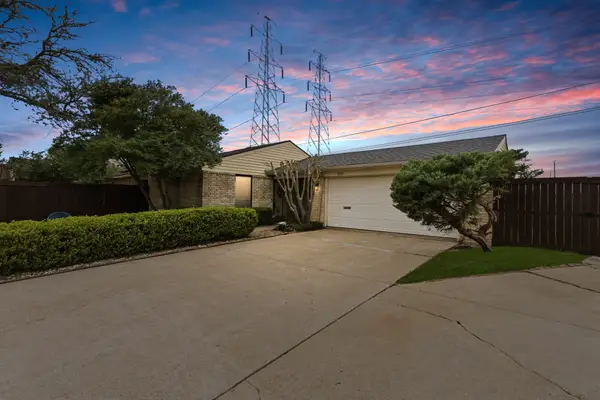 $295,000Active2 beds 2 baths1,170 sq. ft.
2253 Spicewood Lane, Carrollton, TX 75006
MLS# 21201116Listed by: REAL BROKER, LLC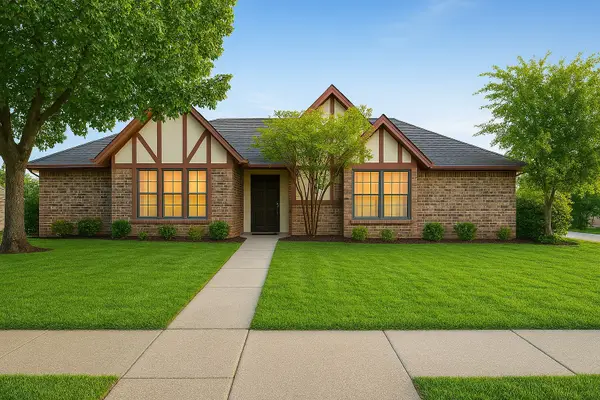 $375,000Active3 beds 2 baths1,783 sq. ft.
2627 Winterlake Drive, Carrollton, TX 75006
MLS# 21202448Listed by: RENTAL DOORS LLC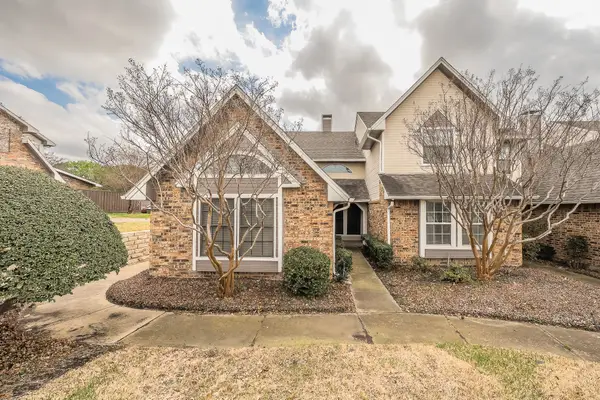 $243,990Active2 beds 1 baths980 sq. ft.
2800 Keller Springs Road #1D, Carrollton, TX 75006
MLS# 21201170Listed by: TDT REALTORS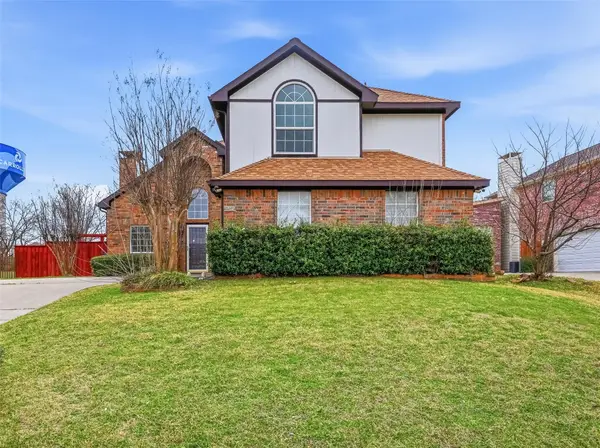 $374,900Pending3 beds 3 baths1,665 sq. ft.
2212 Norwich Place, Carrollton, TX 75006
MLS# 21198184Listed by: KELLER WILLIAMS LEGACY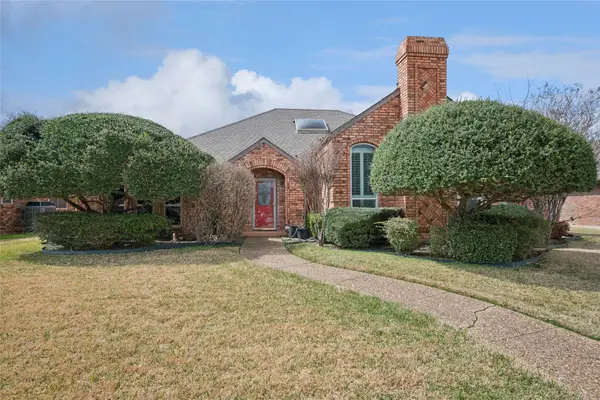 $458,967Active3 beds 3 baths2,280 sq. ft.
2528 Willowdale Drive, Carrollton, TX 75006
MLS# 21200478Listed by: COLDWELL BANKER REALTY $352,000Active3 beds 2 baths1,300 sq. ft.
1114 Osceola Trail, Carrollton, TX 75006
MLS# 21192210Listed by: EBBY HALLIDAY, REALTORS $435,000Active2 beds 2 baths2,103 sq. ft.
1632 Banbury Lane, Carrollton, TX 75006
MLS# 21199867Listed by: BRIGGS FREEMAN SOTHEBYS INTL $415,000Pending3 beds 3 baths2,031 sq. ft.
2521 Canterbury Court, Carrollton, TX 75006
MLS# 21184169Listed by: EBBY HALLIDAY, REALTORS $329,000Active3 beds 2 baths1,220 sq. ft.
1807 Redbud Circle, Carrollton, TX 75006
MLS# 21198553Listed by: RENDON REALTY, LLC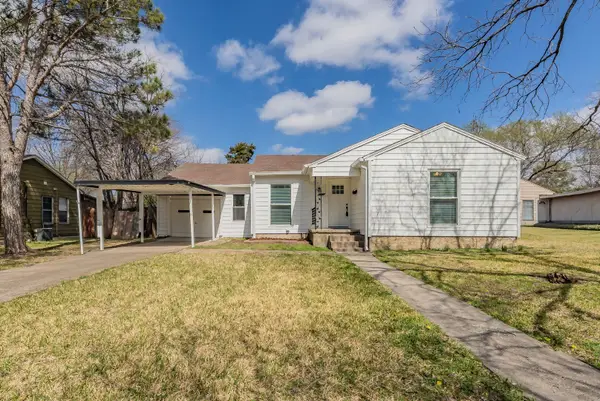 $265,000Active2 beds 1 baths1,003 sq. ft.
1102 W Russell Avenue, Carrollton, TX 75006
MLS# 21177005Listed by: THE MICHAEL GROUP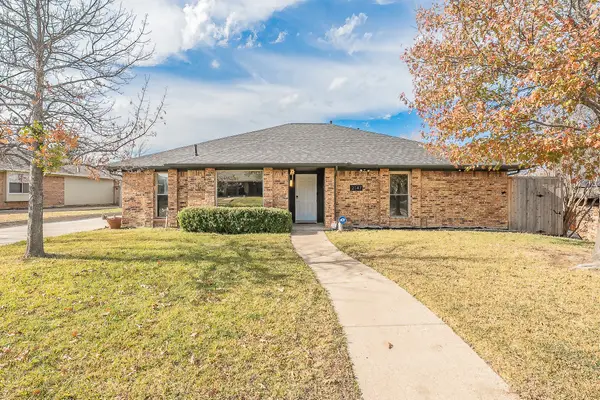 $440,000Active3 beds 2 baths1,800 sq. ft.
2147 San Simeon, Carrollton, TX 75006
MLS# 21198917Listed by: BRAYREG - NORTH DFW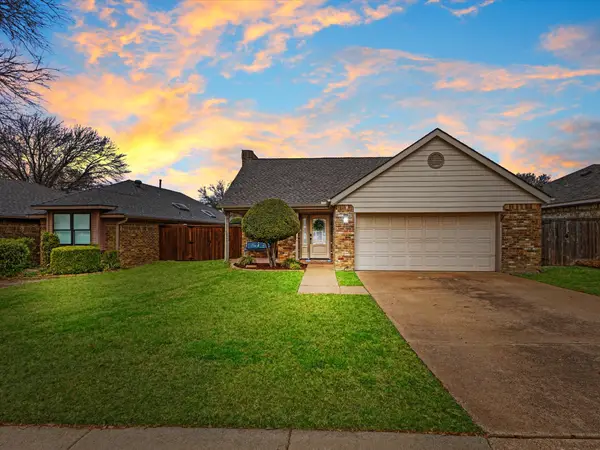 $375,000Pending2 beds 2 baths1,401 sq. ft.
2723 Belmeade Drive, Carrollton, TX 75006
MLS# 21198732Listed by: EBBY HALLIDAY REALTORS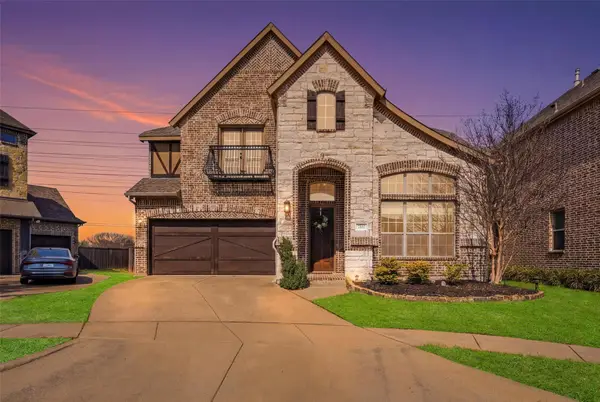 $600,000Active3 beds 3 baths2,836 sq. ft.
2837 Edinburgh Drive, Carrollton, TX 75006
MLS# 21196054Listed by: MONUMENT REALTY $335,000Active3 beds 2 baths1,500 sq. ft.
1100 W Trinity Mills Road, Carrollton, TX 75006
MLS# 21197614Listed by: ALL STARZ REALTY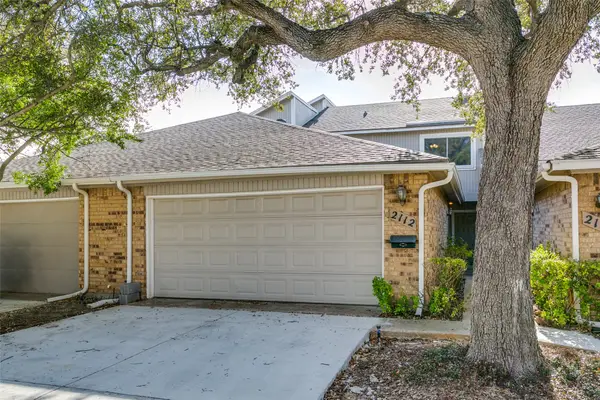 $329,000Active2 beds 3 baths1,850 sq. ft.
2112 Mistymeadow Court, Carrollton, TX 75006
MLS# 21194192Listed by: LOCAL PRO REALTY LLC $589,999Active4 beds 3 baths2,696 sq. ft.
1301 N Trail Drive, Carrollton, TX 75006
MLS# 21189133Listed by: TYCOON REALTY GROUP, LLC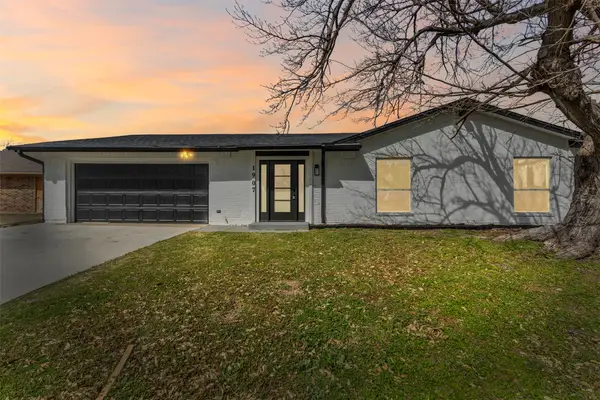 $524,900Active4 beds 3 baths2,698 sq. ft.
1907 Sunridge Road, Carrollton, TX 75006
MLS# 21193109Listed by: KELLER WILLIAMS LEGACY $274,900Active2 beds 2 baths1,100 sq. ft.
1100 W Trinity Mills Road #2045, Carrollton, TX 75006
MLS# 21195057Listed by: OIKOS PROPERTY SERVICES $365,000Active4 beds 2 baths1,678 sq. ft.
2223 Ridgedale Drive, Carrollton, TX 75006
MLS# 21194337Listed by: CREEKVIEW REALTY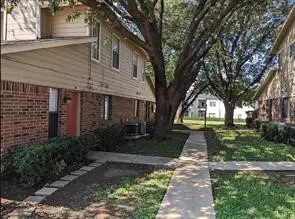 $239,500Active3 beds 2 baths1,083 sq. ft.
2240 Tarpley Road #34, Carrollton, TX 75006
MLS# 21194360Listed by: LPT REALTY, LLC. $420,000Active2 beds 3 baths1,725 sq. ft.
2561 Fountain Cove, Carrollton, TX 75006
MLS# 21193454Listed by: C. W. SPARKS MANAGEMENT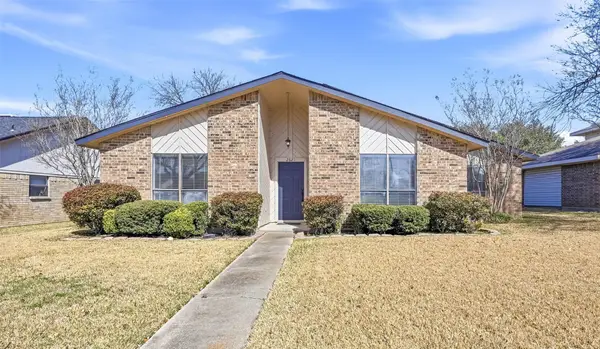 $349,500Pending3 beds 2 baths1,618 sq. ft.
2621 Summertree Drive, Carrollton, TX 75006
MLS# 21191146Listed by: SOUTHERN HILLS REALTY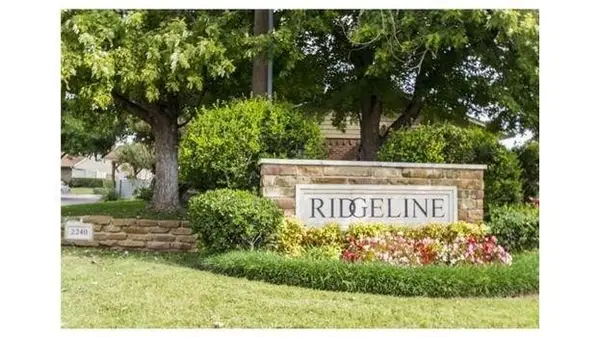 $208,800Active3 beds 2 baths1,083 sq. ft.
2240 Tarpley Road #433, Carrollton, TX 75006
MLS# 21192953Listed by: COMPETITIVE EDGE REALTY LLC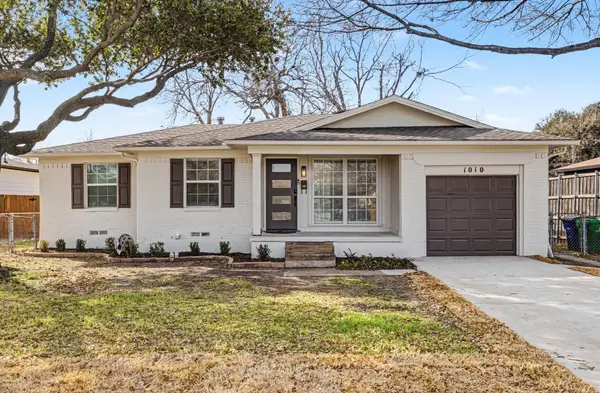 $330,000Active3 beds 2 baths1,096 sq. ft.
1010 Noble Avenue, Carrollton, TX 75006
MLS# 21191542Listed by: DHS REALTY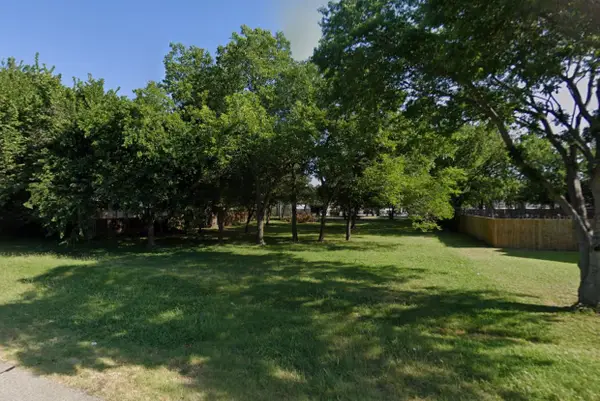 $190,000Pending0.34 Acres
1307 Carroll Avenue, Carrollton, TX 75006
MLS# 21188848Listed by: WEST RESIDENTIAL REALTY, LLC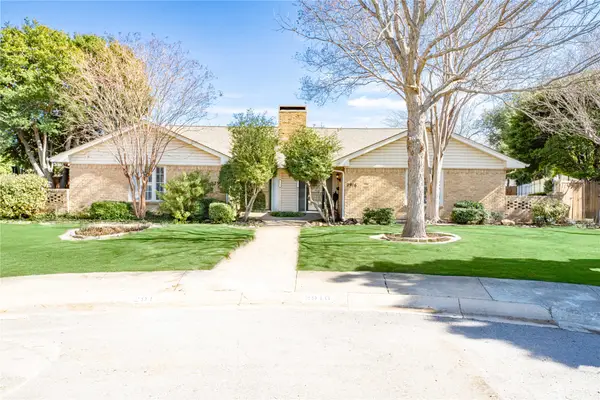 $329,999Active3 beds 2 baths1,808 sq. ft.
2916 Country Place Court, Carrollton, TX 75006
MLS# 21189298Listed by: EXP REALTY LLC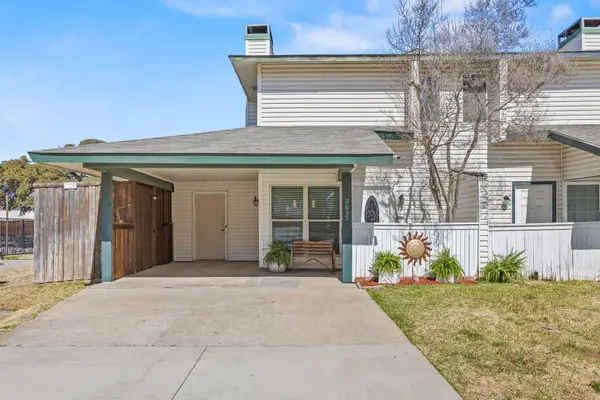 $327,000Active3 beds 2 baths1,602 sq. ft.
2635 Via Sonoma, Carrollton, TX 75006
MLS# 21184565Listed by: EXP REALTY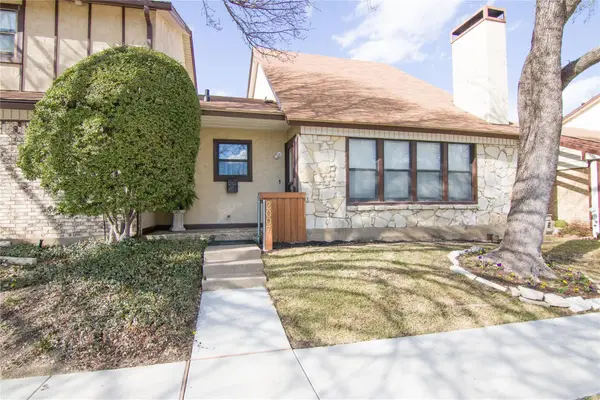 $347,500Active3 beds 3 baths1,780 sq. ft.
2007 Clubview Drive, Carrollton, TX 75006
MLS# 21187346Listed by: KELLER WILLIAMS REALTY ALLEN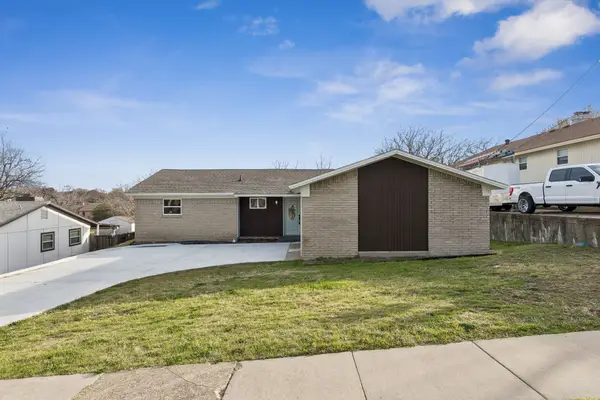 $345,000Pending3 beds 2 baths1,399 sq. ft.
1202 Ryan Avenue, Carrollton, TX 75006
MLS# 21186735Listed by: EBBY HALLIDAY, REALTORS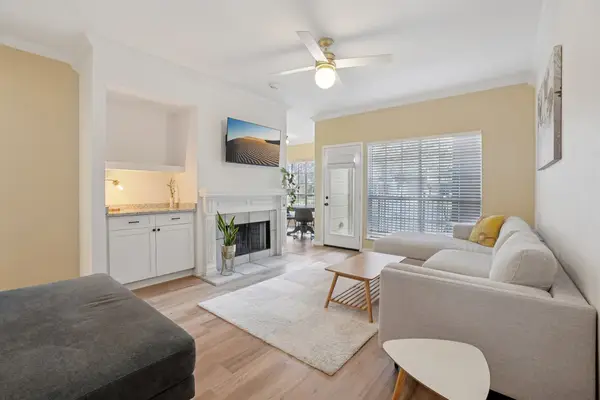 $200,000Pending2 beds 1 baths872 sq. ft.
3550 Country Square Drive #201, Carrollton, TX 75006
MLS# 21182793Listed by: ACQUISTO REAL ESTATE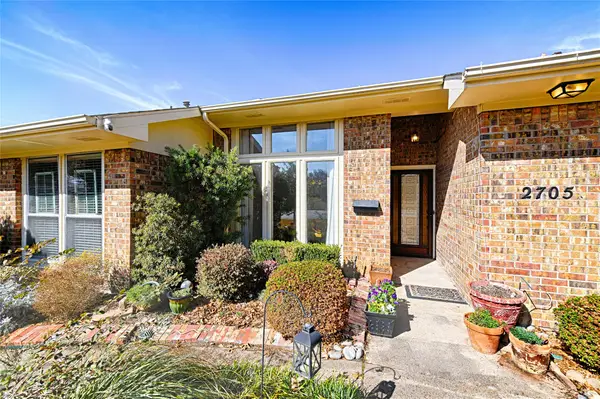 $385,000Active3 beds 3 baths1,873 sq. ft.
2705 Country Place Drive, Carrollton, TX 75006
MLS# 21177376Listed by: EXP REALTY LLC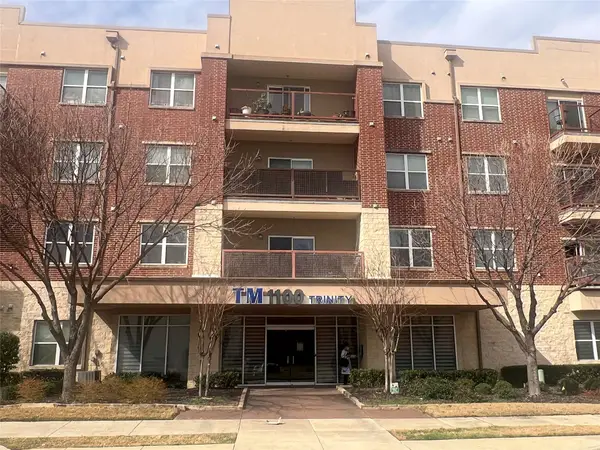 $289,000Active2 beds 2 baths1,295 sq. ft.
1100 W Trinity Mills Road #3015, Carrollton, TX 75006
MLS# 21184408Listed by: DHS REALTY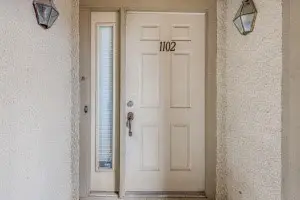 $200,000Active2 beds 1 baths1,013 sq. ft.
2835 Keller Springs Road #1102, Carrollton, TX 75006
MLS# 21184285Listed by: MONUMENT REALTY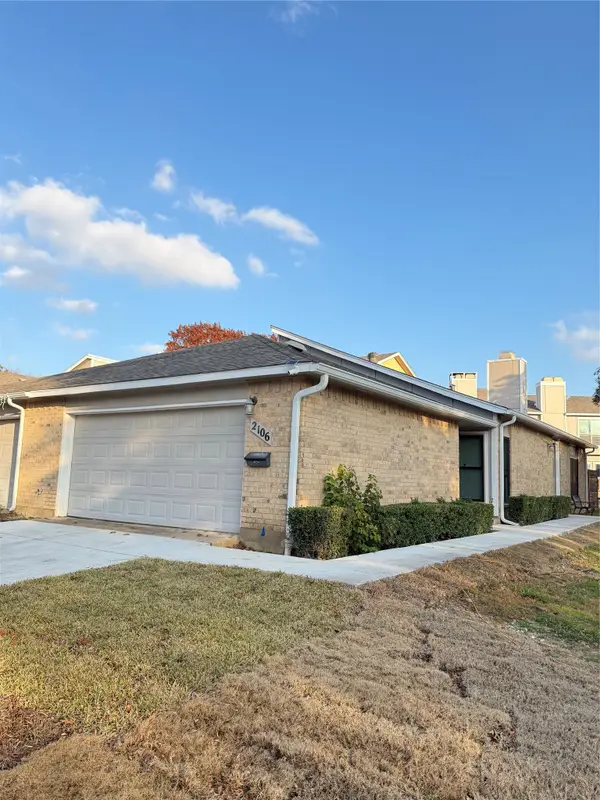 $305,000Active2 beds 2 baths1,480 sq. ft.
2106 Mistymeadow Court, Carrollton, TX 75006
MLS# 21181825Listed by: PEAK RESULTS REALTY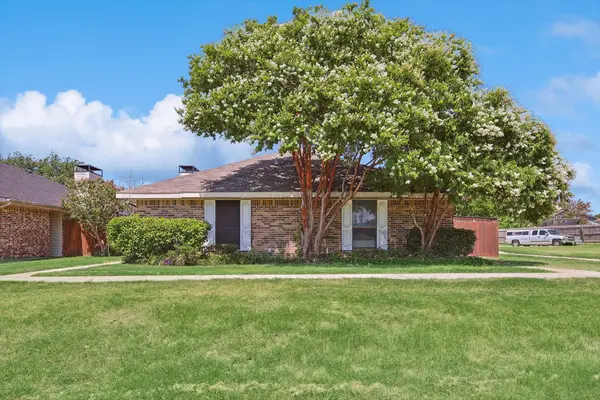 $280,000Active2 beds 2 baths1,102 sq. ft.
2320 Carol Good Lane, Carrollton, TX 75006
MLS# 21181315Listed by: KELLER WILLIAMS REALTY DPR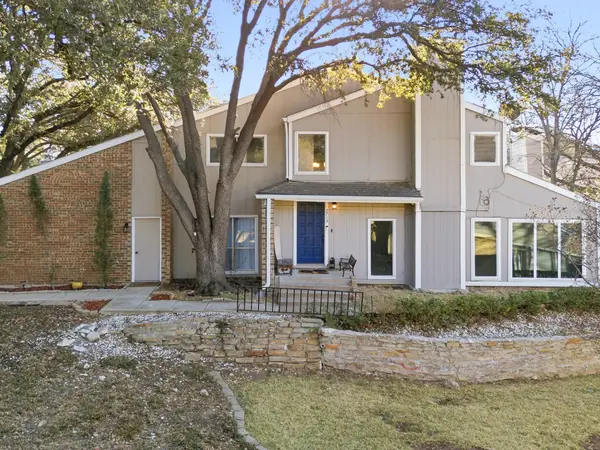 $325,000Active3 beds 2 baths1,611 sq. ft.
2713 Meadowstone Court, Carrollton, TX 75006
MLS# 21174913Listed by: COMPASS RE TEXAS, LLC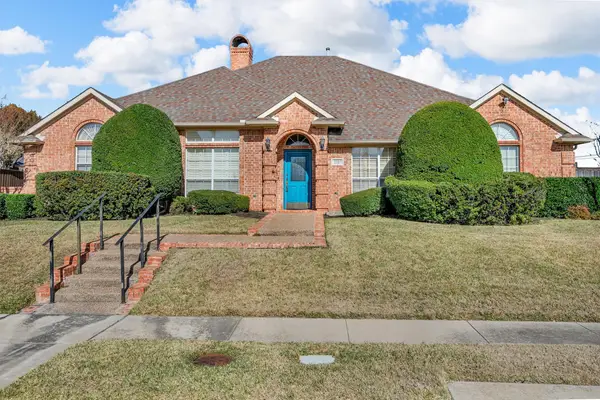 $569,000Active4 beds 3 baths2,844 sq. ft.
2219 Le Mans Drive, Carrollton, TX 75006
MLS# 21175501Listed by: EBBY HALLIDAY, REALTORS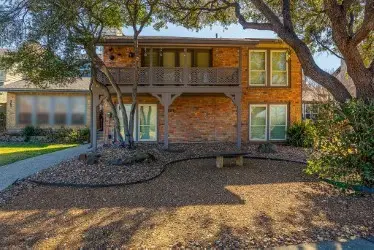 $459,500Pending4 beds 3 baths2,676 sq. ft.
2627 Lakehill Lane, Carrollton, TX 75006
MLS# 21178352Listed by: LYON REALTORS, LLC $519,900Pending3 beds 2 baths2,056 sq. ft.
2230 Cedarbrush Drive, Carrollton, TX 75006
MLS# 21177324Listed by: EBBY HALLIDAY, REALTORS $499,000Active4 beds 4 baths3,000 sq. ft.
2246 Valley Mill, Carrollton, TX 75006
MLS# 21170416Listed by: COLDWELL BANKER APEX, REALTORS $475,000Active4 beds 3 baths2,553 sq. ft.
2123 Daniel Way, Carrollton, TX 75006
MLS# 21176737Listed by: REAL BROKER, LLC $173,900Active2 beds 2 baths948 sq. ft.
2835 Keller Springs #502, Carrollton, TX 75006
MLS# 21176825Listed by: STANDARD REAL ESTATE $314,999Active3 beds 2 baths1,783 sq. ft.
2706 Meadowstone Court, Carrollton, TX 75006
MLS# 21170452Listed by: KELLER WILLIAMS REALTY DPR $650,000Pending4 beds 3 baths2,645 sq. ft.
1506 Ross Avenue, Carrollton, TX 75006
MLS# 21172453Listed by: BEAM REAL ESTATE, LLC $445,000Active3 beds 2 baths2,096 sq. ft.
1207 E Russell Avenue, Carrollton, TX 75006
MLS# 21170993Listed by: LPT REALTY, LLC $283,600Active2 beds 2 baths1,102 sq. ft.
2306 Carol Good Lane, Carrollton, TX 75006
MLS# 21171694Listed by: VIVO REALTY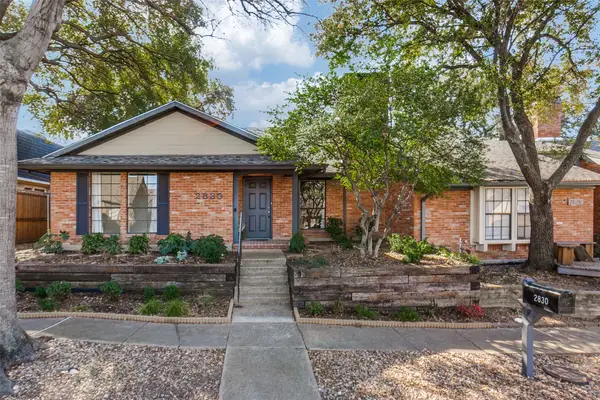 $375,000Pending3 beds 2 baths1,781 sq. ft.
2830 Prescott Drive, Carrollton, TX 75006
MLS# 21169060Listed by: ALLIE BETH ALLMAN & ASSOCIATES $375,000Active3 beds 2 baths1,666 sq. ft.
2402 Scott Mill Road, Carrollton, TX 75006
MLS# 21170505Listed by: DECORATIVE REAL ESTATE $330,000Active4 beds 2 baths1,833 sq. ft.
2611 Via Cordova, Carrollton, TX 75006
MLS# 21166883Listed by: 31 REALTY, LLC $459,990Active3 beds 3 baths2,044 sq. ft.
1513 Jackson Street, Carrollton, TX 75006
MLS# 21166173Listed by: RE/MAX DFW ASSOCIATES $620,000Active4 beds 3 baths2,430 sq. ft.
1349 Jeanette Way, Carrollton, TX 75006
MLS# 21162223Listed by: KELLER WILLIAMS CENTRAL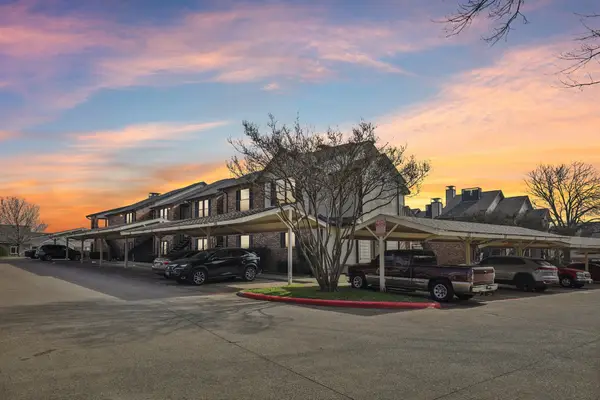 $171,900Active1 beds 1 baths806 sq. ft.
2835 Keller Springs Road #1104, Carrollton, TX 75006
MLS# 21158739Listed by: TEXAS CONNECT REALTY, LLC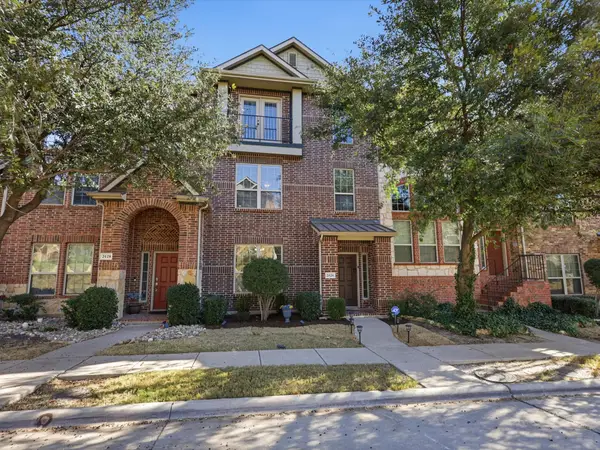 $424,900Active3 beds 4 baths1,996 sq. ft.
2126 Mcparland Court, Carrollton, TX 75006
MLS# 21148638Listed by: MISSION TO CLOSE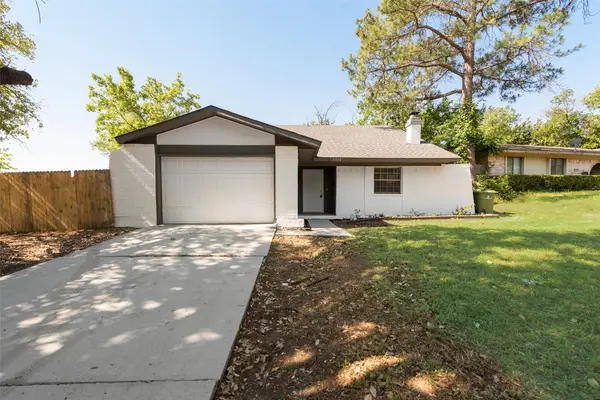 $345,000Active5 beds 3 baths1,687 sq. ft.
1112 Terrace Trail, Carrollton, TX 75006
MLS# 21156866Listed by: ALNA REALTY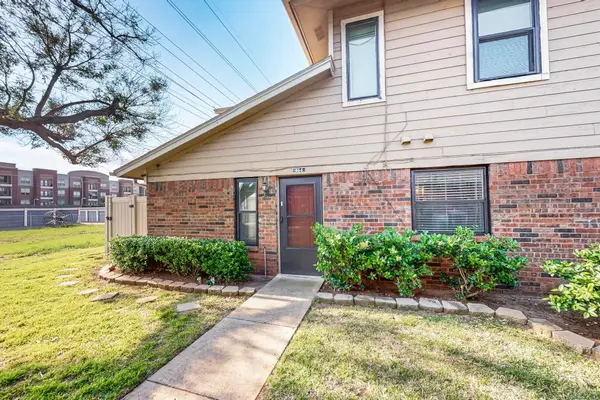 $220,000Active3 beds 2 baths1,083 sq. ft.
2240 Tarpley Road #464, Carrollton, TX 75006
MLS# 21154788Listed by: RE/MAX DFW ASSOCIATES $325,000Active4 beds 2 baths1,630 sq. ft.
2512 Towerwood Drive, Carrollton, TX 75006
MLS# 21135928Listed by: UNITED REAL ESTATE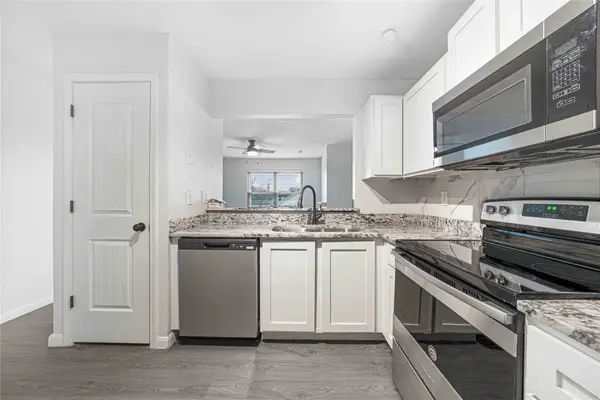 $145,000Active2 beds 1 baths795 sq. ft.
2200 E Trinity Mills Road #510, Carrollton, TX 75006
MLS# 21151462Listed by: LPT REALTY LLC $212,500Active2 beds 2 baths932 sq. ft.
2240 Tarpley Road #92, Carrollton, TX 75006
MLS# 21108378Listed by: THE MICHAEL GROUP $280,000Active0.31 Acres
1628 Rosetree Lane, Carrollton, TX 75006
MLS# 21147084Listed by: ALLIE BETH ALLMAN & ASSOC. $1,915,000Active2.52 Acres
1604-1628 Rosetree Lane, Carrollton, TX 75006
MLS# 21147060Listed by: ALLIE BETH ALLMAN & ASSOC. $325,000Active0.34 Acres
1604 Rosetree Lane, Carrollton, TX 75006
MLS# 21147068Listed by: ALLIE BETH ALLMAN & ASSOC. $310,000Active0.33 Acres
1608 Rosetree Lane, Carrollton, TX 75006
MLS# 21147072Listed by: ALLIE BETH ALLMAN & ASSOC. $250,000Active0.23 Acres
1612 Rosetree Lane, Carrollton, TX 75006
MLS# 21147075Listed by: ALLIE BETH ALLMAN & ASSOC. $250,000Active0.25 Acres
1616 Rosetree Lane, Carrollton, TX 75006
MLS# 21147079Listed by: ALLIE BETH ALLMAN & ASSOC. $250,000Active0.25 Acres
1620 Rosetree Lane, Carrollton, TX 75006
MLS# 21147080Listed by: ALLIE BETH ALLMAN & ASSOC.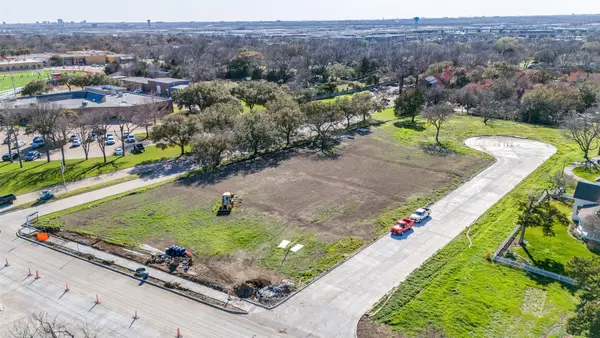 $250,000Active0.25 Acres
1624 Rosetree Lane, Carrollton, TX 75006
MLS# 21147082Listed by: ALLIE BETH ALLMAN & ASSOC. $329,900Pending3 beds 3 baths1,581 sq. ft.
2009 Via Bravo, Carrollton, TX 75006
MLS# 21148900Listed by: COMPASS RE TEXAS, LLC. $220,000Active4 beds 2 baths1,297 sq. ft.
1416 Donald Avenue, Carrollton, TX 75006
MLS# 21148508Listed by: SUSY SALDIVAR REAL ESTATE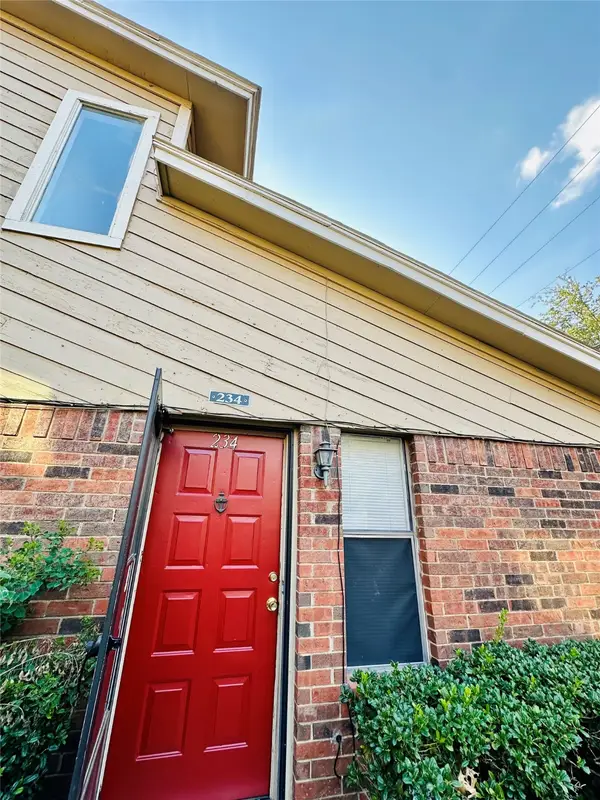 $240,000Active3 beds 2 baths1,083 sq. ft.
2240 Tarpley Road #234, Carrollton, TX 75006
MLS# 21143427Listed by: CRAWFORD AND COMPANY, REALTORS $390,000Active3 beds 2 baths1,859 sq. ft.
1902 Pat Ln, Carrollton, TX 75006
MLS# 21139109Listed by: PIONEER DFW REALTY, LLC $484,500Active4 beds 3 baths2,405 sq. ft.
1519 Shannon Place, Carrollton, TX 75006
MLS# 21125913Listed by: EXP REALTY $489,000Active4 beds 3 baths2,642 sq. ft.
2920 Shady Lake Circle, Carrollton, TX 75006
MLS# 21151147Listed by: EBBY HALLIDAY REALTORS $635,000Active4 beds 3 baths2,642 sq. ft.
2707 Quail Ridge Drive, Carrollton, TX 75006
MLS# 21124721Listed by: COMPASS RE TEXAS, LLC $385,000Active3 beds 3 baths2,146 sq. ft.
2520 Via Avenida Drive, Carrollton, TX 75006
MLS# 21123548Listed by: PINNACLE REALTY ADVISORS $729,000Active3 beds 3 baths2,922 sq. ft.
2813 Raintree Drive, Carrollton, TX 75006
MLS# 21117237Listed by: COLDWELL BANKER REALTY $539,000Active4 beds 3 baths2,519 sq. ft.
2621 Sedgeway Lane, Carrollton, TX 75006
MLS# 21205913Listed by: EBBY HALLIDAY, REALTORS $465,000Active3 beds 3 baths2,226 sq. ft.
2505 Copper Creek Lane, Carrollton, TX 75006
MLS# 21102387Listed by: PAUL JEFFERSON REAL ESTATE $295,000Pending3 beds 3 baths1,836 sq. ft.
1609 Spring Avenue, Carrollton, TX 75006
MLS# 21108048Listed by: STEPSTONE REALTY LLC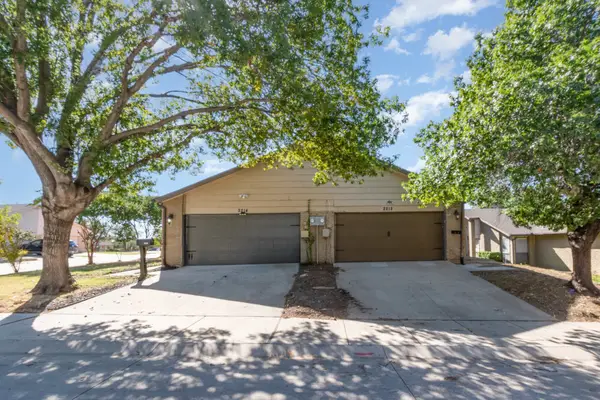 $530,000Pending4 beds 4 baths2,946 sq. ft.
2212 Heritage Circle, Carrollton, TX 75006
MLS# 21112936Listed by: WM REALTY TX LLC $330,000Active2 beds 3 baths1,637 sq. ft.
2201 Jamestown Court, Carrollton, TX 75006
MLS# 21104438Listed by: KELLER WILLIAMS LEGACY $439,000Active3 beds 3 baths2,332 sq. ft.
2945 Country Place Circle, Carrollton, TX 75006
MLS# 21151141Listed by: EBBY HALLIDAY REALTORS $549,999Active4 beds 3 baths2,507 sq. ft.
2309 York Court, Carrollton, TX 75006
MLS# 21105478Listed by: EXP REALTY
 $140,000Active1 beds 1 baths633 sq. ft.
2200 E Trinity Mills Road #214, Carrollton, TX 75006
MLS# 21105592Listed by: CENTURY 21 MIKE BOWMAN, INC. $299,000Active3 beds 2 baths1,512 sq. ft.
2126 Travis Drive, Carrollton, TX 75006
MLS# 21104176Listed by: COMPASS RE TEXAS, LLC. $275,000Active2 beds 2 baths1,700 sq. ft.
2212 Salem Drive, Carrollton, TX 75006
MLS# 21175835Listed by: KELLER WILLIAMS CENTRAL $475,000Active4 beds 2 baths2,621 sq. ft.
2719 N Surrey Drive, Carrollton, TX 75006
MLS# 21083442Listed by: EXP REALTY $649,000Pending4 beds 3 baths2,736 sq. ft.
1630 Millview Place, Carrollton, TX 75006
MLS# 21087655Listed by: COMPASS RE TEXAS, LLC $389,000Active3 beds 3 baths2,054 sq. ft.
1805 Lakecrest Court, Carrollton, TX 75006
MLS# 21080889Listed by: TRUHOME REAL ESTATE $539,000Pending5 beds 3 baths3,119 sq. ft.
2966 Buttonwood Drive, Carrollton, TX 75006
MLS# 21047754Listed by: GREAT WESTERN REALTY $345,000Active3 beds 2 baths1,685 sq. ft.
2021 Brentwood Lane, Carrollton, TX 75006
MLS# 21084272Listed by: OPENDOOR BROKERAGE, LLC $330,000Active2 beds 2 baths1,532 sq. ft.
2709 Heather Glen Court, Carrollton, TX 75006
MLS# 21076004Listed by: ULTRA REAL ESTATE SERVICES $308,000Active3 beds 3 baths1,750 sq. ft.
2764 Keller Springs Place, Carrollton, TX 75006
MLS# 21147036Listed by: COLDWELL BANKER APEX, REALTORS $530,000Active4 beds 2 baths2,420 sq. ft.
2706 Peach Tree Drive, Carrollton, TX 75006
MLS# 21188119Listed by: EXP REALTY LLC $489,000Active3 beds 3 baths2,374 sq. ft.
2517 Willowgate Lane, Carrollton, TX 75006
MLS# 21206208Listed by: FATHOM REALTY, LLC $189,950Active1 beds 1 baths745 sq. ft.
1100 W Trinity Mills Road #3032, Carrollton, TX 75006
MLS# 21056271Listed by: WINHILL ADVISORS DFW $639,000Active3 beds 4 baths1,744 sq. ft.
1308 E Crosby Road, Carrollton, TX 75006
MLS# 21056202Listed by: LOVETT REALTY, INC $549,900Active4 beds 3 baths2,367 sq. ft.
2205 Timberwood, Carrollton, TX 75006
MLS# 21045123Listed by: ALLIE BETH ALLMAN & ASSOC. $375,000Active3 beds 4 baths2,332 sq. ft.
1827 Lakecrest Circle, Carrollton, TX 75006
MLS# 21048352Listed by: JPAR DALLAS $625,000Active3 beds 3 baths1,756 sq. ft.
1362 E Crosby Road, Carrollton, TX 75006
MLS# 21042112Listed by: LOVETT REALTY, INC- Open Sat, 12 to 2pm
 $384,900Active2 beds 3 baths2,408 sq. ft.
3020 Stonehenge Lane, Carrollton, TX 75006
MLS# 21176131Listed by: HOMESMART STARS  $649,500Active5 beds 4 baths3,846 sq. ft.
2221 Everglade Court, Carrollton, TX 75006
MLS# 21000008Listed by: GREAT WESTERN REALTY $420,000Active4 beds 3 baths2,500 sq. ft.
2113 Via Del Norte, Carrollton, TX 75006
MLS# 20997126Listed by: DALLAS PROPERTY MANAGEMENT PRO $174,900Active1 beds 1 baths806 sq. ft.
2835 Keller Springs Road #1304, Carrollton, TX 75006
MLS# 21000479Listed by: EXP REALTY, LLC $259,000Active2 beds 2 baths1,100 sq. ft.
1100 W Trinity Mills Road #1014, Carrollton, TX 75006
MLS# 21001731Listed by: EXP REALTY LLC $355,000Active3 beds 2 baths1,250 sq. ft.
1105 Ryan Avenue, Carrollton, TX 75006
MLS# 20972584Listed by: REALTY OF AMERICA, LLC $449,000Active3 beds 4 baths1,996 sq. ft.
2125 Mcparland Court, Carrollton, TX 75006
MLS# 20916469Listed by: CRAWFORD AND COMPANY, REALTORS $425,000Active4 beds 2 baths1,980 sq. ft.
2310 Greenmeadow Drive, Carrollton, TX 75006
MLS# 21167464Listed by: KELLER WILLIAMS REALTY DPR $289,000Active2 beds 2 baths1,295 sq. ft.
1100 W Trinity Mills Road #3003, Carrollton, TX 75006
MLS# 20860000Listed by: TOP REALTY $349,900Active3 beds 2 baths1,548 sq. ft.
1400 Milam Way, Carrollton, TX 75006
MLS# 21146340Listed by: MERSAES REAL ESTATE, INC. $450,000Active3 beds 3 baths1,863 sq. ft.
2801 Country Villa Circle, Carrollton, TX 75006
MLS# 21195700Listed by: EXP REALTY
Local realty services provided by:CENTURY 21 Judge Fite Company
Information provided, in part, by North Texas Real Estate Information Systems, Inc. Last Updated March 31, 2026 Listings with the NTREIS logo are listed by brokerages other than CENTURY 21 Judge Fite Company.
Popular searches near 75006
Popular neighborhoods near 75006
- Brookhaven, Dallas homes for sale
- Carrollton Heights, Carrollton homes for sale
- Carrollton Highlands, Carrollton homes for sale
- Central Carrollton, Carrollton homes for sale
- Copperwood, Carrollton homes for sale
- Country Place, Carrollton homes for sale
- Johnston Park, Dallas homes for sale
- Josey Ranch, Carrollton homes for sale
- Keller Springs, Carrollton homes for sale
- McCoy Estates, Carrollton homes for sale
- Northcrest Estates, Carrollton homes for sale
- Nottingham Estates, Carrollton homes for sale
- Original Town, Carrollton homes for sale
- Palisades Point, Carrollton homes for sale
- Rollingwood Estates, Carrollton homes for sale
- Southwest Carrollton, Carrollton homes for sale
- Summertree, Carrollton homes for sale
- Terrace Club Park, Dallas homes for sale
- Valley View, Dallas homes for sale
- Valwood Park, Dallas homes for sale
Counties near Carrollton, 75006
- Collin County homes for sale
- Cooke County homes for sale
- Dallas County homes for sale
- Denton County homes for sale
- Ellis County homes for sale
- Fannin County homes for sale
- Grayson County homes for sale
- Hill County homes for sale
- Hood County homes for sale
- Hunt County homes for sale
- Johnson County homes for sale
- Kaufman County homes for sale
- Love County homes for sale
- Navarro County homes for sale
- Parker County homes for sale
- Rains County homes for sale
- Rockwall County homes for sale
- Tarrant County homes for sale
- Van Zandt County homes for sale
- Wise County homes for sale
Protect your home and budget from life's surprises with an Assurant Home Warranty, backed by a partner that supports you through every step of homeownership. Explore Plans.
©2026 Century 21 Real Estate LLC. All rights reserved. CENTURY 21®, the CENTURY 21 Logo and C21® are service marks owned by Century 21 Real Estate LLC. Century 21 Real Estate LLC fully supports the principles of the Fair Housing Act and the Equal Opportunity Act. Each office is independently owned and operated. Listing information is deemed reliable but not guaranteed accurate.