- Aloma Woods, Oviedo homes for sale
- Baldwin Park, Orlando homes for sale
- Deer Run, Casselberry homes for sale
- Fairview Shores, Winter Park homes for sale
- Fern Park, Casselberry homes for sale
- Goldenrod, Goldenrod homes for sale
- Hickory Square, Altamonte Springs homes for sale
- Highlands, Winter Springs homes for sale
- Legacy Park, Casselberry homes for sale
- Longwood, Longwood homes for sale
- North Orlando, Winter Springs homes for sale
- Orwin Manor, Orlando homes for sale
- Parkst, Winter Springs homes for sale
- Parkstone, Winter Springs homes for sale
- Spring Oaks, Altamonte Springs homes for sale
- Spring Valley, Altamonte Springs homes for sale
- Sunrise, Winter Springs homes for sale
- Tuscawilla, Winter Springs homes for sale
- Weathersfield, Altamonte Springs homes for sale
- Winter Springs, Winter Springs homes for sale
Casselberry, FL - homes for sale
129 of 129 results displayed
- Open Sat, 11am to 2pmNew
 $475,000Active3 beds 2 baths1,952 sq. ft.
199 Paul Mcclure Court, CASSELBERRY, FL 32707
MLS# O6389266Listed by: KELLER WILLIAMS ADVANTAGE REALTY - New
 $145,000Active1 beds 1 baths722 sq. ft.
202 E Esplanade Way E #104, CASSELBERRY, FL 32707
MLS# O6389373Listed by: KELLER WILLIAMS ADVANTAGE REALTY - New
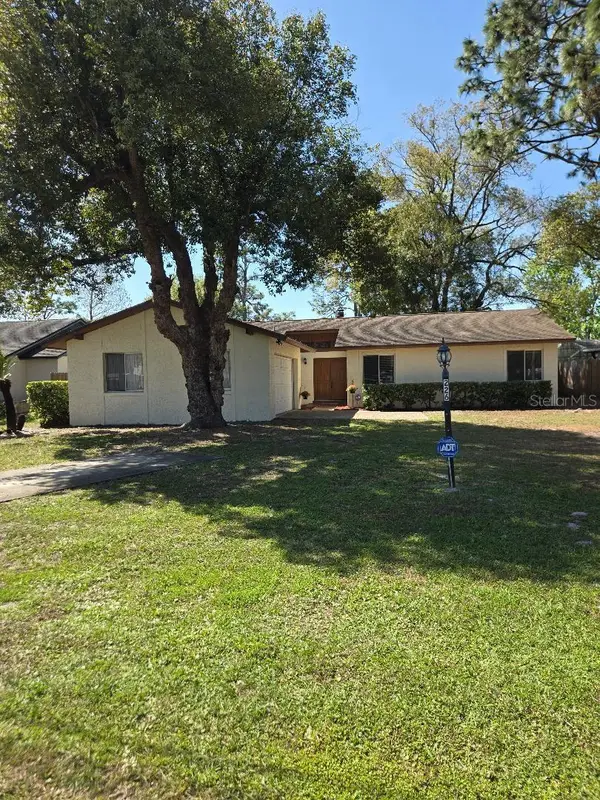 $379,900Active3 beds 2 baths1,599 sq. ft.
226 N Griffin Drive, CASSELBERRY, FL 32707
MLS# O6384777Listed by: CHARLES RUTENBERG REALTY ORLANDO - New
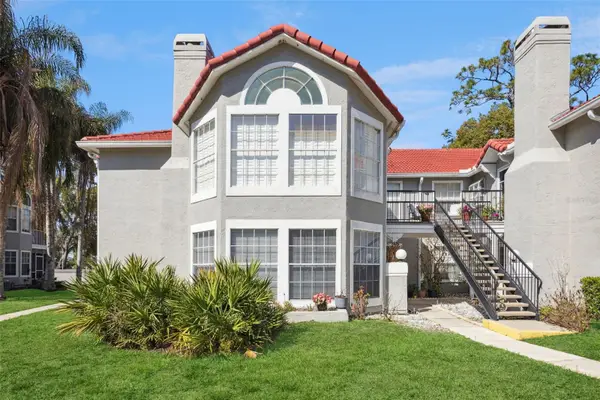 $220,000Active2 beds 2 baths1,189 sq. ft.
935 Northern Dancer Way #105, CASSELBERRY, FL 32707
MLS# O6387980Listed by: BLOOM HOME GROUP REALTY LLC - Open Sun, 12 to 2pmNew
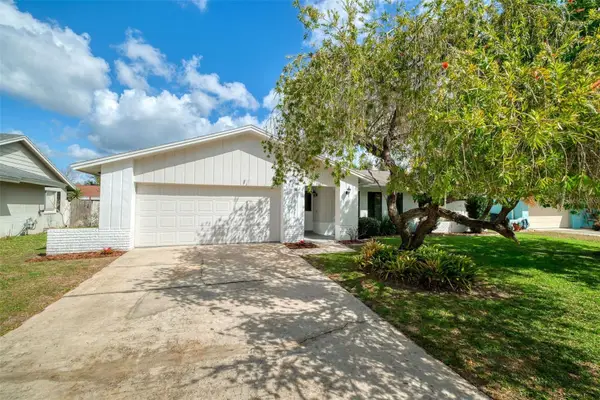 $389,900Active4 beds 2 baths1,636 sq. ft.
1693 Canterbury Circle, CASSELBERRY, FL 32707
MLS# O6348675Listed by: KELLER WILLIAMS WINTER PARK - New
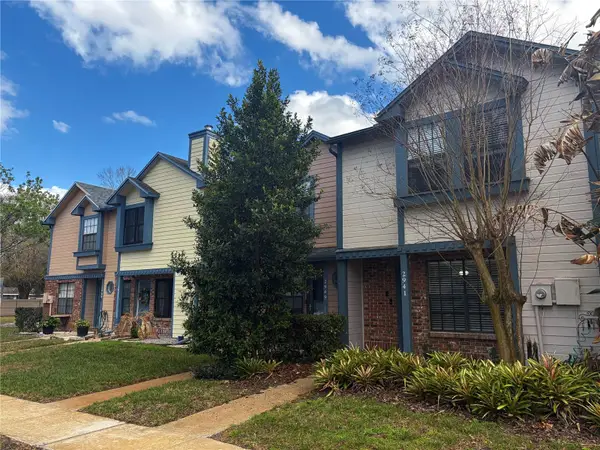
 $209,000Active2 beds 2 baths1,105 sq. ft.
2529 Windward Way, WINTER PARK, FL 32792
MLS# O6388076Listed by: FANNIE HILLMAN & ASSOCIATES - New
 $299,000Active3 beds 3 baths1,344 sq. ft.
2941 Lowell Court, CASSELBERRY, FL 32707
MLS# O6388312Listed by: CHARLES RUTENBERG REALTY ORLANDO - New
 $385,000Active4 beds 4 baths2,210 sq. ft.
1828 Grand Rue Drive, CASSELBERRY, FL 32707
MLS# O6388317Listed by: CHARLES RUTENBERG REALTY ORLANDO - New
 $380,000Active4 beds 3 baths2,083 sq. ft.
1375 Lake Drive, CASSELBERRY, FL 32707
MLS# O6387594Listed by: COMPASS FLORIDA LLC - New
 $315,000Active3 beds 4 baths1,652 sq. ft.
1515 Winter Green Boulevard, WINTER PARK, FL 32792
MLS# O6384755Listed by: KELLER WILLIAMS WINTER PARK 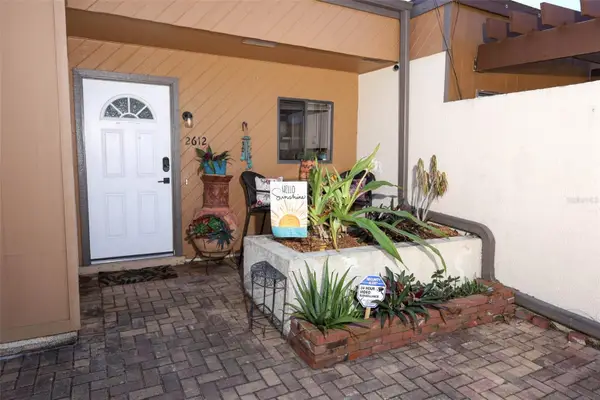 $275,000Pending2 beds 2 baths1,020 sq. ft.
2612 Exuma Way, WINTER PARK, FL 32792
MLS# O6387369Listed by: KELLER WILLIAMS ADVANTAGE REALTY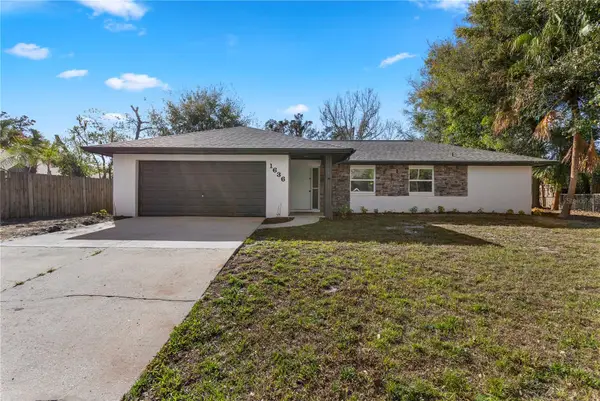 $475,000Pending4 beds 2 baths1,802 sq. ft.
1636 E Sandpiper Trail, CASSELBERRY, FL 32707
MLS# O6387333Listed by: COMPASS FLORIDA LLC- New
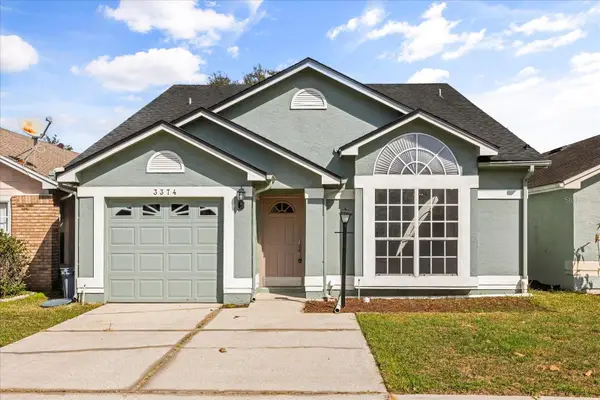 $380,000Active3 beds 3 baths1,397 sq. ft.
3374 Hamlet Loop, WINTER PARK, FL 32792
MLS# O6386907Listed by: THE REALTY MEDICS - New
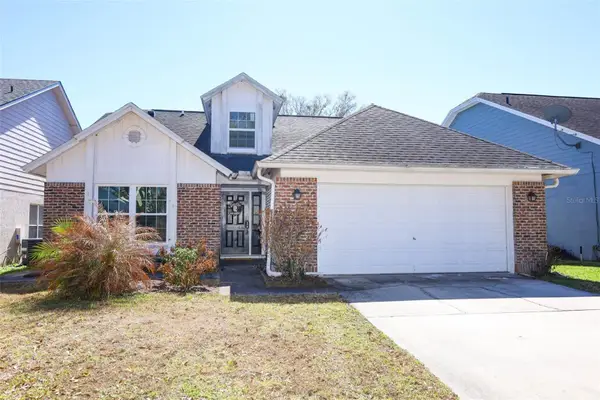
 $449,900Active3 beds 2 baths1,853 sq. ft.
244 Overbrook Drive, CASSELBERRY, FL 32707
MLS# O6385314Listed by: ASSURED PROPERTY MANAGEMENT  $449,000Active4 beds 2 baths1,774 sq. ft.
219 Hoffman Court, CASSELBERRY, FL 32707
MLS# O6386641Listed by: KORR REALTY CORP $397,000Active3 beds 2 baths1,436 sq. ft.
127 Mark David Boulevard, CASSELBERRY, FL 32707
MLS# O6384465Listed by: EXP REALTY LLC $500,000Active4 beds 3 baths2,200 sq. ft.
406 Capron Ash Loop, CASSELBERRY, FL 32707
MLS# O6384763Listed by: MARK SPAIN REAL ESTATE $344,900Pending3 beds 2 baths1,458 sq. ft.
72 S Winter Park Drive, CASSELBERRY, FL 32707
MLS# O6385812Listed by: CHAMBERLAIN REALTY LLC $584,000Pending4 beds 4 baths2,937 sq. ft.
1351 Ash Tree Cove, CASSELBERRY, FL 32707
MLS# O6386066Listed by: CORCORAN PREMIER REALTY $515,000Active3 beds 2 baths2,040 sq. ft.
1501 Avalon Boulevard, CASSELBERRY, FL 32707
MLS# O6386150Listed by: YOU HAVE REALTY LLC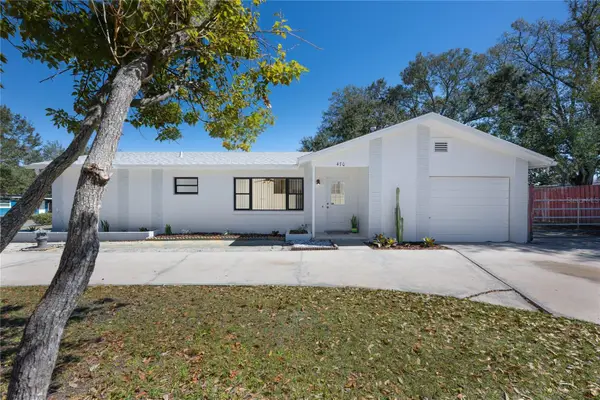 $290,000Pending3 beds 2 baths1,209 sq. ft.
470 Violet Dell, CASSELBERRY, FL 32707
MLS# O6382002Listed by: WEICHERT REALTORS HALLMARK PROPERTIES- Open Sat, 1 to 4pm
 $359,950Active2 beds 2 baths1,398 sq. ft.
4192 Buglers Rest Place, CASSELBERRY, FL 32707
MLS# O6381987Listed by: KELLER WILLIAMS ADVANTAGE REALTY  $569,900Pending4 beds 2 baths2,092 sq. ft.
211 Doverwood Road, CASSELBERRY, FL 32730
MLS# O6384513Listed by: EXP REALTY LLC $430,000Pending3 beds 2 baths1,814 sq. ft.
1203 Snug Harbor Drive, CASSELBERRY, FL 32707
MLS# O6383567Listed by: COMPASS FLORIDA LLC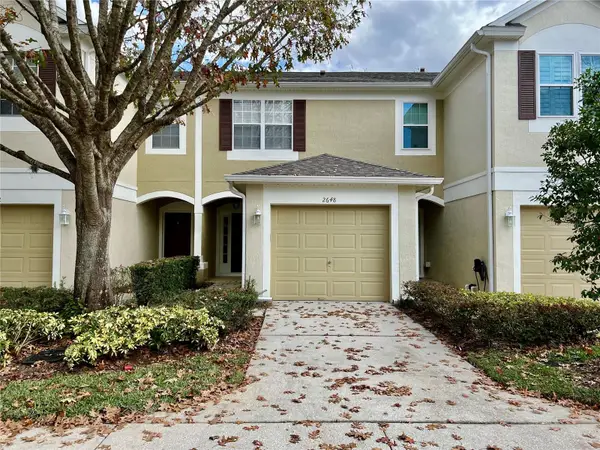 $355,000Active2 beds 3 baths1,550 sq. ft.
2648 Galliano Circle, WINTER PARK, FL 32792
MLS# S5144547Listed by: ALLEGIANT MANAGEMENT GROUP INC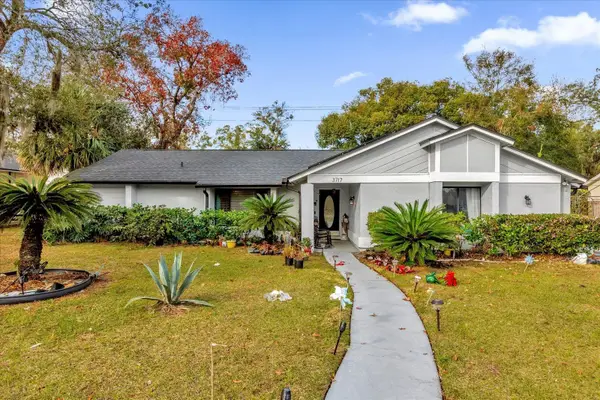 $590,000Active4 beds 2 baths2,353 sq. ft.
3717 Jericho Drive, CASSELBERRY, FL 32707
MLS# S5144467Listed by: MIRANDA LANDA REALTY GROUP LLC $345,000Pending4 beds 2 baths1,340 sq. ft.
280 Wetumpa Court, CASSELBERRY, FL 32707
MLS# O6384514Listed by: EXP REALTY LLC $169,000Active1 beds 1 baths781 sq. ft.
1158 Calle Del Norte #C, CASSELBERRY, FL 32707
MLS# O6384512Listed by: COLDWELL BANKER REALTY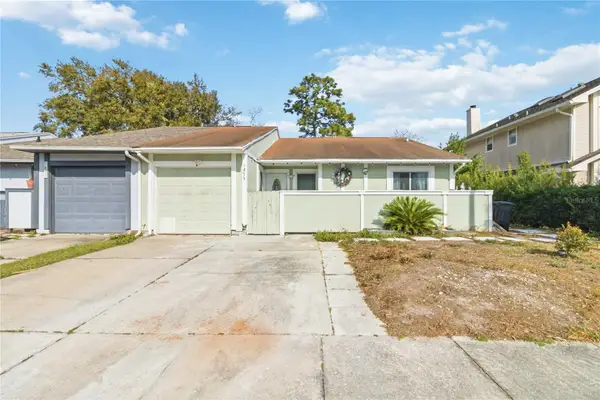 $295,000Active3 beds 2 baths1,291 sq. ft.
1873 Casselwood Street, WINTER PARK, FL 32792
MLS# O6378028Listed by: ERA GRIZZARD REAL ESTATE $1,895,000Active5 beds 5 baths4,635 sq. ft.
2008 Center Drive, CASSELBERRY, FL 32707
MLS# O6384502Listed by: COMPASS FLORIDA LLC $289,000Active2 beds 2 baths1,136 sq. ft.
111 Raintree Drive, CASSELBERRY, FL 32707
MLS# O6383751Listed by: RE/MAX TOWN & COUNTRY REALTY- Open Sat, 12 to 2pm
 $215,000Active2 beds 2 baths1,342 sq. ft.
975 Northern Dancer Way #101, CASSELBERRY, FL 32707
MLS# O6383213Listed by: KELLER WILLIAMS WINTER PARK  $500,000Pending5 beds 2 baths2,203 sq. ft.
361 Violet Dell, CASSELBERRY, FL 32707
MLS# O6382318Listed by: KELLER WILLIAMS ADVANTAGE III $229,000Active2 beds 1 baths819 sq. ft.
177 Hill Street, CASSELBERRY, FL 32707
MLS# O6382311Listed by: MORGAN PROPERTY SOLUTIONS INC $448,000Active3 beds 2 baths1,829 sq. ft.
30 Cornwall Court, CASSELBERRY, FL 32707
MLS# O6380911Listed by: VENCORP REAL ESTATE $365,000Pending3 beds 2 baths1,233 sq. ft.
4115 Buglers Rest Place, CASSELBERRY, FL 32707
MLS# O6353524Listed by: CREEGAN GROUP $238,000Active3 beds 2 baths1,151 sq. ft.
1140 Exceller Court #100, CASSELBERRY, FL 32707
MLS# O6381611Listed by: JASON MITCHELL REAL ESTATE FLO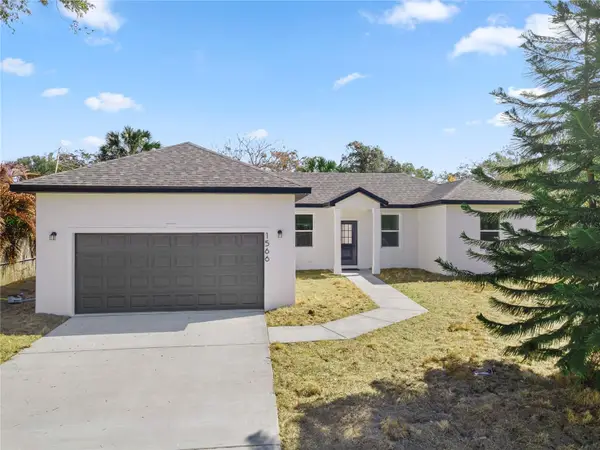 $415,000Active4 beds 2 baths1,598 sq. ft.
1566 Oak Lane, CASSELBERRY, FL 32707
MLS# O6381744Listed by: COMPASS FLORIDA LLC $265,000Active2 beds 2 baths1,199 sq. ft.
2530 Leeward Way, WINTER PARK, FL 32792
MLS# O6380907Listed by: WEMERT GROUP REALTY LLC $158,800Active2 beds 2 baths1,126 sq. ft.
610 Kenwick Circle #205, CASSELBERRY, FL 32707
MLS# O6380307Listed by: LPT REALTY, LLC $245,000Active2 beds 1 baths650 sq. ft.
620 Lilac Road, CASSELBERRY, FL 32707
MLS# O6381550Listed by: WESTIN REALTY GROUP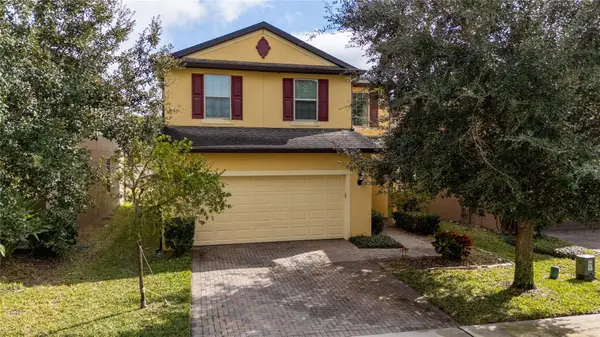 $439,000Pending3 beds 3 baths1,772 sq. ft.
247 Domus Lane, CASSELBERRY, FL 32707
MLS# O6381050Listed by: FUSILIER MANAGEMENT GROUP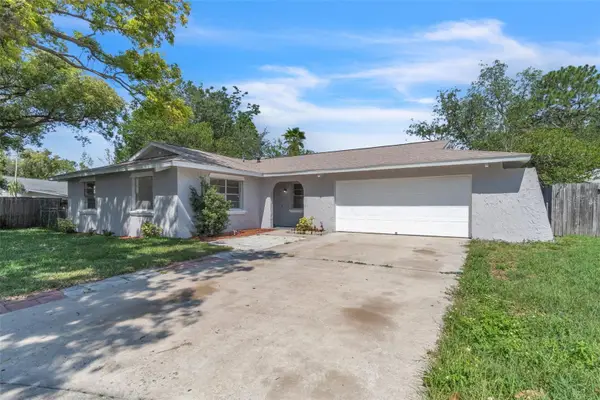 $365,000Active3 beds 2 baths1,383 sq. ft.
107 Thrush Lane, CASSELBERRY, FL 32707
MLS# O6380709Listed by: KELLER WILLIAMS ADVANTAGE III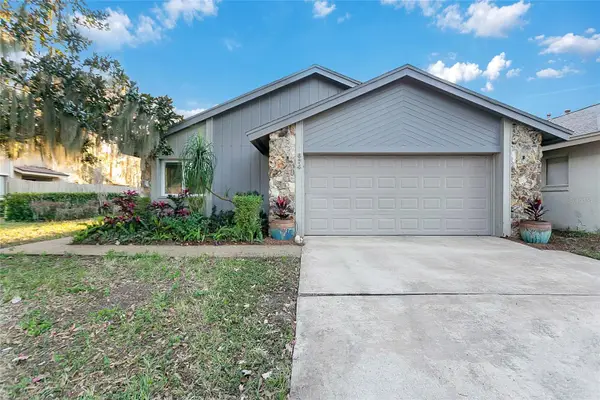 $650,000Active4 beds 2 baths2,289 sq. ft.
674 San Pablo Avenue, CASSELBERRY, FL 32707
MLS# O6380362Listed by: REAL BROKER, LLC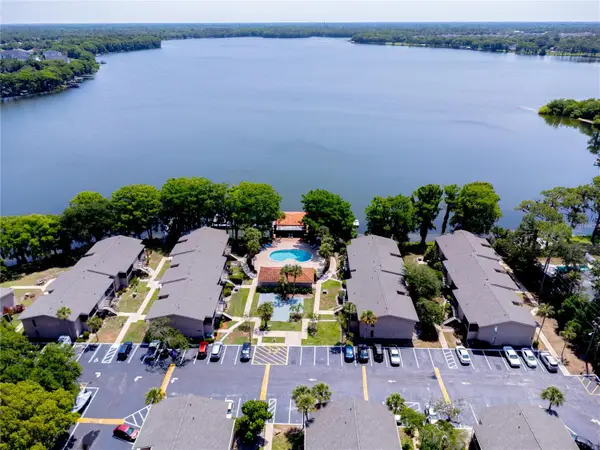 $149,700Pending2 beds 2 baths1,040 sq. ft.
1166 Paseo De Las Flores #A, CASSELBERRY, FL 32707
MLS# O6378850Listed by: SHAWFIELD REALTY GROUP $399,999Pending3 beds 2 baths1,747 sq. ft.
409 Ranch Trail, CASSELBERRY, FL 32707
MLS# G5107579Listed by: TOUCHSTONE REAL ESTATE $195,000Pending2 beds 2 baths1,126 sq. ft.
652 Kenwick Circle #105, CASSELBERRY, FL 32707
MLS# O6379122Listed by: CHARLES RUTENBERG REALTY ORLANDO $239,900Pending2 beds 3 baths1,194 sq. ft.
2954 Embassy Court, CASSELBERRY, FL 32707
MLS# O6378356Listed by: NESTA REAL ESTATE CONSULTANTS- Open Sun, 11am to 2pm
 $140,000Active1 beds 1 baths865 sq. ft.
1151 Paseo Del Sol #A, CASSELBERRY, FL 32707
MLS# S5143015Listed by: ROYAL REALTY REAL ESTATE, LLC  $189,900Active2 beds 2 baths1,126 sq. ft.
612 Kenwick Circle #103, CASSELBERRY, FL 32707
MLS# O6378275Listed by: SHAWFIELD REALTY GROUP $590,000Active4 beds 2 baths2,892 sq. ft.
2878 Willow Bay Terrace, CASSELBERRY, FL 32707
MLS# O6378162Listed by: COLDWELL BANKER REALTY $349,900Active4 beds 2 baths1,556 sq. ft.
526 E Foothill Way, CASSELBERRY, FL 32707
MLS# O6377991Listed by: KELLER WILLIAMS REALTY AT THE PARKS $139,900Pending3 beds 2 baths1,612 sq. ft.
432 Banyon Tree Circle #102, MAITLAND, FL 32751
MLS# S5142758Listed by: SHELDON PROFESSIONALS INC $360,000Active4 beds 2 baths2,444 sq. ft.
3685 Jericho Drive, CASSELBERRY, FL 32707
MLS# O6376284Listed by: PARKVIEW REAL ESTATE $489,900Pending3 beds 2 baths2,333 sq. ft.
3520 Jericho Drive, CASSELBERRY, FL 32707
MLS# O6376880Listed by: KELLER WILLIAMS ADVANTAGE REALTY $415,000Pending3 beds 2 baths1,708 sq. ft.
1663 Spicewood Lane, CASSELBERRY, FL 32707
MLS# O6377678Listed by: MAINFRAME REAL ESTATE $362,400Active3 beds 3 baths1,609 sq. ft.
984 Legacy Winds Way, CASSELBERRY, FL 32707
MLS# O6377555Listed by: COLDWELL BANKER RESIDENTIAL RE $279,900Active3 beds 3 baths1,565 sq. ft.
308 Coral Beach Circle, CASSELBERRY, FL 32707
MLS# O6377130Listed by: CLAIRE SCHWARTZ & ASSOCIATES $256,000Pending2 beds 2 baths1,271 sq. ft.
223 Ranier Cove #111, CASSELBERRY, FL 32707
MLS# O6376912Listed by: WATSON REALTY CORP $120,000Active2 beds 1 baths885 sq. ft.
1000 Lake Of The Woods Boulevard #103G, CASSELBERRY, FL 32730
MLS# O6376724Listed by: HOME WISE REALTY GROUP, INC. $132,000Active1 beds 1 baths768 sq. ft.
1000 Lake Of The Woods Boulevard #101F, CASSELBERRY, FL 32730
MLS# O6376714Listed by: KELLER WILLIAMS LEGACY REALTY $575,000Pending2 beds 2 baths1,944 sq. ft.
620 Lake Kathryn Circle, CASSELBERRY, FL 32707
MLS# OM717241Listed by: OCALA HOMES AND FARMS $151,997Active2 beds 2 baths1,126 sq. ft.
600 Kenwick Circle #202, CASSELBERRY, FL 32707
MLS# O6375655Listed by: PROSERVE REALTY GROUP LLC $270,000Active3 beds 2 baths1,050 sq. ft.
1952 Spring Street, WINTER PARK, FL 32792
MLS# O6373082Listed by: BEAR TEAM REAL ESTATE $499,900Active3 beds 2 baths2,026 sq. ft.
1077 Howell Harbor Drive, CASSELBERRY, FL 32707
MLS# O6375989Listed by: CFRP REALTY LLC $479,999Active4 beds 2 baths1,821 sq. ft.
1630 Sterling Oaks Lane, CASSELBERRY, FL 32707
MLS# O6375718Listed by: PM ELITE REALTY LLC $144,900Active2 beds 2 baths1,126 sq. ft.
646 Kenwick Circle #205, CASSELBERRY, FL 32707
MLS# R4910574Listed by: MAX 2 REALTY $255,000Pending2 beds 2 baths1,020 sq. ft.
2651 Cayman Way, WINTER PARK, FL 32792
MLS# O6375086Listed by: RE/MAX TOWN & COUNTRY REALTY $675,000Active5 beds 5 baths3,090 sq. ft.
1052 Laura Street, CASSELBERRY, FL 32707
MLS# O6374300Listed by: BLUE LIGHTHOUSE REALTY INC $415,000Active3 beds 2 baths1,415 sq. ft.
200 Carriage Hill Drive, CASSELBERRY, FL 32707
MLS# R4910548Listed by: HOMES UNLIMITED REAL ESTATE CORP $158,500Active2 beds 2 baths1,126 sq. ft.
602 Kenwick Circle #205, CASSELBERRY, FL 32707
MLS# O6368114Listed by: MARVIEW INTERNATIONAL REALTY LLC $239,900Pending3 beds 3 baths1,532 sq. ft.
156 Lago Vista Boulevard, CASSELBERRY, FL 32707
MLS# O6373568Listed by: RE/MAX TOWN CENTRE $149,900Active2 beds 2 baths1,126 sq. ft.
644 Kenwick Circle #204, CASSELBERRY, FL 32707
MLS# O6373376Listed by: WATSON REALTY CORP $239,000Active2 beds 3 baths1,260 sq. ft.
4000 Crossroads Place, CASSELBERRY, FL 32707
MLS# O6371779Listed by: SET HOMES REALTY LLC $364,900Active3 beds 3 baths1,682 sq. ft.
1552 Florentino Lane, WINTER PARK, FL 32792
MLS# O6371271Listed by: COLDWELL BANKER RESIDENTIAL RE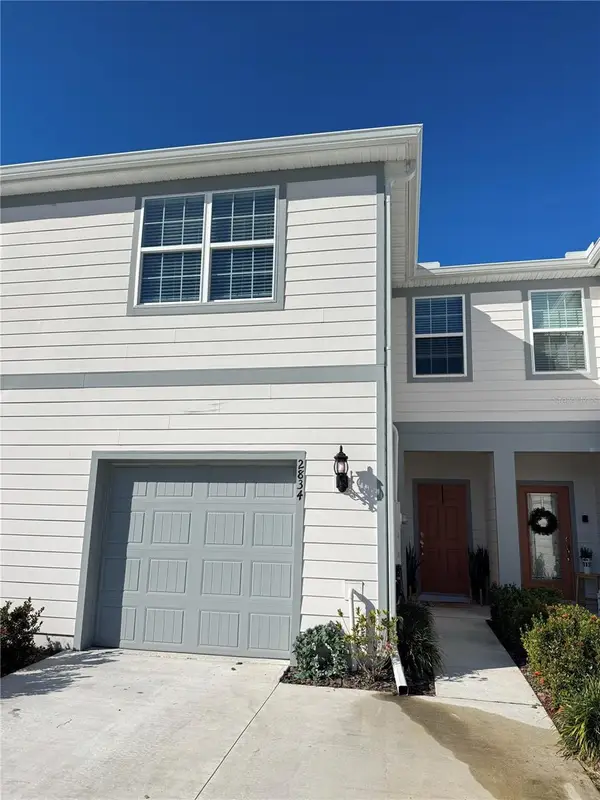 $424,000Active3 beds 3 baths1,907 sq. ft.
2834 Bright Bird Lane, WINTER PARK, FL 32792
MLS# O6372452Listed by: LIFESTYLE INTERNATIONAL REALTY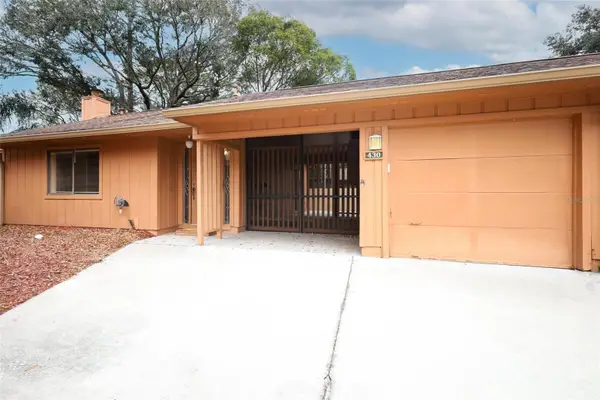 $299,999Pending3 beds 2 baths1,451 sq. ft.
430 Pinesong Drive, CASSELBERRY, FL 32707
MLS# O6366760Listed by: KELLER WILLIAMS ADVANTAGE REALTY $395,000Pending3 beds 4 baths2,278 sq. ft.
1737 Grand Rue Drive, CASSELBERRY, FL 32707
MLS# O6369765Listed by: WEMERT GROUP REALTY LLC $389,900Active3 beds 2 baths1,620 sq. ft.
70 S Winter Park Drive, CASSELBERRY, FL 32707
MLS# O6370355Listed by: BEYCOME OF FLORIDA LLC $119,900Active2 beds 1 baths885 sq. ft.
1000 Lake Of The Woods Boulevard #104A, CASSELBERRY, FL 32730
MLS# V4946475Listed by: HOME WISE REALTY GROUP, INC. $279,000Active3 beds 2 baths1,800 sq. ft.
700 N Winter Park Drive, CASSELBERRY, FL 32707
MLS# O6368981Listed by: NONA LEGACY POWERED BY LA ROSA $217,000Active3 beds 2 baths1,344 sq. ft.
520 Georgetown Drive, CASSELBERRY, FL 32707
MLS# O6364855Listed by: BLAIR REALTY GROUP INC $165,500Active2 beds 2 baths1,126 sq. ft.
602 Kenwick Circle #202, CASSELBERRY, FL 32707
MLS# O6366079Listed by: MARVIEW INTERNATIONAL REALTY LLC $444,900Active3 beds 3 baths1,782 sq. ft.
1951 Canny Cove, WINTER PARK, FL 32792
MLS# O6367023Listed by: LPT REALTY, LLC $195,000Pending2 beds 2 baths1,002 sq. ft.
165 Post Way, CASSELBERRY, FL 32707
MLS# O6367304Listed by: RE/MAX TOWN & COUNTRY REALTY $175,000Active3 beds 2 baths1,428 sq. ft.
2423 Branch Way #207, MAITLAND, FL 32751
MLS# G5105483Listed by: MORRIS REALTY AND INVESTMENTS- Open Sun, 11am to 2pm
 $519,000Active3 beds 2 baths1,442 sq. ft.
209 NE Triplet Drive, CASSELBERRY, FL 32707
MLS# O6361616Listed by: EXIT REALTY PREMIER LEGACY - Open Sun, 2 to 4pm
 $244,000Active2 beds 2 baths1,166 sq. ft.
4008 W Maryland Place, CASSELBERRY, FL 32707
MLS# O6366581Listed by: LPT REALTY, LLC 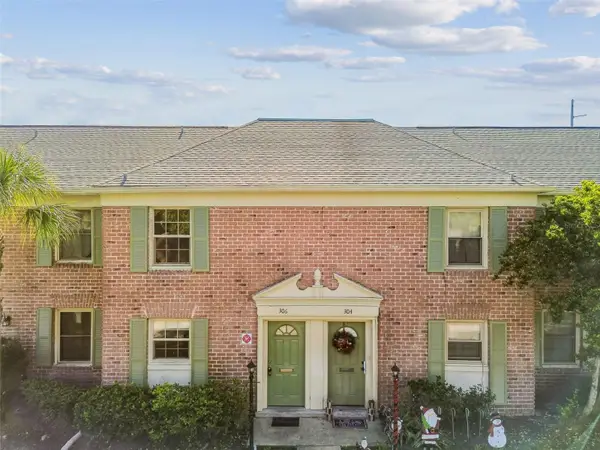 $189,900Active2 beds 3 baths1,248 sq. ft.
306 Georgetown Dr #306, CASSELBERRY, FL 32707
MLS# O6365917Listed by: HOMEVEST REALTY $119,000Active1 beds 1 baths759 sq. ft.
480 Banyon Tree Circle #102, MAITLAND, FL 32751
MLS# C7517886Listed by: BENOIT MANAGEMENT LLC $649,900Pending4 beds 3 baths3,270 sq. ft.
617 Legacy Park Drive, CASSELBERRY, FL 32707
MLS# O6364175Listed by: YOUNG REAL ESTATE $1,450,000Active2.17 Acres
417 Rain Lily Cove, CASSELBERRY, FL 32707
MLS# O6363226Listed by: JOHN SADRI & COMPANY $147,900Active1 beds 1 baths690 sq. ft.
474 C Street, CASSELBERRY, FL 32707
MLS# S5139143Listed by: LA ROSA REALTY KISSIMMEE $599,900Pending9 beds 5 baths3,460 sq. ft.
395 Piney Ridge Road, CASSELBERRY, FL 32707
MLS# O6362026Listed by: REDFIN CORPORATION $549,000Active4 beds 3 baths2,412 sq. ft.
1289 Ash Tree Cove, CASSELBERRY, FL 32707
MLS# S5138860Listed by: CHARLES RUTENBERG REALTY ORLANDO $160,000Active2 beds 1 baths891 sq. ft.
117 Georgetown Drive #B, CASSELBERRY, FL 32707
MLS# O6361877Listed by: COLDWELL BANKER RESIDENTIAL RE $369,500Active3 beds 2 baths1,694 sq. ft.
523 Sundown Trail, CASSELBERRY, FL 32707
MLS# O6359761Listed by: RE/MAX TOWN & COUNTRY REALTY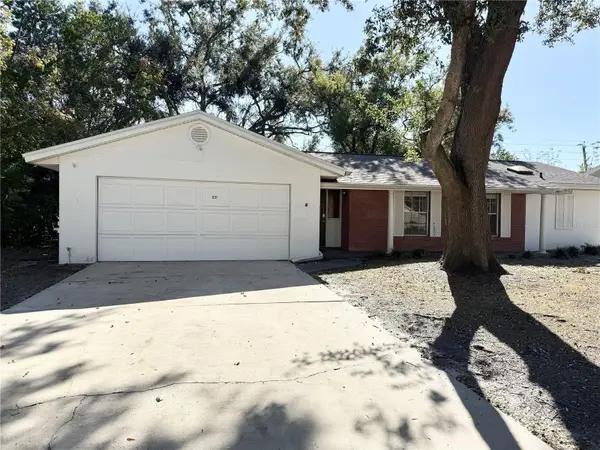 $368,000Active4 beds 2 baths1,641 sq. ft.
1231 Avalon Boulevard, CASSELBERRY, FL 32707
MLS# O6363567Listed by: RP INVESTMENT REALTY LLC $150,000Active1 beds 1 baths690 sq. ft.
492 B Street, CASSELBERRY, FL 32707
MLS# O6356537Listed by: LPT REALTY, LLC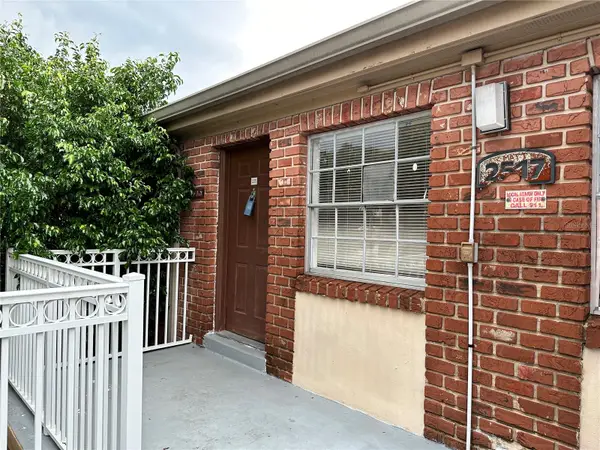 $120,000Active1 beds 1 baths550 sq. ft.
2517 Caper Lane #205, MAITLAND, FL 32751
MLS# O6358434Listed by: MAYOLET REALTY LLC $320,000Active3 beds 2 baths1,719 sq. ft.
2401 Antilles Drive, WINTER PARK, FL 32792
MLS# O6357934Listed by: KELLER WILLIAMS REALTY AT THE PARKS $344,900Active3 beds 2 baths1,287 sq. ft.
800 Diane Circle, CASSELBERRY, FL 32707
MLS# O6357379Listed by: WESTIN REALTY GROUP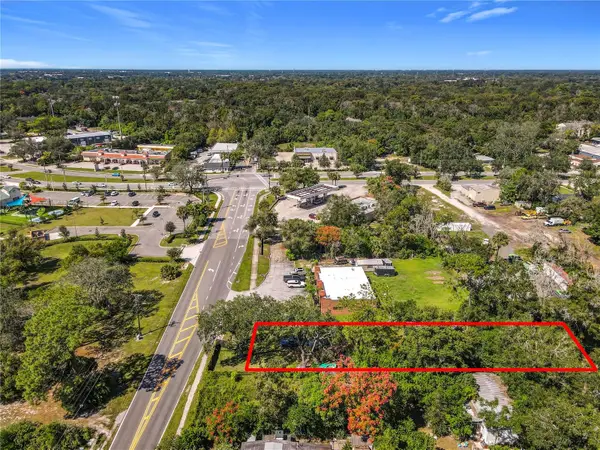 $154,000Active0.22 Acres
1329 Lake Drive, CASSELBERRY, FL 32707
MLS# O6352721Listed by: CALL IT CLOSED INTL REALTY $150,000Active2 beds 1 baths1,416 sq. ft.
670 Bayou Drive, CASSELBERRY, FL 32707
MLS# S5136716Listed by: PRESTIGE REALTY GROUP LLC $179,000Active2 beds 2 baths1,126 sq. ft.
636 Kenwick Circle #105, CASSELBERRY, FL 32707
MLS# O6348368Listed by: PREFERRED REAL ESTATE BROKERS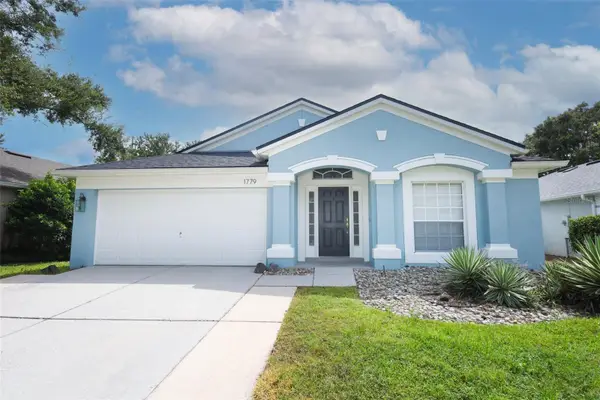 $450,000Pending4 beds 2 baths1,959 sq. ft.
1779 Laurel Brook Loop, CASSELBERRY, FL 32707
MLS# O6346521Listed by: KELLER WILLIAMS ADVANTAGE REALTY $279,800Pending0.43 Acres
Lake Howell Road, MAITLAND, FL 32751
MLS# O6346556Listed by: CHARLES RUTENBERG REALTY ORLANDO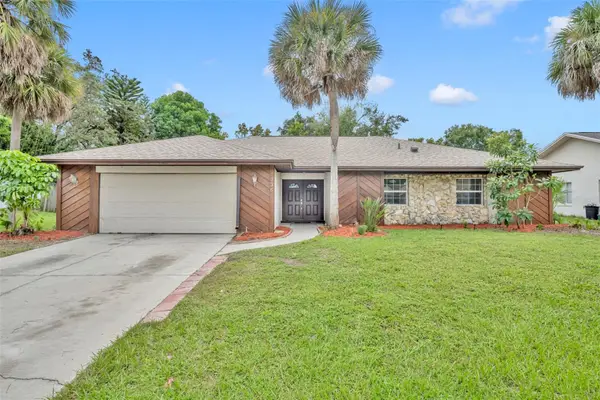 $389,000Pending3 beds 2 baths1,513 sq. ft.
335 Sandpiper Drive, CASSELBERRY, FL 32707
MLS# O6345953Listed by: ENGEL & VOLKERS ORLANDO DR PHILLIPS $310,000Active3 beds 3 baths1,333 sq. ft.
1934 Fenwick Way, CASSELBERRY, FL 32707
MLS# S5134531Listed by: GOLDEN KEY HOMES REALTY INC $145,000Active3 beds 2 baths1,428 sq. ft.
448 Banyon Tree Circle #206, MAITLAND, FL 32751
MLS# O6337500Listed by: MIAMI TANGO INVESTMENTS REALTY $408,000Pending3 beds 2 baths1,602 sq. ft.
351 Lilac Road, CASSELBERRY, FL 32707
MLS# O6334056Listed by: PREMIUM PROPERTIES R.E. SERVICE $135,000Pending0.4 Acres
N Triplet Lake Drive, CASSELBERRY, FL 32707
MLS# O6318988Listed by: ROYALTY R E BOUTIQUE INC $550,000Pending4 beds 4 baths2,501 sq. ft.
1916 Mitchellbrook Ln, CASSELBERRY, FL 32707
MLS# O6329764Listed by: INFINITY REAL ESTATE GROUP $390,000Pending4 beds 4 baths1,968 sq. ft.
553 Sunbranch Lane, CASSELBERRY, FL 32707
MLS# O6330040Listed by: COLDWELL BANKER REALTY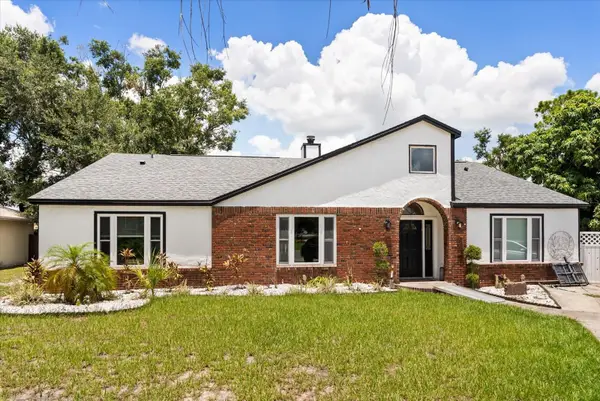 $548,990Pending4 beds 5 baths3,068 sq. ft.
2236 Winslow Circle, CASSELBERRY, FL 32707
MLS# O6329071Listed by: BROKER HUB REALTY GROUP LLC $354,000Active3 beds 2 baths1,352 sq. ft.
230 S Embrey Drive, CASSELBERRY, FL 32707
MLS# O6326252Listed by: CITARELLI REALTY GROUP LLC $300,000Active3 beds 2 baths1,216 sq. ft.
730 Seminola Boulevard, CASSELBERRY, FL 32707
MLS# O6323462Listed by: A2Z REALTY GROUP $289,900Pending3 beds 2 baths1,388 sq. ft.
360 Kentia Road, CASSELBERRY, FL 32707
MLS# R4909468Listed by: EXCLUSIVE REAL ESTATE $400,000Active4 beds 2 baths1,966 sq. ft.
254 Oak Park Place, CASSELBERRY, FL 32707
MLS# O6308015Listed by: ROBERTS & ROBERTS REALTY INC $529,000Active4 beds 3 baths2,412 sq. ft.
1251 Ash Tree Cove, CASSELBERRY, FL 32707
MLS# S5126272Listed by: CHARLES RUTENBERG REALTY ORLANDO $319,900Active3 beds 3 baths1,803 sq. ft.
2487 Harbour Way, WINTER PARK, FL 32792
MLS# O6303931Listed by: WRA BUSINESS & REAL ESTATE $249,900Active2 beds 2 baths1,137 sq. ft.
1162 Carmel Circle #440, CASSELBERRY, FL 32707
MLS# O6296657Listed by: MARKET CONNECT REALTY LLC $120,000Active1 beds 1 baths759 sq. ft.
480 Banyon Tree Circle #100, MAITLAND, FL 32751
MLS# O6294907Listed by: MIAMI TANGO INVESTMENTS REALTY $600,000Active5 beds 3 baths2,654 sq. ft.
352 Misty Oaks Run, CASSELBERRY, FL 32707
MLS# O6286664Listed by: COLDWELL BANKER REALTY $311,000Active3 beds 2 baths1,344 sq. ft.
250 Raintree Drive, CASSELBERRY, FL 32707
MLS# O6287830Listed by: KONA REALTY SERVICES LLC $539,000Active4 beds 3 baths2,412 sq. ft.
1252 Ash Tree Cove, CASSELBERRY, FL 32707
MLS# S5120542Listed by: CHARLES RUTENBERG REALTY ORLANDO $129,000Pending1 beds 1 baths722 sq. ft.
208 Diamond Cv #104, CASSELBERRY, FL 32707
MLS# O6277366Listed by: REAL BROKER, LLC $235,000Active3 beds 2 baths1,406 sq. ft.
416 Banyon Tree Circle #108, MAITLAND, FL 32751
MLS# O6311249Listed by: VENCORP REAL ESTATE $625,000Active4 beds 4 baths2,773 sq. ft.
1278 Snug Harbor Drive, CASSELBERRY, FL 32707
MLS# O6244913Listed by: APPLE REALTY
Local realty services provided by:CENTURY 21 Results
The information being provided by Stellar Mls is for the consumer's personal, non-commercial use and may not be used for any purpose other than to identify prospective properties consumer may be interested in purchasing. Any information relating to real estate for sale referenced on this web site comes from the Internet Data Exchange (IDX) program of the Stellar Mls. CENTURY 21 Results is not a Multiple Listing Service (MLS), nor does it offer MLS access. This website is a service of CENTURY 21 Results, a broker participant of Stellar Mls. This web site may reference real estate listing(s) held by a brokerage firm other than the broker and/or agent who owns this web site.
The accuracy of all information, regardless of source, including but not limited to open house information, square footages and lot sizes, is deemed reliable but not guaranteed and should be personally verified through personal inspection by and/or with the appropriate professionals. The data contained herein is copyrighted by Stellar Mls and is protected by all applicable copyright laws. Any unauthorized dissemination of this information is in violation of copyright laws and is strictly prohibited.
Properties in listings may have been sold or may no longer be available.
Copyright 2026 Stellar Mls. All rights reserved.
Neighborhoods near Casselberry, FL
Zip codes near Casselberry, FL
- 32701 homes for sale
- 32707 homes for sale
- 32708 homes for sale
- 32714 homes for sale
- 32730 homes for sale
- 32746 homes for sale
- 32750 homes for sale
- 32751 homes for sale
- 32765 homes for sale
- 32773 homes for sale
- 32779 homes for sale
- 32789 homes for sale
- 32792 homes for sale
- 32801 homes for sale
- 32803 homes for sale
- 32804 homes for sale
- 32807 homes for sale
- 32810 homes for sale
- 32814 homes for sale
- 32817 homes for sale
Popular searches near Casselberry, FL
- Altamonte Springs homes for sale
- Azalea Park homes for sale
- Black Hammock homes for sale
- Casselberry-Altamonte Springs homes for sale
- Eatonville homes for sale
- Fairview Shores homes for sale
- Fern Park homes for sale
- Forest City homes for sale
- Goldenrod homes for sale
- Heathrow homes for sale
- Lake Mary homes for sale
- Lockhart homes for sale
- Longwood homes for sale
- Maitland homes for sale
- Oviedo homes for sale
- Union Park homes for sale
- University homes for sale
- Wekiwa Springs homes for sale
- Winter Park homes for sale
- Winter Springs homes for sale
Protect your home and budget from life's surprises with an Assurant Home Warranty, backed by a partner that supports you through every step of homeownership. Explore Plans.
©2026 Century 21 Real Estate LLC. All rights reserved. CENTURY 21®, the CENTURY 21 Logo and C21® are service marks owned by Century 21 Real Estate LLC. Century 21 Real Estate LLC fully supports the principles of the Fair Housing Act and the Equal Opportunity Act. Each office is independently owned and operated. Listing information is deemed reliable but not guaranteed accurate.