- Cloverhill, Nashville homes for sale
- Connell, Goodlettsville homes for sale
- Donelson, Hermitage homes for sale
- East Nashville, Nashville homes for sale
- Eastwood, Nashville homes for sale
- Fairvue Plantation, Gallatin homes for sale
- Five Oaks, Lebanon homes for sale
- Historic Old Hickory Village, Old Hickory homes for sale
- Inglewood, Nashville homes for sale
- Lakewood, Old Hickory homes for sale
- Madison, Madison homes for sale
- Nashboro Village, Nashville homes for sale
- Neely's Bend, Madison homes for sale
- Parkwood, Goodlettsville homes for sale
- Providence, Mount Juliet homes for sale
- Rosebank, Nashville homes for sale
- South Inglewood, Nashville homes for sale
- Sunset View, Nashville homes for sale
- Trinity RV Park, Nashville homes for sale
- Una, Nashville homes for sale
Castalian Springs, TN - homes for sale
9 of 9 results displayed
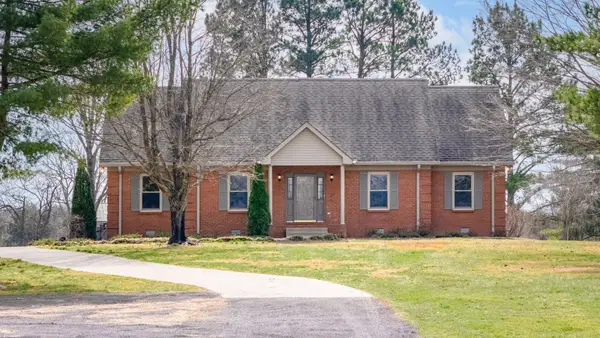 $879,000Active4 beds 3 baths2,815 sq. ft.
300A Governor Hall Rd, Castalian Springs, TN 37031
MLS# 3143222Listed by: COMPASS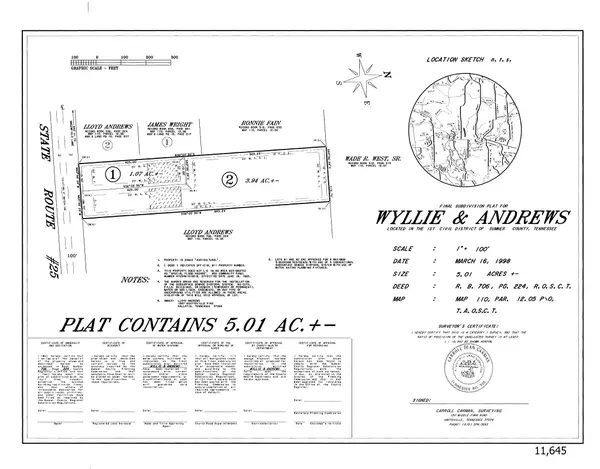 $245,000Active3.94 Acres
0 Hartsville Pike, Castalian Springs, TN 37031
MLS# 3137052Listed by: HALO REALTY, LLC $649,900Active3 beds 4 baths3,731 sq. ft.
1019 Hilton Ln, Castalian Springs, TN 37031
MLS# 3136176Listed by: EXIT REAL ESTATE SOLUTIONS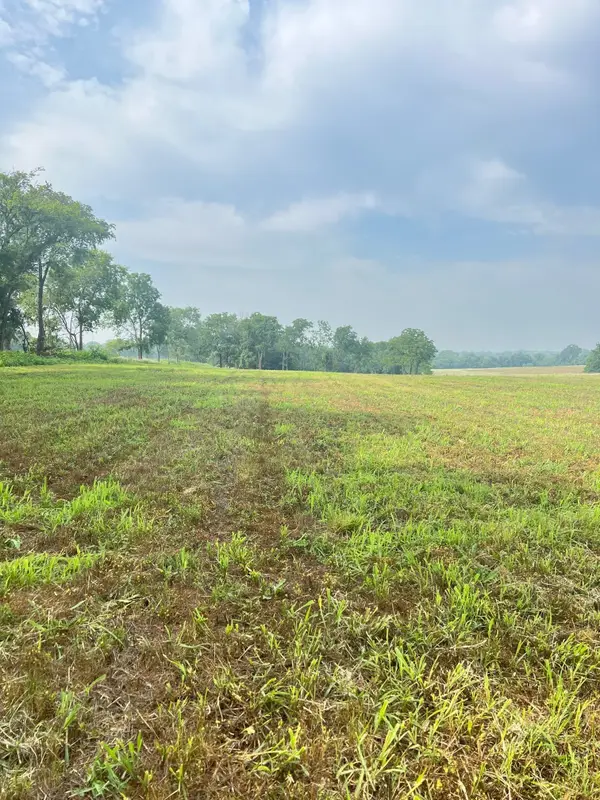 $349,900Active6.6 Acres
2716 Hartsville Pike, Castalian Springs, TN 37031
MLS# 3132093Listed by: RELIANT REALTY ERA POWERED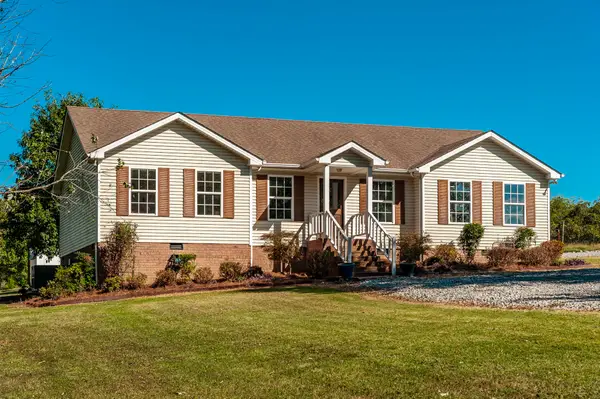 $490,000Active3 beds 2 baths1,639 sq. ft.
531 Governor Hall Rd, Castalian Springs, TN 37031
MLS# 3122051Listed by: BENCHMARK REALTY, LLC $525,000Active3 beds 2 baths2,145 sq. ft.
101 Emerald Valley Ct, Castalian Springs, TN 37031
MLS# 3049083Listed by: MARK SPAIN REAL ESTATE $379,900Active3 beds 2 baths1,969 sq. ft.
3436 Hartsville Pike, Castalian Springs, TN 37031
MLS# 3035716Listed by: KELLER WILLIAMS REALTY $599,000Active3 beds 4 baths3,050 sq. ft.
1141 Littleton Ranch Rd, Castalian Springs, TN 37031
MLS# 3035641Listed by: BERKSHIRE HATHAWAY HOMESERVICES WOODMONT REALTY $2,900,000Active-- beds -- baths
1201 Old Hopewell Rd, Castalian Springs, TN 37031
MLS# 2562759Listed by: RE/MAX CHOICE PROPERTIES
Local realty services provided by:CENTURY 21 Premier
Neighborhoods near Castalian Springs, TN
Zip codes near Castalian Springs, TN
- 37022 homes for sale
- 37030 homes for sale
- 37031 homes for sale
- 37048 homes for sale
- 37057 homes for sale
- 37066 homes for sale
- 37074 homes for sale
- 37075 homes for sale
- 37076 homes for sale
- 37083 homes for sale
- 37087 homes for sale
- 37090 homes for sale
- 37122 homes for sale
- 37138 homes for sale
- 37145 homes for sale
- 37148 homes for sale
- 37151 homes for sale
- 37186 homes for sale
- 37188 homes for sale
- 38563 homes for sale
Popular searches near Castalian Springs, TN
- Adolphus homes for sale
- Bethpage homes for sale
- Bransford homes for sale
- Cottontown homes for sale
- Dixon Springs homes for sale
- Gallatin homes for sale
- Green Hill homes for sale
- Hartsville homes for sale
- Hartsville/Trousdale County homes for sale
- Hendersonville homes for sale
- Lafayette homes for sale
- Lebanon homes for sale
- Mt. Juliet homes for sale
- New Deal homes for sale
- Portland homes for sale
- Riddleton homes for sale
- Shackle Island homes for sale
- Walnut Grove homes for sale
- Westmoreland homes for sale
- Westmoreland homes for sale
Protect your home and budget from life's surprises with an Assurant Home Warranty, backed by a partner that supports you through every step of homeownership. Explore Plans.
©2026 Century 21 Real Estate LLC. All rights reserved. CENTURY 21®, the CENTURY 21 Logo and C21® are service marks owned by Century 21 Real Estate LLC. Century 21 Real Estate LLC fully supports the principles of the Fair Housing Act and the Equal Opportunity Act. Each office is independently owned and operated. Listing information is deemed reliable but not guaranteed accurate.