- Central Business District, Provo homes for sale
- Dixon, Provo homes for sale
- Foothills, Provo homes for sale
- Fort Utah, Provo homes for sale
- Franklin, Provo homes for sale
- Franklin South, Provo homes for sale
- Grandview South, Provo homes for sale
- Joaquin, Provo homes for sale
- Lakeview North, Provo homes for sale
- Lakeview South, Provo homes for sale
- Lakewood, Provo homes for sale
- Maeser, Provo homes for sale
- North Park, Provo homes for sale
- Provo Bay, Provo homes for sale
- Provost, Provo homes for sale
- Provost South, Provo homes for sale
- Rivergrove, Provo homes for sale
- Spring Creek, Provo homes for sale
- Sunset, Provo homes for sale
- Timp, Provo homes for sale
Centerfield, UT - homes for sale
17 of 17 results displayed
- New
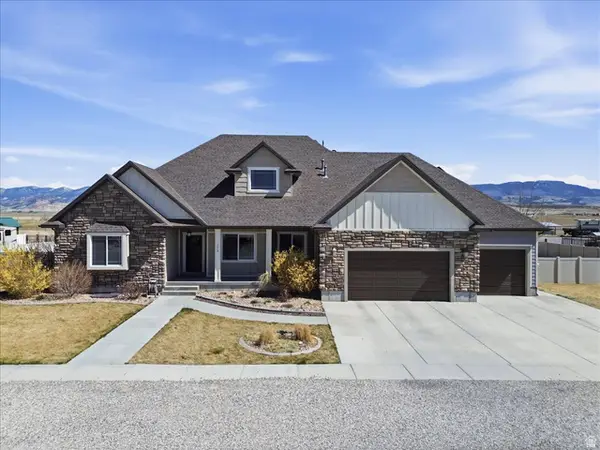 $750,000Active6 beds 5 baths4,755 sq. ft.
175 S 500 E, Centerfield, UT 84622
MLS# 2145972Listed by: EXP REALTY, LLC  $500,000Pending6 beds 4 baths4,204 sq. ft.
310 S 100 W, Centerfield, UT 84622
MLS# 2143357Listed by: EQUITY REAL ESTATE (RESULTS) $439,000Active3 beds 2 baths1,920 sq. ft.
170 N 100 W, Centerfield, UT 84622
MLS# 2141913Listed by: SIMPLE CHOICE REAL ESTATE $185,000Active2 beds 1 baths775 sq. ft.
50 N Main St, Centerfield, UT 84622
MLS# 2137785Listed by: CENTURY 21 ESSENTIALS REALTY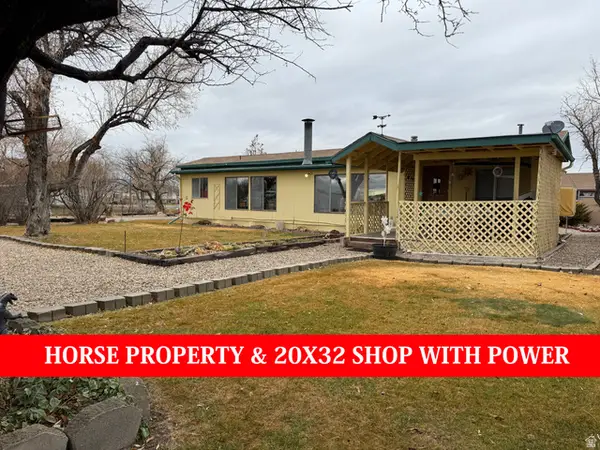 $319,000Active2 beds 2 baths1,598 sq. ft.
350 E 200 N, Centerfield, UT 84622
MLS# 2135813Listed by: PRESIDIO REAL ESTATE (RIVER HEIGHTS)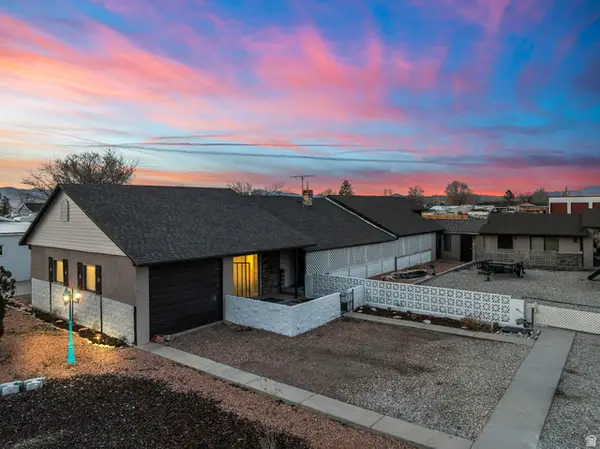 $379,999Active4 beds 3 baths2,500 sq. ft.
50 W 100 S, Centerfield, UT 84622
MLS# 2132293Listed by: ERA BROKERS CONSOLIDATED (UTAH COUNTY)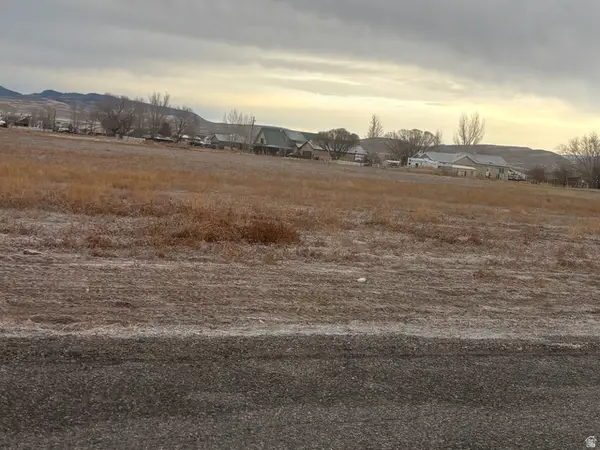 $399,000Active20.88 Acres
350 S 400 E, Centerfield, UT 84622
MLS# 2130871Listed by: EQUITY REAL ESTATE (PROSPER GROUP) $450,000Pending4 beds 2 baths1,903 sq. ft.
90 N 100 E, Centerfield, UT 84622
MLS# 2128743Listed by: EXP REALTY, LLC $398,000Active4 beds 3 baths3,504 sq. ft.
10 N Main St, Centerfield, UT 84622
MLS# 2128519Listed by: EXP REALTY, LLC $465,000Pending4 beds 2 baths2,208 sq. ft.
150 S 200 E, Centerfield, UT 84622
MLS# 2127102Listed by: EQUITY REAL ESTATE (PROSPER GROUP) $275,000Active3 beds 2 baths1,296 sq. ft.
130 E 470 N, Centerfield, UT 84622
MLS# 2125247Listed by: ERA BROKERS CONSOLIDATED (RICHFIELD BRANCH) $299,900Active6.07 Acres
350 S 200 E, Centerfield, UT 84622
MLS# 2119040Listed by: EQUITY REAL ESTATE (PROSPER GROUP) $473,000Pending4 beds 3 baths2,536 sq. ft.
35 N 270 E, Centerfield, UT 84622
MLS# 2114186Listed by: CENTRAL UTAH PROFESSIONAL REALTY
 $514,000Active4 beds 3 baths2,520 sq. ft.
130 E 300 N, Centerfield, UT 84622
MLS# 2110070Listed by: CENTURY 21 ESSENTIALS REALTY $50,000Pending0.5 Acres
170 N 100 W #2, Centerfield, UT 84622
MLS# 2104173Listed by: FATHOM REALTY (OREM) $500,000Pending3 beds 3 baths3,600 sq. ft.
185 W 200 N, Centerfield, UT 84622
MLS# 2100439Listed by: PLATINUM REAL ESTATE PROFESSIONALS, PLLC $349,900Active4 beds 2 baths1,600 sq. ft.
115 E 470 N, Centerfield, UT 84622
MLS# 2065551Listed by: IN DEPTH REALTY
Local realty services provided by:CENTURY 21 Naomi
Neighborhoods near Centerfield, UT
Zip codes near Centerfield, UT
- 84620 homes for sale
- 84622 homes for sale
- 84623 homes for sale
- 84624 homes for sale
- 84627 homes for sale
- 84630 homes for sale
- 84634 homes for sale
- 84636 homes for sale
- 84639 homes for sale
- 84642 homes for sale
- 84643 homes for sale
- 84646 homes for sale
- 84652 homes for sale
- 84654 homes for sale
- 84656 homes for sale
- 84657 homes for sale
- 84662 homes for sale
- 84665 homes for sale
- 84667 homes for sale
- 84701 homes for sale
Popular searches near Centerfield, UT
- Aurora homes for sale
- Delta homes for sale
- Ephraim homes for sale
- Ephraim-Manti homes for sale
- Fayette homes for sale
- Fillmore homes for sale
- Glenwood homes for sale
- Gunnison homes for sale
- Holden homes for sale
- Levan homes for sale
- Manti homes for sale
- Mayfield homes for sale
- Redmond homes for sale
- Richfield homes for sale
- Salina homes for sale
- Scipio homes for sale
- Sigurd homes for sale
- Spring City homes for sale
- Sterling homes for sale
- Wales homes for sale
Protect your home and budget from life's surprises with an Assurant Home Warranty, backed by a partner that supports you through every step of homeownership. Explore Plans.
©2026 Century 21 Real Estate LLC. All rights reserved. CENTURY 21®, the CENTURY 21 Logo and C21® are service marks owned by Century 21 Real Estate LLC. Century 21 Real Estate LLC fully supports the principles of the Fair Housing Act and the Equal Opportunity Act. Each office is independently owned and operated. Listing information is deemed reliable but not guaranteed accurate.