- Central Hollywood, Los Angeles homes for sale
- Dayton Heights, Los Angeles homes for sale
- Downtown Hollywood, Los Angeles homes for sale
- East Hollywood, Los Angeles homes for sale
- Hel-Mel, Los Angeles homes for sale
- Hollywood Studio District, Los Angeles homes for sale
- Kingsley Vista, Los Angeles homes for sale
- Larchmont, Los Angeles homes for sale
- Larchmont Heights, Los Angeles homes for sale
- Lincoln Heights, Los Angeles homes for sale
- Little Armenia, Los Angeles homes for sale
- Little Bangladesh, Los Angeles homes for sale
- Melrose Hill, Los Angeles homes for sale
- Normandie Heights, Los Angeles homes for sale
- Saint Andrews Square, Los Angeles homes for sale
- Sunset Junctions, Los Angeles homes for sale
- Thai Town, Los Angeles homes for sale
- Theater Row, Los Angeles homes for sale
- Virgil Village, Los Angeles homes for sale
- Windsor Square, Los Angeles homes for sale
Central Los Angeles, Los Angeles, CA - homes for sale
176 of 176 results displayed
- New
 $3,300,000Active0.34 Acres
734 S Manhattan Place, Los Angeles, CA 90005
MLS# CL26672299Listed by: REALTY INVESTMENT ADVISORS, INC. - New
 $900,000Active0.17 Acres
439 N Commonwealth Avenue, Los Angeles, CA 90004
MLS# CL26671599Listed by: SOTHEBY'S INTERNATIONAL REALTY - New
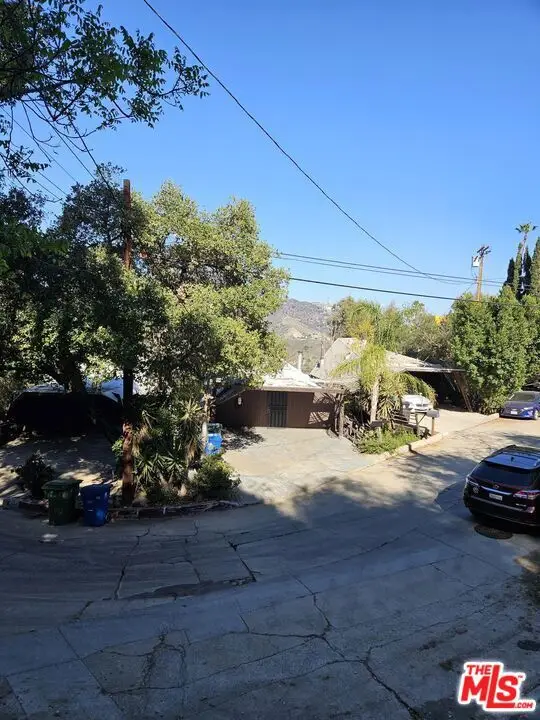
 $150,000Active0.62 Acres
0 Hargrave Drive, Los Angeles, CA 90068
MLS# 26671973Listed by: COLDWELL BANKER REALTY - New
 $1,895,000Active0 Acres
144 S Catalina, Los Angeles, CA 90004
MLS# SR26068419Listed by: SYNC BROKERAGE - New
 $1,100,000Active0 Acres
2113 W Court, Los Angeles, CA 90026
MLS# PW26067979Listed by: T.N.G. REAL ESTATE CONSULTANTS - New
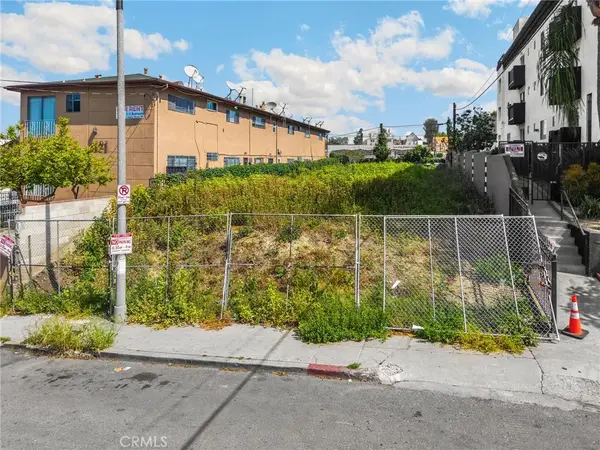
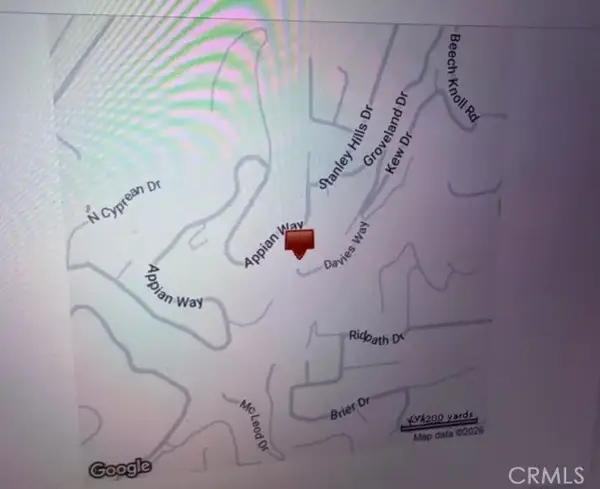 $350,000Active0 Acres
0 Appian, Los Angeles, CA 90046
MLS# WS26068573Listed by: 1 STOP REALTY LLC - New
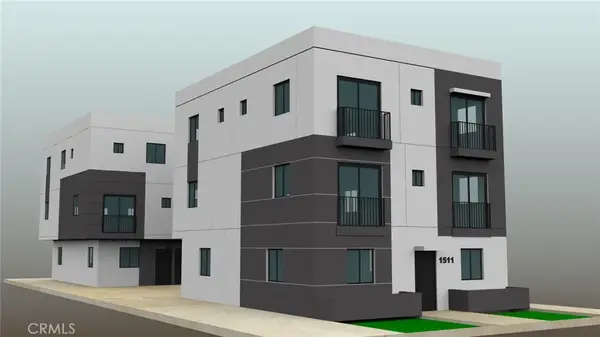 $1,195,000Active0 Acres
1511 S New Hampshire, Los Angeles, CA 90006
MLS# SR26068379Listed by: SYNC BROKERAGE - New
 $1,450,000Active0.16 Acres
1627 Oak Street, Los Angeles, CA 90015
MLS# 26670455Listed by: KELLER WILLIAMS BEVERLY HILLS - New
 $249,000Active0.15 Acres
2890 Belden, Los Angeles, CA 90068
MLS# CL26670865Listed by: COLDWELL BANKER REALTY - New
 $1,999,000Active0.17 Acres
1547 Sunset Plaza Drive, Los Angeles, CA 90069
MLS# CL26670611Listed by: CHRISTIE'S INTERNATIONAL REAL ESTATE SOCAL - New
 $349,943Active0 Acres
1014 Bartlett, Los Angeles, CA 90012
MLS# BB26065686Listed by: BRAD KORB REAL ESTATE GROUP - New
 $695,000Active0.13 Acres
616 N Alvarado Street, Los Angeles, CA 90026
MLS# 26668091Listed by: PRIME ROCK REALTY - New
 $399,000Active0.41 Acres
8441 Grand View, Los Angeles, CA 90046
MLS# CRSR26061850Listed by: BERKSHIRE HATHAWAY HOMESERVICES CALIFORNIA PROPERTIES - New
 $59,900Active0.05 Acres
6893 Pacific View Drive, Los Angeles, CA 90068
MLS# CL26668893Listed by: BERKSHIRE HATHAWAY HOMESERVICES CALIFORNIA PROPERTIES  $14,300,000Active0.34 Acres
705 S Serrano Avenue, Los Angeles, CA 90005
MLS# CL26665135Listed by: URBAN REAL ESTATE, INC. $14,300,000Active0.28 Acres
715 S Serrano Avenue, Los Angeles, CA 90005
MLS# CL26665159Listed by: URBAN REAL ESTATE, INC. $960,000Active0.53 Acres
2280 Glendale Boulevard, Los Angeles, CA 90039
MLS# CL26666315Listed by: DOUGLAS ELLIMAN $3,295,000Active0.29 Acres
807 Waterloo Street, Los Angeles, CA 90026
MLS# CL26667183Listed by: REALTY INVESTMENT ADVISORS, INC. $2,699,999Active0.2 Acres
1020 N Ardmore Avenue, Los Angeles, CA 90029
MLS# CL26667277Listed by: KELLER WILLIAMS HOLLYWOOD HILLS $975,000Active0.38 Acres
2231 Moore Street, Los Angeles, CA 90039
MLS# 26665793Listed by: COLDWELL BANKER REALTY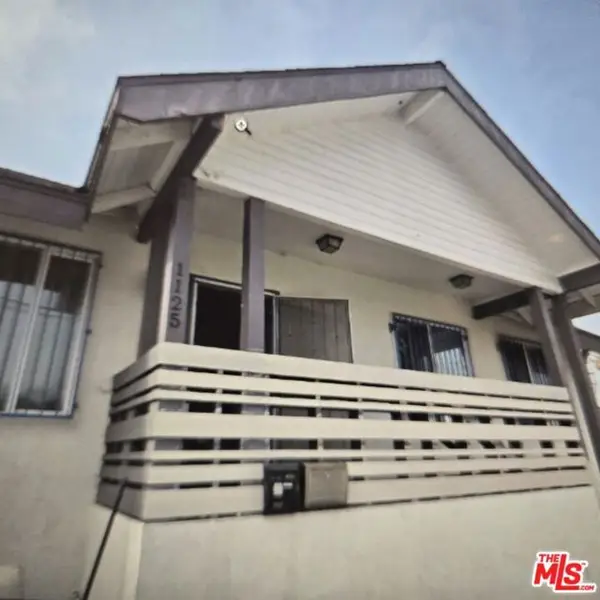 $1,099,000Active0.14 Acres
1125 Irolo Street, Los Angeles, CA 90006
MLS# CL26665425Listed by: WIN REALTY & PROPERTIES $999,000Active0.14 Acres
1121 Irolo Street, Los Angeles, CA 90006
MLS# 26665411Listed by: WIN REALTY & PROPERTIES $2,300,000Active0.17 Acres
627 N Juanita Avenue, Los Angeles, CA 90004
MLS# CL26664283Listed by: DAVID BALLIN KAUFMAN $3,450,000Active0.13 Acres
9442 Sierra Mar Place, Los Angeles, CA 90069
MLS# 26659737Listed by: CAROLWOOD ESTATES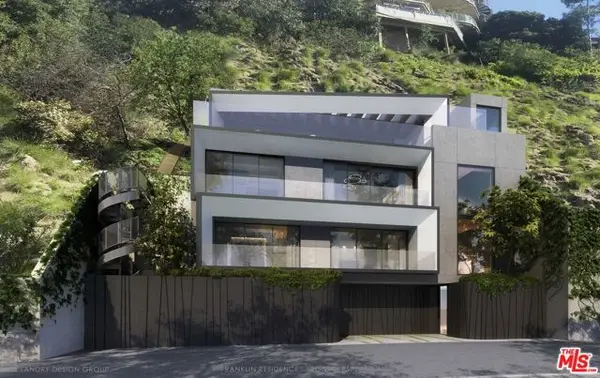 $580,000Active0.17 Acres
8441 W Franklin Avenue, West Hollywood, CA 90069
MLS# CL26659689Listed by: THE AGENCY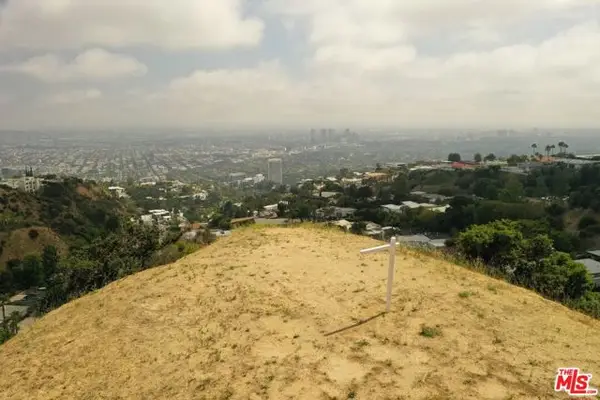 $1,995,000Active2.26 Acres
2381 Sunset Plaza Drive, Los Angeles, CA 90069
MLS# CL26659699Listed by: THE AGENCY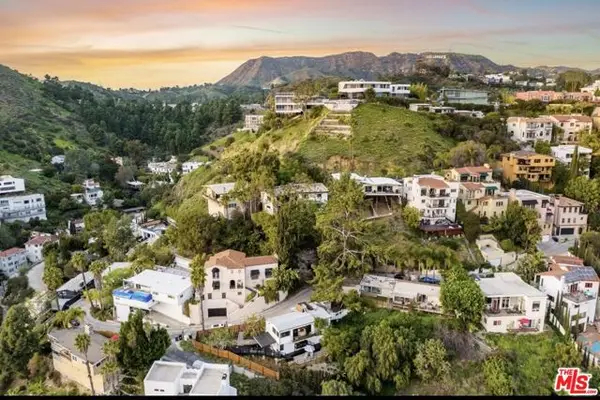 $862,000Active0.52 Acres
0 Tavern Tail, Los Angeles, CA 90046
MLS# CL26661837Listed by: SOTHEBY'S INTERNATIONAL REALTY $1,500,000Active0 Acres
2801 Durand, Hollywood Hills East, CA 90068
MLS# SR26052806Listed by: PINNACLE ESTATE PROPERTIES, INC. $1,500,000Active1.57 Acres
2801 Durand Drive, Hollywood (los Angeles), CA 90068
MLS# CRSR26052806Listed by: PINNACLE ESTATE PROPERTIES, INC.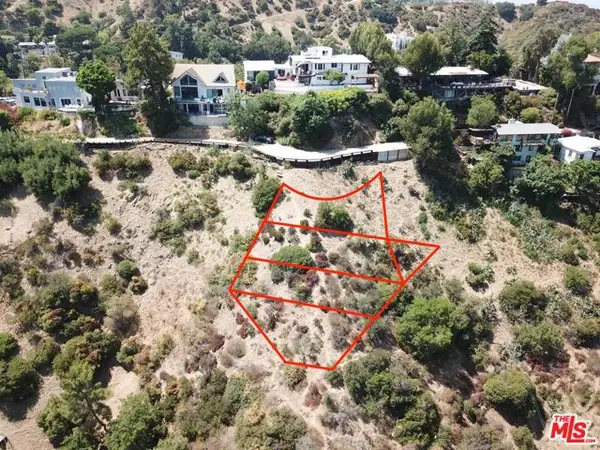 $325,000Active0.29 Acres
2072 N Lewis Terrace, Los Angeles, CA 90046
MLS# CL26658557Listed by: KELLER WILLIAMS BEVERLY HILLS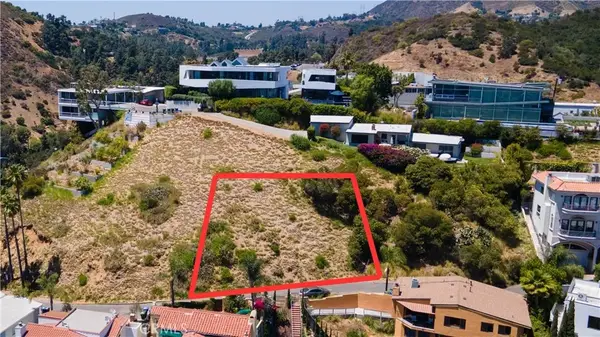 $280,000Active0 Acres
0 Quebec, Hollywood Hills East, CA 90068
MLS# SR26051435Listed by: THE AGENCY $280,000Active0.12 Acres
0 Quebec Drive, Hollywood (los Angeles), CA 90068
MLS# CRSR26051552Listed by: THE AGENCY $1,295,000Active0.14 Acres
645 N Gardner Street, Los Angeles, CA 90036
MLS# 26658443Listed by: HOLLYWOOD ESTATES $399,000Active0 Acres
1904 Rosebud Ave, Los Angeles, CA 90039
MLS# RS26050034Listed by: RE/MAX COLLEGE PARK REALTY $2,495,000Active2.71 Acres
2686 Zorada Drive, Los Angeles, CA 90046
MLS# CL26655507Listed by: KELLER WILLIAMS BEVERLY HILLS $125,000Active0.37 Acres
2415 N San Marco Drive, Los Angeles, CA 90068
MLS# CL26657043Listed by: KELLER WILLIAMS BEVERLY HILLS $1,275,000Active0.19 Acres
4632 Lexington Avenue, Los Angeles, CA 90029
MLS# CL26658735Listed by: MARCUS & MILLICHAP $55,000Active0.08 Acres
8468 Elusive Dr, Los Angeles, CA 90046
MLS# 26657381Listed by: LUXURY COLLECTIVE $374,999Active0.1 Acres
2303 S Palm Grove Drive, Los Angeles, CA 90016
MLS# CL26656619Listed by: KW WESTSIDE ESTATES $1,200,000Active0.13 Acres
1357 N Las Palmas Avenue, Los Angeles, CA 90028
MLS# CL26656809Listed by: THE CREM GROUP $1,650,000Active0.15 Acres
1449 N Bronson Avenue, Los Angeles, CA 90028
MLS# CL26656813Listed by: KELLER WILLIAMS REALTY LA CANADA FLINTRIDGE $3,850,000Active0.97 Acres
7200 La Presa Drive, Los Angeles, CA 90068
MLS# CL26656035Listed by: CHRISTIE'S INTERNATIONAL REAL ESTATE SOCAL $2,499,000Active0.29 Acres
1637 S Vermont Avenue, Los Angeles, CA 90006
MLS# CL26655419Listed by: DREAM REALTY & INVESTMENTS INC- New
 $1,699,000Active0 Acres
6363 Weidlake Drive, Los Angeles, CA 90068
MLS# SR26036619Listed by: REALTY SQUAD INC.  $85,000Active0 Acres
0 De Los Manzanos Fracc. Campestre Los Olivos, Outside Area (outside U.s.) Foreign Country, CA 22750
MLS# PTP2601350Listed by: PREMIER AGENCY R.E. INC $1,100,000Active0 Acres
214 S Carondelet, Los Angeles, CA 90057
MLS# DW26034019Listed by: REAL ESTATE CONNECTION $125,000Active0 Acres
2516 N Woodstock, Hollywood Hills, CA 90046
MLS# AR26032341Listed by: KAREN KU & ASSOCIATES $125,000Active0 Acres
2520 N Woodstock, Los Angeles, CA 90046
MLS# AR26032627Listed by: KAREN KU & ASSOCIATES $125,000Active0.12 Acres
2516 N Woodstock Road, Hollywood (los Angeles), CA 90046
MLS# CRAR26032341Listed by: KAREN KU & ASSOCIATES- $240,000Active0.06 Acres
8536 Lookout Mountain Avenue, Los Angeles, CA 90046
MLS# CL26650079Listed by: CAROLWOOD ESTATES  $1,650,000Active0.19 Acres
5062 W Washington Boulevard, Los Angeles, CA 90016
MLS# CL26650911Listed by: DREAM REALTY & INVESTMENTS INC- $240,000Active0.06 Acres
8534 Lookout Mountain Avenue, Los Angeles, CA 90046
MLS# CL26650089Listed by: CAROLWOOD ESTATES  $1,150,000Active0.41 Acres
0 Los Angeles, Los Angeles, CA 90041
MLS# SR26031382Listed by: JOHNHART REAL ESTATE $5,995,000Active2.19 Acres
2666 Larmar Road, Los Angeles, CA 90068
MLS# CL26650381Listed by: CAROLWOOD ESTATES $185,000Active0.18 Acres
6053 Rodgerton Drive, Los Angeles, CA 90068
MLS# 26649643Listed by: KELLER WILLIAMS BEVERLY HILLS $1,247,500Active0.16 Acres
182 S Virgil Avenue, Los Angeles, CA 90004
MLS# 26645983Listed by: CHRISTIE'S INTERNATIONAL REAL ESTATE SOCAL $1,247,500Active0.16 Acres
186 S Virgil Avenue, Los Angeles, CA 90004
MLS# 26645989Listed by: CHRISTIE'S INTERNATIONAL REAL ESTATE SOCAL $3,000,000Active0.27 Acres
Address Withheld By Seller, Los Angeles, CA 90057
MLS# CL26646443Listed by: CB RICHARD ELLIS, INC.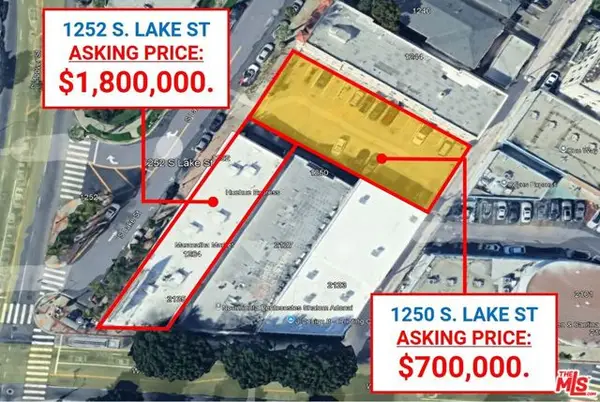 $700,000Active0.2 Acres
1250 S Lake Street, Los Angeles, CA 90006
MLS# CL26646609Listed by: INGENIOUS ASSET GROUP, INC. $1,695,000Active0.12 Acres
1347 N Mansfield Avenue, Los Angeles, CA 90028
MLS# CL26647219Listed by: COLDWELL BANKER REALTY $3,700,000Active0.41 Acres
5346 Franklin Avenue, Los Angeles, CA 90027
MLS# CL26647655Listed by: ZACUTO GROUP $1,300,000Active0.42 Acres
734 Echo Park Avenue, Los Angeles, CA 90026
MLS# CL26644391Listed by: MARCUS & MILLICHAP $650,000Active0.37 Acres
2485 Jupiter Drive, Los Angeles, CA 90046
MLS# 26643973Listed by: KELLER WILLIAMS STUDIO CITY $70,000Active0.1 Acres
7264 Woodrow Wilson Drive, Los Angeles, CA 90046
MLS# CL26643207Listed by: BERKSHIRE HATHAWAY HOMESERVICES CALIFORNIA PROPERTIES $1,295,000Active0.16 Acres
3030 W 12th Place, Los Angeles, CA 90006
MLS# CL26639841Listed by: DREAM REALTY & INVESTMENTS INC $350,000Active0 Acres
2106 Roselin, Los Angeles, CA 90039
MLS# OC26017358Listed by: COMPASS $2,350,000Active0.18 Acres
1108 Manzanita Street, Los Angeles, CA 90029
MLS# CL26640823Listed by: KELLER WILLIAMS BEVERLY HILLS- $95,000Active0 Acres
2721 N Onyxdr, Los Angeles, CA 90032
MLS# SB26013227Listed by: KELLER WILLIAMS REALTY  $6,000,000Active0 Acres
5301 Sierra Vista, Los Angeles, CA 90029
MLS# SR26013068Listed by: ED KOENIG IRE $1,350,000Active0.17 Acres
823 Hyperion Avenue, Los Angeles, CA 90029
MLS# 26637415Listed by: KELLER WILLIAMS BEVERLY HILLS $899,000Active0.42 Acres
7007 Pacific View Drive, Los Angeles, CA 90068
MLS# CL25623541Listed by: COMPASS $2,000,000Active1.13 Acres
0 Avon Place, Los Angeles, CA 90026
MLS# CL26633821Listed by: KELLER WILLIAMS BEVERLY HILLS $3,490,000Active0.14 Acres
951 S Ardmore Avenue, Los Angeles, CA 90006
MLS# CL25628259Listed by: DREAM REALTY & INVESTMENTS INC $295,000Active0.11 Acres
8220 Mannix Drive, Los Angeles, CA 90046
MLS# TR26023176Listed by: FURSTENBERG REALTY $1,795,000Active0.22 Acres
2046 Sunset Plaza Drive, Los Angeles, CA 90069
MLS# CL25626059Listed by: MAHER COMMERCIAL REALTY $700,000Active0 Acres
1274 W Court, Los Angeles, CA 90026
MLS# P1-25097Listed by: KELLER WILLIAMS REALTY $549,000Active0.16 Acres
2266 W Earl Street, Los Angeles, CA 90039
MLS# CL25623363Listed by: COLDWELL BANKER REALTY $495,000Active0.14 Acres
8692 Franklin Avenue, Los Angeles, CA 90069
MLS# CL25611879Listed by: ROBUST REAL ESTATE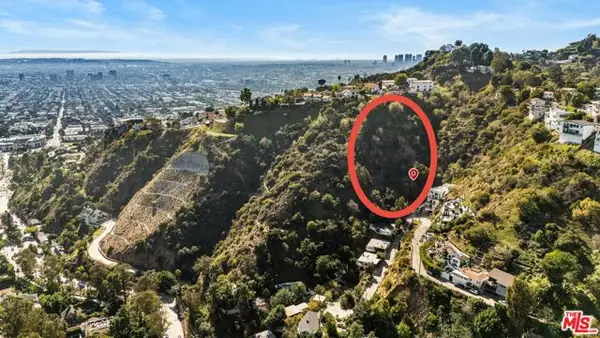 $550,000Active4.04 Acres
0 Gould Avenue, Los Angeles, CA 90046
MLS# CL25617375Listed by: ESTATEX INC. $2,395,000Active0 Acres
2229 Venice, Los Angeles, CA 90006
MLS# SR25260555Listed by: EVANISKO REALTY & INVESTMENT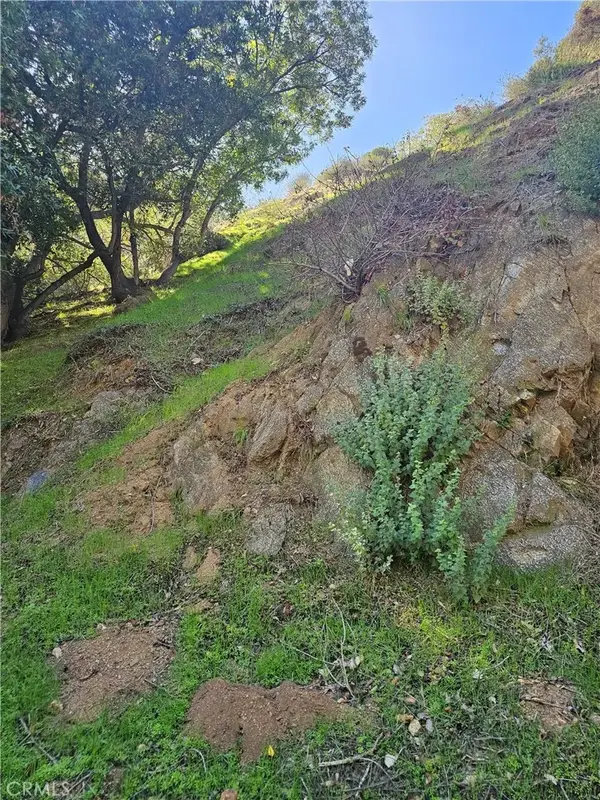 $890,000Active0 Acres
2145 Laurel Canyon, Los Angeles, CA 90046
MLS# RS25253328Listed by: POWERCLOSE REALTY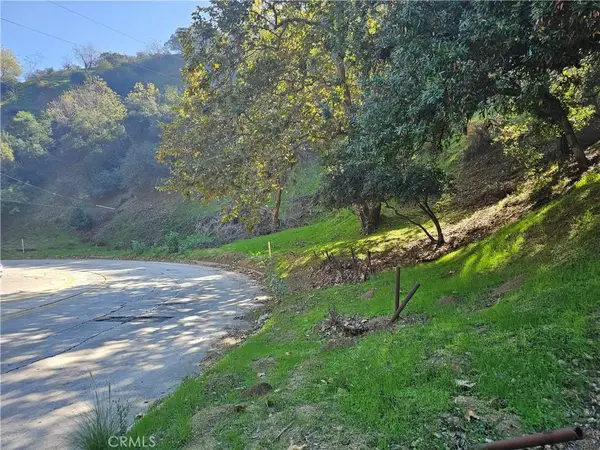 $450,000Active0 Acres
2161 Laurel Canyon, Los Angeles, CA 90046
MLS# RS25253330Listed by: POWERCLOSE REALTY $450,000Active0.11 Acres
2161 Laurel Canyon Boulevard, Los Angeles, CA 90046
MLS# RS25253330Listed by: POWERCLOSE REALTY $2,800,000Pending0.77 Acres
2350 Lake Shore Avenue, Los Angeles, CA 90039
MLS# 25616605Listed by: MARCUS & MILLICHAP $420,000Active0 Acres
744 Amador, Los Angeles, CA 90012
MLS# OC25253396Listed by: RELIABLE REAL ESTATE COMPANY
 $250,000Active0.09 Acres
746 Cleveland Street, Los Angeles, CA 90012
MLS# RS25253177Listed by: C-21 ASTRO $239,000Active0.11 Acres
6905 Cahuenga Park Trail, Los Angeles, CA 90068
MLS# 25611837Listed by: KELLER WILLIAMS BEVERLY HILLS $249,000Active0.11 Acres
6909 Cahuenga Park Trail, Los Angeles, CA 90068
MLS# 25611843Listed by: KELLER WILLIAMS BEVERLY HILLS $2,400,000Active0 Acres
1272 W Court, Los Angeles, CA 90026
MLS# P1-24788Listed by: KELLER WILLIAMS REALTY $1,895,000Active2.24 Acres
8813 Wonderland Avenue, Los Angeles, CA 90046
MLS# 25584039Listed by: CORE REAL ESTATE GROUP $200,000Active0 Acres
2625 N Dominion Lane, Los Angeles, CA 90046
MLS# SB25248942Listed by: KELLER WILLIAMS SOUTH BAY $4,495,000Active0.52 Acres
1310 W 6th Street, Los Angeles, CA 90017
MLS# CL25611747Listed by: KIDDER MATHEWS OF CALIFORNIA, INC. $65,000Active0.11 Acres
2314 N Merrywood Dr, Los Angeles, CA 90046
MLS# CL25611619Listed by: COMPASS $1,650,000Active0.12 Acres
1000 N Gardner Street, West Hollywood, CA 90046
MLS# CL25610741Listed by: MARCUS & MILLICHAP $1,950,000Active0.15 Acres
944 N Ogden Drive, West Hollywood, CA 90046
MLS# CL25610751Listed by: MARCUS & MILLICHAP $1,950,000Active0.15 Acres
947 N Genesee Avenue, West Hollywood, CA 90046
MLS# CL25610759Listed by: MARCUS & MILLICHAP $1,650,000Active0.18 Acres
1156 N Kingsley Drive, Los Angeles, CA 90029
MLS# CL25607383Listed by: KELLER WILLIAMS BEVERLY HILLS $4,950,000Active0.68 Acres
1865 Marcheeta Place, Los Angeles, CA 90069
MLS# 25605389Listed by: CHRISTIE'S INTERNATIONAL REAL ESTATE SOCAL $1,200,000Active0.14 Acres
1028 S Serrano Avenue, Los Angeles, CA 90006
MLS# 25610149Listed by: KELLER WILLIAMS BEVERLY HILLS $1,700,000Active0.15 Acres
1431 N Vista Street, Los Angeles, CA 90046
MLS# 25609723Listed by: MARCUS & MILLICHAP $350,000Active0.25 Acres
2301 Nichols Canyon, Los Angeles, CA 90046
MLS# CL25607009Listed by: ERICKSON ESTATES, INC $1,695,000Active0.39 Acres
2284 Holly Drive, Los Angeles, CA 90068
MLS# CROC25236412Listed by: MICHAEL WINTERHALTER, BROKER $1,700,000Active0.15 Acres
1222 Beachwood Drive, Los Angeles, CA 90038
MLS# 219136692DAListed by: PRIME DESERT ESTATES $85,000Active0.06 Acres
2925 N Park Center Drive, Los Angeles, CA 90068
MLS# CL25602359Listed by: KELLER WILLIAMS BEVERLY HILLS $340,000Active0.09 Acres
2380 Loma Vista Place, Los Angeles, CA 90039
MLS# CL25600763Listed by: COMPASS $799,000Active0.23 Acres
2106 Whitmore Avenue, Los Angeles, CA 90039
MLS# 25600555Listed by: NOURMAND & ASSOCIATES-HW $900,000Active1.03 Acres
1980 Sunset Plaza, Los Angeles, CA 90069
MLS# CL25594141Listed by: RODEO REALTY $9,995,000Active0.23 Acres
6445 W Sunset Boulevard, Los Angeles, CA 90028
MLS# CL25592571Listed by: THE AGENCY $1,199,000Active0.17 Acres
933 S Gramercy Place, Los Angeles, CA 90019
MLS# CL25589527Listed by: RODEO REALTY $249,000Active0.16 Acres
0 Groveland Drive, Los Angeles, CA 90046
MLS# CL25589463Listed by: ACME REAL ESTATE $75,000Active0 Acres
7258 Woodrow Wilson, Los Angeles, CA 90046
MLS# PW25193719Listed by: GATEHOUSE PROPERTIES $799,000Active0.22 Acres
700 Lookout Dr, Los Angeles, CA 90012
MLS# SR25186872Listed by: COLDWELL BANKER ENVISION- $1,500,000Active0.14 Acres
1339 N Cherokee Avenue, Los Angeles, CA 90028
MLS# CL25575569Listed by: ENTERTAINMENT R.E. SERVICES  $9,800,000Active0.92 Acres
1741 N La Brea Avenue, Los Angeles, CA 90046
MLS# CL25572993Listed by: KELLER WILLIAMS ENCINO/SHERMAN OAKS $198,000Active0.74 Acres
7810 Torreyson Drive, Los Angeles, CA 90046
MLS# CL25572719Listed by: BERKSHIRE HATHAWAY HOMESERVICES CALIFORNIA PROPERTIES $285,000Pending0.07 Acres
2172 Broadview Terrace, Hollywood (los Angeles), CA 90068
MLS# CL25565573Listed by: DOUGLAS ELLIMAN OF CALIFORNIA, INC. $515,000Active0 Acres
1941 Delta St., Los Angeles, CA 90026
MLS# SB25242238Listed by: BERKSHIRE HATHAWAY HSCP $1,075,000Active0 Acres
1619 S St Andrews, Los Angeles, CA 90019
MLS# SB25159231Listed by: BUCKINGHAM INVESTMENTS, INC $59,900Active0 Acres
0 N/a, Hollywood Hills, CA 90068
MLS# OC25150823Listed by: RE/MAX COASTAL HOMES $285,000Pending0.07 Acres
2172 Broadview Terrace, Hollywood Hills, CA 90068
MLS# 25565573Listed by: DOUGLAS ELLIMAN OF CALIFORNIA, INC. $999,000Active0.09 Acres
17860 W Lecco Lane, Pacific Palisades (los Angeles), CA 90027
MLS# CL25564519Listed by: THE AGENCY $1,495,000Active0.16 Acres
1562 S Fairfax Avenue, Los Angeles, CA 90019
MLS# CL25562269Listed by: KELLER WILLIAMS BEVERLY HILLS $12,900,000Active2.45 Acres
1830 N Sierra Bonita Avenue, Los Angeles, CA 90046
MLS# 25559133Listed by: COLDWELL BANKER REALTY $545,000Active0.2 Acres
2734 La Cuesta Drive, Los Angeles, CA 90046
MLS# CL25557229Listed by: KELLER WILLIAMS HOLLYWOOD HILLS $1,145,000Active0.25 Acres
7315 W Pyramid Place, Los Angeles, CA 90046
MLS# 26657019Listed by: COMPASS $1,900,000Active0.5 Acres
2389 Silverlake Blvd, Los Angeles, CA 90039
MLS# CL25545819Listed by: NAI CAPITAL COMMERCIAL INC. $4,700Active0 Acres
0 Cheremoya Ave, Los Angeles, CA 90068
MLS# PW25120147Listed by: REAL ESTATE EBROKER INC $1,595,000Active0.13 Acres
2502 S Robertson Boulevard, Los Angeles, CA 90034
MLS# 26653053Listed by: BERKSHIRE HATHAWAY HOMESERVICES CALIFORNIA PROPERTIES $120,000Active0 Acres
2152 Groveland, Los Angeles, CA 90046
MLS# SR25109763Listed by: RODEO REALTY $350,000Active0.07 Acres
1260 W 1st Street, Los Angeles, CA 90026
MLS# CL26647335Listed by: LEE & ASSOCIATES INVESTMENTS SERVICES GROUP INC $889,000Active0.11 Acres
3334 N Knoll Drive, Los Angeles, CA 90068
MLS# CL25539121Listed by: RODEO REALTY $79,000Active0 Acres
6945 Sunnydell, Los Angeles, CA 90068
MLS# SR25106525Listed by: PINNACLE ESTATE PROPERTIES, INC. $2,399,000Active0 Acres
240 S Normandie, Los Angeles, CA 90004
MLS# OC25102562Listed by: EJP & ASSOCIATES $130,000Active0.06 Acres
7192 Woodrow Wilson Drive, Los Angeles, CA 90068
MLS# CL25530381Listed by: REAL BROKER $2,000,000Active2.91 Acres
8205 Laurelmont, Los Angeles, CA 90046
MLS# CL25524695Listed by: COMPASS- $599,000Active0.16 Acres
444 N Coronado Terrace, Los Angeles, CA 90026
MLS# CL25524591Listed by: COMPASS 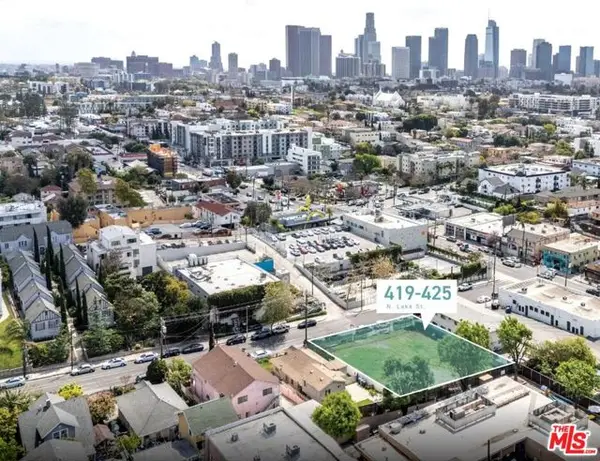 $3,575,000Active0.28 Acres
419 N Lake Street, Los Angeles, CA 90026
MLS# CL26650287Listed by: CB RICHARD ELLIS, INC. $299,000Active0.1 Acres
1947 Rosebud, Los Angeles, CA 90039
MLS# CL25494871Listed by: DREAM REALTY & INVESTMENTS INC $89,000Active0.24 Acres
2537 Woodstock Road, Los Angeles, CA 90046
MLS# SB25063986Listed by: CENTURY 21 COASTAL PROPERTIES $575,000Pending0 Acres
2949 N Durand Drive, Hollywood Hills East, CA 90068
MLS# SR25083109Listed by: EXP REALTY OF GREATER LOS ANGELES, INC. $299,000Active0.1 Acres
1939 Rosebud Avenue, Los Angeles, CA 90039
MLS# CL25494965Listed by: DREAM REALTY & INVESTMENTS INC $228,000Active0 Acres
6428 W Rodgerton, Los Angeles, CA 90068
MLS# TR25021801Listed by: PINNACLE REAL ESTATE GROUP $995,000Active1 Acres
9100 Crescent Drive, Los Angeles, CA 90046
MLS# CL26659705Listed by: THE AGENCY $899,000Active0.17 Acres
2250 Fargo Street, Los Angeles, CA 90039
MLS# 25538095Listed by: NOURMAND & ASSOCIATES-HW $6,295,000Active0 Acres
3544 Multiview Dr, Studio City, CA 90068
MLS# SR25083067Listed by: EXP REALTY OF GREATER LOS ANGELES, INC. $645,000Active0.16 Acres
2252 Aaron Street, Los Angeles, CA 90026
MLS# CL26646507Listed by: KELLER WILLIAMS BEVERLY HILLS $255,000Active0 Acres
0 Woods Dr, Hollywood Hills, CA 90069
MLS# IV24213210Listed by: HOMELINK REALTY INC. $145,000Active0 Acres
0 Jewitt Dr, Hollywood Hills, CA 90046
MLS# IV24213296Listed by: HOMELINK REALTY INC. $255,000Active0.14 Acres
0 Woods Dr, Hollywood (los Angeles), CA 90069
MLS# CRIV24213210Listed by: HOMELINK REALTY INC. $699,000Active0.62 Acres
0 Hargrave Drive, Los Angeles, CA 90068
MLS# 24441609Listed by: COLDWELL BANKER REALTY $70,000Active0 Acres
0 Vanland Trail, Los Angeles, CA 90068
MLS# SW24192840Listed by: REALTY ONE GROUP WEST $69,000Active0.11 Acres
2125 N Laurel Canyon Boulevard, Los Angeles, CA 90046
MLS# CL25589841Listed by: KELLER WILLIAMS BEVERLY HILLS $4,500,000Active0.19 Acres
1437 12th Avenue, Los Angeles, CA 90019
MLS# CL24437819Listed by: DREAM REALTY & INVESTMENTS INC $998,000Active0.66 Acres
2100 Avon Street, Los Angeles, CA 90026
MLS# 24428641Listed by: COMPASS $1,655,000Active0.17 Acres
5636 Lexington Avenue, Los Angeles, CA 90038
MLS# WS25224135Listed by: SO. CALIFORNIA REAL ESTATE CO. $2,495,000Pending0.14 Acres
920 S La Brea Avenue, Los Angeles, CA 90036
MLS# 23312597Listed by: KW WESTSIDE ESTATES $6,500,000Pending0.43 Acres
726 Hartford Avenue, Los Angeles, CA 90017
MLS# 24414477Listed by: MAHER COMMERCIAL REALTY $85,000Active0.17 Acres
2981 Passmore Drive, Los Angeles, CA 90068
MLS# 23314331Listed by: ENGEL & VOLKERS BEVERLY HILLS $5,500,000Active0.98 Acres
2829 Waverly Drive, Los Angeles, CA 90039
MLS# 24358885Listed by: KELLER WILLIAMS BEVERLY HILLS $350,000Active0.41 Acres
3031 Passmore Drive, Los Angeles, CA 90068
MLS# 23314337Listed by: ENGEL & VOLKERS BEVERLY HILLS $1,100,000Active0.14 Acres
1833 W Pico Boulevard, Los Angeles, CA 90006
MLS# CL23251969Listed by: BRUCE JAY ASSOCIATES $299,995Active0.27 Acres
8169 Kirkwood Drive, Los Angeles, CA 90046
MLS# CL22120341Listed by: NEST SEEKERS $350,000Active0.12 Acres
6682 Whitley Terrace, Los Angeles, CA 90068
MLS# SR25217963Listed by: COLDWELL BANKER EXCLUSIVE $375,000Active0 Acres
2354 Holly, Los Angeles, CA 90068
MLS# SB24077666Listed by: ESTATE PROPERTIES $399,000Active0.28 Acres
1599 Landa St, Los Angeles, CA 90026
MLS# CRIG26008002Listed by: GOLD TEAM REALTY $75,000Active0.13 Acres
0 Woods Dr, Los Angeles, CA 90069
MLS# CL26659863Listed by: COMPASS $350,000Active0 Acres
8140 Gould, Los Angeles, CA 90046
MLS# IG25231168Listed by: RE/MAX TIME REALTY $11,300,000Active0.73 Acres
5101 W Pico Boulevard, Los Angeles, CA 90019
MLS# CL24351721Listed by: MARCUS & MILLICHAP $139,000Active0 Acres
5894 Lorae, Los Angeles, CA 90068
MLS# OC24002026Listed by: MARTIN INVESTMENT PROPERTIES $425,000Active0 Acres
2286 Silver Ridge, Los Angeles, CA 90039
MLS# DW23207871Listed by: FIRST FAMILY HOMES $129,000Active0.13 Acres
8413 Grand View Drive, Los Angeles, CA 90046
MLS# CL25620231Listed by: BERKSHIRE HATHAWAY HOMESERVICES CALIFORNIA PROPERTIES $449,000Active0.15 Acres
809 Glendale Boulevard, Los Angeles, CA 90026
MLS# CL26654481Listed by: NOURMAND & ASSOCIATES-HW $149,999Active0.13 Acres
8413 Grand View Drive, Los Angeles, CA 90046
MLS# 23243379Listed by: BERKSHIRE HATHAWAY HOMESERVICES CALIFORNIA PROPERTIES $449,000Active0.35 Acres
7506 Willow Glen Road, Los Angeles, CA 90046
MLS# 21798910Listed by: KELLER WILLIAMS BEVERLY HILLS $30,000,000Active0 Acres
2864 E Cahuenga Blvd, Los Angeles, CA 90068
MLS# 21680322Listed by: CORCORAN GLOBAL LIVING $2,120,000Active0.16 Acres
339 N Virgil Avenue, Los Angeles, CA 90004
MLS# 21725404Listed by: KORUS REAL ESTATE
Local realty services provided by:CENTURY 21 Sierra Properties, CENTURY 21 Adams & Barnes, CENTURY 21 Affiliated
The information being provided by California Regional MLS (Southern California) is for the consumer's personal, non-commercial use and may not be used for any purpose other than to identify prospective properties consumer may be interested in purchasing. Any information relating to real estate for sale referenced on this web site comes from the Internet Data Exchange (IDX) program of the California Regional MLS (Southern California). CENTURY 21 Adams & Barnes is not a Multiple Listing Service (MLS), nor does it offer MLS access. This website is a service of CENTURY 21 Adams & Barnes, a broker participant of California Regional MLS (Southern California). This web site may reference real estate listing(s) held by a brokerage firm other than the broker and/or agent who owns this web site.
The accuracy of all information, regardless of source, including but not limited to open house information, square footages and lot sizes, is deemed reliable but not guaranteed and should be personally verified through personal inspection by and/or with the appropriate professionals. The data contained herein is copyrighted by California Regional MLS (Southern California) and is protected by all applicable copyright laws. Any unauthorized dissemination of this information is in violation of copyright laws and is strictly prohibited.
Copyright 2021 California Regional MLS (Southern California). All rights reserved.
This information is deemed reliable but not guaranteed. You should rely on this information only to decide whether or not to further investigate a particular property. BEFORE MAKING ANY OTHER DECISION, YOU SHOULD PERSONALLY INVESTIGATE THE FACTS (e.g. square footage and lot size) with the assistance of an appropriate professional. You may use this information only to identify properties you may be interested in investigating further. All uses except for personal, non-commercial use in accordance with the foregoing purpose are prohibited. Redistribution or copying of this information, any photographs or video tours is strictly prohibited. This information is derived from the Internet Data Exchange (IDX) service provided by San Diego MLS®. Displayed property listings may be held by a brokerage firm other than the broker and/or agent responsible for this display. The information and any photographs and video tours and the compilation from which they are derived is protected by copyright. Compilation © 2020 San Diego MLS®, Inc.
Popular neighborhoods near Central Los Angeles, Los Angeles, CA
Zip codes near Central Los Angeles, Los Angeles, CA
- 90004 homes for sale
- 90005 homes for sale
- 90006 homes for sale
- 90010 homes for sale
- 90015 homes for sale
- 90017 homes for sale
- 90019 homes for sale
- 90020 homes for sale
- 90026 homes for sale
- 90027 homes for sale
- 90028 homes for sale
- 90029 homes for sale
- 90036 homes for sale
- 90038 homes for sale
- 90039 homes for sale
- 90046 homes for sale
- 90048 homes for sale
- 90057 homes for sale
- 90068 homes for sale
- 91204 homes for sale
Counties near Central Los Angeles, Los Angeles, CA
Protect your home and budget from life's surprises with an Assurant Home Warranty, backed by a partner that supports you through every step of homeownership. Explore Plans.
©2026 Century 21 Real Estate LLC. All rights reserved. CENTURY 21®, the CENTURY 21 Logo and C21® are service marks owned by Century 21 Real Estate LLC. Century 21 Real Estate LLC fully supports the principles of the Fair Housing Act and the Equal Opportunity Act. Each office is independently owned and operated. Listing information is deemed reliable but not guaranteed accurate.