- Clinton Hill, Newark homes for sale
- Downtown Newark, Newark homes for sale
- East Ward, Newark homes for sale
- Fairmount, Newark homes for sale
- Five Corners, Newark homes for sale
- Forest Hill, Newark homes for sale
- Ironbound, Newark homes for sale
- Lincoln Park, Newark homes for sale
- Lower Roseville, Newark homes for sale
- Lower Vailsburg, Newark homes for sale
- Mount Pleasant/Lower Broadway, Newark homes for sale
- North Ward, Newark homes for sale
- Seventh Avenue, Newark homes for sale
- South Broad Valley, Newark homes for sale
- South Ward, Newark homes for sale
- Springfield/Belmont, Newark homes for sale
- University Heights, Newark homes for sale
- Upper Roseville, Newark homes for sale
- Weequahic, Newark homes for sale
- West Side, Newark homes for sale
Central Ward, Newark, NJ - homes for sale
9 of 9 results displayed
 $689,999Active6 beds 3 baths
360 New St, Newark City, NJ 07103
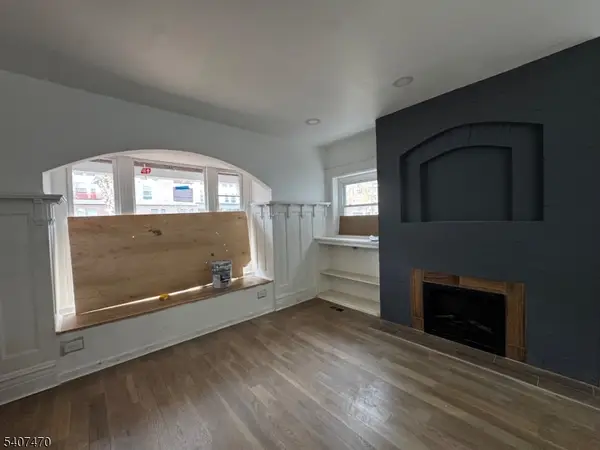
MLS# 4010623Listed by: PREMIERBLU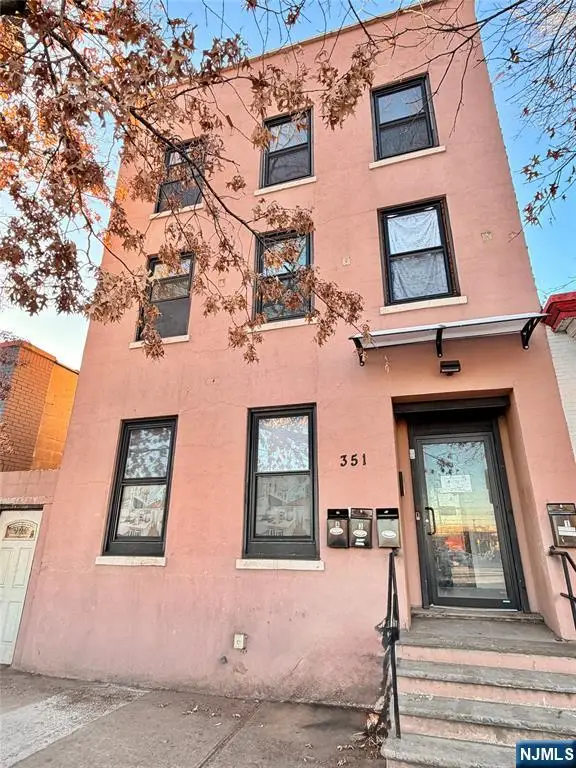 $899,900Active-- beds 4 baths
351 Mulberry Street, Newark, NJ 07102
MLS# 26003920Listed by: RE/MAX PROFESSIONALS 1
 $1,275,000Pending9 beds 6 baths
696 Dr Martin Luther King J, Newark City, NJ 07102
MLS# 4006665Listed by: COLDWELL BANKER REALTY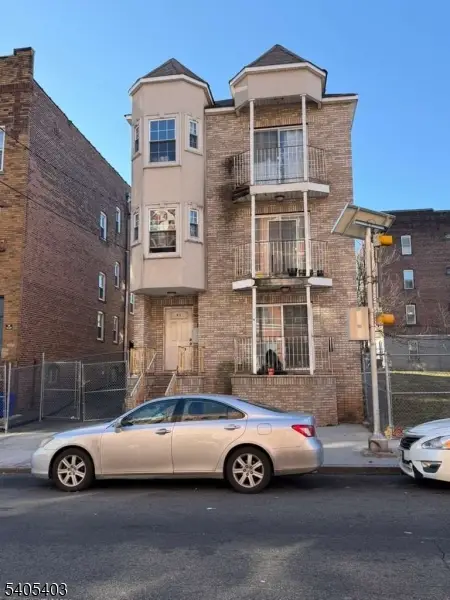 $799,000Active8 beds 4 baths
91 Spruce St, Newark City, NJ 07108
MLS# 4004727Listed by: WEICHERT REALTORS - HOME CITY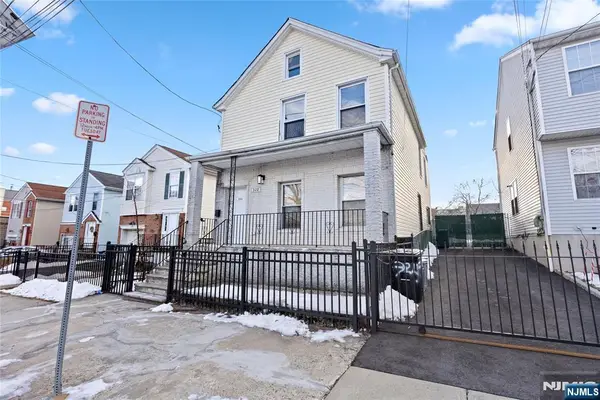 $535,000Pending-- beds 2 baths
322 New Street, Newark, NJ 07103
MLS# 26000155Listed by: CAPC BROKERAGE, LLC $699,999Active-- beds 4 baths
286-288 Bergen Street, Newark, NJ 07103
MLS# 25041344Listed by: WEICHERT REALTORS, WESTFIELD $669,999Pending6 beds 2 baths
286 Bergen St, Newark City, NJ 07103
MLS# 3998280Listed by: WEICHERT REALTORS $725,000Active9 beds 4 baths
200 Bergen Street, Newark City, NJ 07103
MLS# 3963019Listed by: CORNERSTONE REALTY ASSOCIATES $739,900Pending-- beds 4 baths
44 Hudson St, Newark City, NJ 07103
MLS# 3912777Listed by: RE/MAX FIRST REALTY II
Local realty services provided by:CENTURY 21 Action Plus Realty, CENTURY 21 Alliance Realty
The data relating to real estate for sale on this website comes in part from the IDX Program of Garden State Multiple Listing Service, L.L.C. Real estate listings held by other brokerage firms are marked as IDX Listing. Information deemed reliable but not guaranteed. 2026 Garden State Multiple Listing Service, L.L.C. All rights reserved. Notice: The dissemination of listings on this website does not constitute the consent required by N.J.A.C. 11:5.6.1 (n) for the advertisement of listings exclusively for sale by another broker. Any such consent must be obtained in writing from the listing broker. This information is being provided for Consumers' personal, non-commercial use and may not be used for any purpose other than to identify prospective properties Consumers may be interested in purchasing. Date Last Updated October 16, 2025
The data relating to the real estate for sale on this web site comes in part from the Internet Data Exchange Program of the NJMLS. Real estate listings held by brokerage firms other than CENTURY 21 Alliance Realty are marked with the Internet Data Exchange logo and information about them includes the name of the listing brokers. Some properties listed with the participating brokers do not appear on this website at the request of the seller. Listings of brokers that do not participate in Internet Data Exchange do not appear on this website.
All information deemed reliable but not guaranteed. Last date updated: March 19, 2026. Source: New Jersey Multiple Listing Service, Inc.
2026 New Jersey Multiple Listing Service, Inc. All rights reserved.
Popular neighborhoods near Central Ward, Newark, NJ
Zip codes near Central Ward, Newark, NJ
- 07017 homes for sale
- 07018 homes for sale
- 07029 homes for sale
- 07031 homes for sale
- 07032 homes for sale
- 07050 homes for sale
- 07079 homes for sale
- 07102 homes for sale
- 07103 homes for sale
- 07104 homes for sale
- 07105 homes for sale
- 07106 homes for sale
- 07107 homes for sale
- 07108 homes for sale
- 07109 homes for sale
- 07111 homes for sale
- 07112 homes for sale
- 07114 homes for sale
- 07205 homes for sale
- 07208 homes for sale
Counties near Central Ward, Newark, NJ
- Bergen County homes for sale
- Bronx County homes for sale
- Essex County homes for sale
- Hudson County homes for sale
- Hunterdon County homes for sale
- Kings County homes for sale
- Mercer County homes for sale
- Middlesex County homes for sale
- Monmouth County homes for sale
- Morris County homes for sale
- Nassau County homes for sale
- New York County homes for sale
- Passaic County homes for sale
- Queens County homes for sale
- Richmond County homes for sale
- Rockland County homes for sale
- Somerset County homes for sale
- Sussex County homes for sale
- Union County homes for sale
- Westchester County homes for sale
Protect your home and budget from life's surprises with an Assurant Home Warranty, backed by a partner that supports you through every step of homeownership. Explore Plans.
©2026 Century 21 Real Estate LLC. All rights reserved. CENTURY 21®, the CENTURY 21 Logo and C21® are service marks owned by Century 21 Real Estate LLC. Century 21 Real Estate LLC fully supports the principles of the Fair Housing Act and the Equal Opportunity Act. Each office is independently owned and operated. Listing information is deemed reliable but not guaranteed accurate.