- Bokeelia homes for sale
- Burnt Store Marina homes for sale
- Charlotte Harbor homes for sale
- Charlotte Park homes for sale
- Cleveland homes for sale
- Grove City homes for sale
- Grove City-Rotonda homes for sale
- Harbour Heights homes for sale
- Lake Suzy homes for sale
- North Port homes for sale
- Palmona Park homes for sale
- Pineland homes for sale
- Placida homes for sale
- Port Charlotte homes for sale
- Punta Gorda homes for sale
- Rotonda homes for sale
- Rotonda West homes for sale
- Solana homes for sale
- Suncoast Estates homes for sale
- Warm Mineral Springs homes for sale
Charlotte County, FL - homes for sale
300 of 910 results displayed
- New
 $339,900Active2 beds 2 baths1,366 sq. ft.
16000 Grassland Lane #3124, PUNTA GORDA, FL 33982
MLS# C7524173Listed by: NICKLAUS VANCE - New
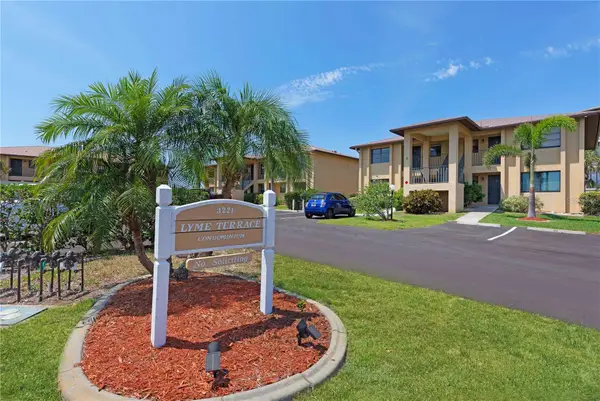 $199,000Active2 beds 1 baths826 sq. ft.
3221 White Ibis Court #D2, PUNTA GORDA, FL 33950
MLS# C7524123Listed by: RE/MAX HARBOR REALTY - New
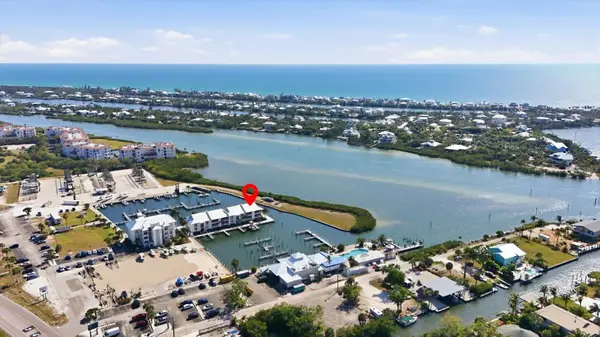 $299,000Active1 beds 1 baths648 sq. ft.
7070 Placida Road #1121, PLACIDA, FL 33946
MLS# D6146782Listed by: GULF TO BAY SOTHEBY'S INTERNAT - New
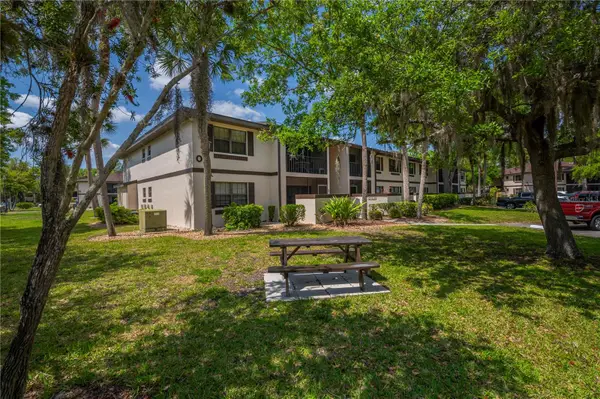 $125,000Active1 beds 1 baths689 sq. ft.
19505 Quesada Avenue #O207, PORT CHARLOTTE, FL 33948
MLS# C7524019Listed by: COLDWELL BANKER SUNSTAR REALTY - New
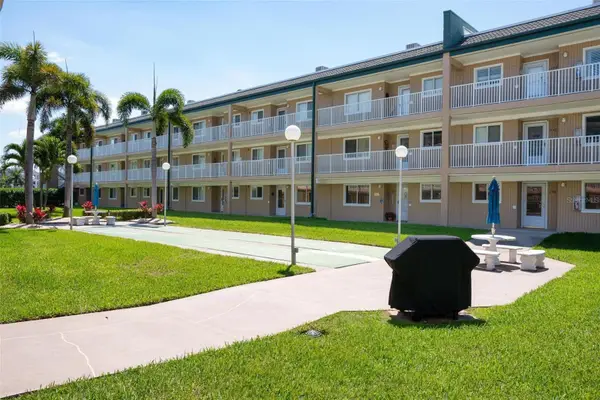 $180,000Active2 beds 2 baths1,077 sq. ft.
150 Harborside Avenue #303, PUNTA GORDA, FL 33950
MLS# C7524060Listed by: MICHAEL SAUNDERS & COMPANY - New
 $139,900Active2 beds 2 baths899 sq. ft.
1515 Forrest Nelson Boulevard #L105, PORT CHARLOTTE, FL 33952
MLS# C7524020Listed by: COLDWELL BANKER SUNSTAR REALTY - New
 $210,000Active2 beds 2 baths1,336 sq. ft.
23465 Harborview Road #231, PUNTA GORDA, FL 33980
MLS# N6143604Listed by: KELLER WILLIAMS ISLAND LIFE REAL ESTATE - New
 $120,000Active2 beds 2 baths937 sq. ft.
24540 Harborview Road #H2, PUNTA GORDA, FL 33980
MLS# C7524078Listed by: BARNES & PHILLIPS REAL ESTATE - New
 $368,000Active3 beds 2 baths1,917 sq. ft.
14009 Black Beauty Drive #212, PUNTA GORDA, FL 33955
MLS# C7524071Listed by: CALENDA REAL ESTATE GROUP,INC. - New
 $139,900Active2 beds 2 baths899 sq. ft.
1515 Forrest Nelson Boulevard #G104, PORT CHARLOTTE, FL 33952
MLS# C7524026Listed by: KW PEACE RIVER PARTNERS - New
 $1,129,000Active2 beds 2 baths1,248 sq. ft.
6010 Boca Grande Causeway #C32, BOCA GRANDE, FL 33921
MLS# D6146748Listed by: BOCA GRANDE REAL ESTATE, INC.  $79,900Pending2 beds 2 baths1,017 sq. ft.
2290 Aaron Street #312, PORT CHARLOTTE, FL 33952
MLS# C7523924Listed by: PREFERRED SHORE LLC- New
 $324,900Active2 beds 2 baths1,430 sq. ft.
3239 Purple Martin Drive #122, PUNTA GORDA, FL 33950
MLS# C7523849Listed by: PEACE HARBOR REAL ESTATE INC. - New
 $90,000Active2 beds 2 baths919 sq. ft.
2437 Harbor Boulevard #204, PORT CHARLOTTE, FL 33952
MLS# A4687620Listed by: EXP REALTY LLC - New
 $149,500Active2 beds 1 baths857 sq. ft.
19325 Water Oak Drive #204, PORT CHARLOTTE, FL 33948
MLS# C7523778Listed by: COLDWELL BANKER SUNSTAR REALTY  $429,900Pending3 beds 2 baths2,110 sq. ft.
43317 Water Bird Way #5021, Punta Gorda, FL 33982
MLS# 2026014294Listed by: PINNACLE PROPERTY GROUP- New
 $500,000Active2 beds 2 baths1,456 sq. ft.
13313 Gasparilla Rd #C402, Other, FL 33946
MLS# A11986062Listed by: LOKATION - New
 $582,000Active4 beds 3 baths1,867 sq. ft.
1617 Sea Haven Drive #507, Punta Gorda, FL 33950
MLS# 226012948Listed by: TAYLOR MORRISON REALTY OF FL - New
 $544,000Active4 beds 3 baths1,867 sq. ft.
1617 Sea Haven Drive #503, Punta Gorda, FL 33950
MLS# 226012806Listed by: TAYLOR MORRISON REALTY OF FL - New
 $190,000Active1 beds 1 baths668 sq. ft.
7438 Palm Island Drive #3721, PLACIDA, FL 33946
MLS# D6146740Listed by: PALM ISLAND PROPERTIES INC - New
 $117,000Active1 beds 1 baths689 sq. ft.
19505 Quesada Avenue #OO108, PORT CHARLOTTE, FL 33948
MLS# C7523874Listed by: REALTY HUB - New
 $113,550Active1 beds 1 baths634 sq. ft.
3006 Caring Way #409, PORT CHARLOTTE, FL 33952
MLS# A4687325Listed by: WRA BUSINESS & REAL ESTATE - New
 $315,000Active3 beds 2 baths1,729 sq. ft.
8561 Amberjack Circle #302, ENGLEWOOD, FL 34224
MLS# N6143571Listed by: PARADISE EXCLUSIVE INC - New
 $200,000Active2 beds 2 baths1,405 sq. ft.
23465 Harborview Road #734, Punta Gorda, FL 33980
MLS# 2026013868Listed by: KELLER WILLIAMS REALTY FORT MYERS AND THE ISLANDS  $469,000Pending3 beds 3 baths2,006 sq. ft.
2521 W Marion Avenue #711, PUNTA GORDA, FL 33950
MLS# C7523830Listed by: RE/MAX HARBOR REALTY- Open Sat, 11am to 1pmNew
 $549,500Active4 beds 2 baths2,462 sq. ft.
1601 Park Beach Circle #6/116, PUNTA GORDA, FL 33950
MLS# C7523726Listed by: FIVE STAR REALTY OF CHARLOTTE - New
 $249,900Active2 beds 2 baths1,154 sq. ft.
15375 Green Acres Avenue #2236, Babcock Ranch, FL 33982
MLS# 2026013673Listed by: WORTH CLARK REALTY - New
 $2,100,000Active3 beds 3 baths1,440 sq. ft.
5000 Gasparilla Road #19, BOCA GRANDE, FL 33921
MLS# D6146616Listed by: GULF TO BAY SOTHEBY'S INTERNAT - New
 $237,500Active2 beds 2 baths1,209 sq. ft.
347 Boundary Boulevard #103, ROTONDA WEST, FL 33947
MLS# D6146626Listed by: MICHAEL SAUNDERS & COMPANY - New
 $109,900Active1 beds 1 baths735 sq. ft.
22375 Edgewater Drive #224, PORT CHARLOTTE, FL 33980
MLS# C7523712Listed by: HOME MATCHMAKING REALTY - New
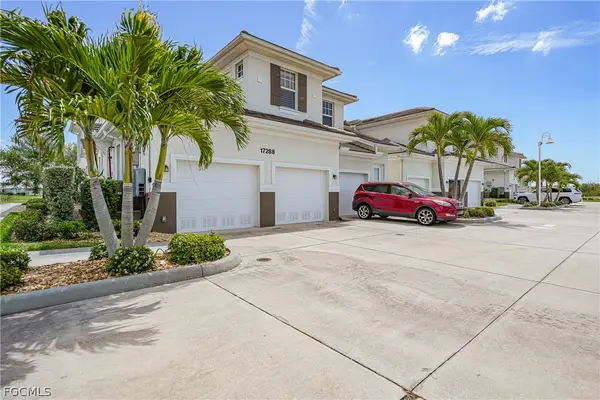 $245,000Active3 beds 2 baths1,644 sq. ft.
17288 Acapulco Road #421, Punta Gorda, FL 33955
MLS# 2026013611Listed by: LPT REALTY, LLC - New
 $650,000Active2 beds 3 baths1,642 sq. ft.
1425 Park Beach Circle #124, PUNTA GORDA, FL 33950
MLS# C7523629Listed by: KW PEACE RIVER PARTNERS - New
 $319,000Active2 beds 2 baths1,366 sq. ft.
14060 Heritage Landing Boulevard #314, Punta Gorda, FL 33955
MLS# 2026013053Listed by: CAPE PREMIER REALTY LLC  $119,900Pending2 beds 2 baths1,118 sq. ft.
96 Boundary Boulevard #132, ROTONDA WEST, FL 33947
MLS# D6146703Listed by: PROGRAM REALTY, LLC $329,000Active3 beds 2 baths1,569 sq. ft.
14277 Heritage Landing Boulevard #1326, Punta Gorda, FL 33955
MLS# 2026012803Listed by: PINNACLE PROPERTY GROUP $199,000Active2 beds 2 baths1,077 sq. ft.
150 Harborside Avenue #204, Punta Gorda, FL 33950
MLS# 2026013636Listed by: ROYAL SHELL REAL ESTATE, INC. $309,000Active1 beds 1 baths668 sq. ft.
7446 Palm Island Drive #3511, PLACIDA, FL 33946
MLS# D6146674Listed by: PALM ISLAND PROPERTIES INC $229,500Active2 beds 2 baths988 sq. ft.
1500 Park Beach Circle #5G, PUNTA GORDA, FL 33950
MLS# C7523529Listed by: FIVE STAR REALTY OF CHARLOTTE $335,000Active2 beds 2 baths1,655 sq. ft.
14234 Heritage Landing Boulevard #1016, PUNTA GORDA, FL 33955
MLS# C7523615Listed by: KELLER WILLIAMS REALTY FT MYER $409,995Pending3 beds 2 baths2,110 sq. ft.
43282 Water Bird Way #6322, Punta Gorda, FL 33982
MLS# 2026013154Listed by: KW ELEVATE LUXURY $325,000Active2 beds 2 baths1,381 sq. ft.
3322 Purple Martin Drive #125, PUNTA GORDA, FL 33950
MLS# C7523443Listed by: HOME MATCHMAKING REALTY $269,900Active2 beds 2 baths1,168 sq. ft.
2601 W Marion Avenue #42A, PUNTA GORDA, FL 33950
MLS# C7523377Listed by: CALENDA REAL ESTATE GROUP,INC.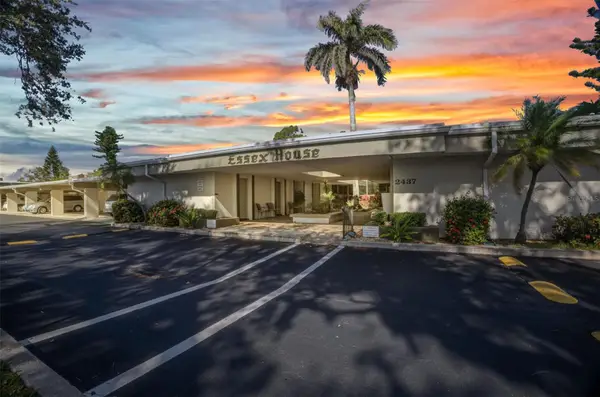 $113,000Active2 beds 2 baths919 sq. ft.
2437 Harbor Boulevard #114, PORT CHARLOTTE, FL 33952
MLS# C7523530Listed by: REALTY HUB $98,000Active1 beds 1 baths634 sq. ft.
3006 Caring Way #301, PORT CHARLOTTE, FL 33952
MLS# C7522196Listed by: VIP REALTY GROUP, INC. $129,900Active2 beds 2 baths860 sq. ft.
25100 Sandhill Boulevard #C202, PUNTA GORDA, FL 33983
MLS# C7523464Listed by: REALTY ONE GROUP MVP $465,000Active3 beds 2 baths2,376 sq. ft.
16422 Willogreen Road #1322, Babcock Ranch, FL 33982
MLS# 226011830Listed by: LENNAR REALTY INC $385,000Active3 beds 2 baths1,710 sq. ft.
16392 Willowgreen Road #812, Babcock Ranch, FL 33982
MLS# 226011832Listed by: LENNAR REALTY INC $249,900Active2 beds 2 baths1,380 sq. ft.
14257 Heritage Landing Boulevard #1115, PUNTA GORDA, FL 33955
MLS# C7523553Listed by: EXP REALTY LLC $215,000Active2 beds 2 baths1,024 sq. ft.
19385 Water Oak Drive #304, PORT CHARLOTTE, FL 33948
MLS# C7523375Listed by: RE/MAX PALM REALTY $108,000Active2 beds 2 baths1,153 sq. ft.
175 Kings Highway #635, PUNTA GORDA, FL 33983
MLS# C7522507Listed by: KW PEACE RIVER PARTNERS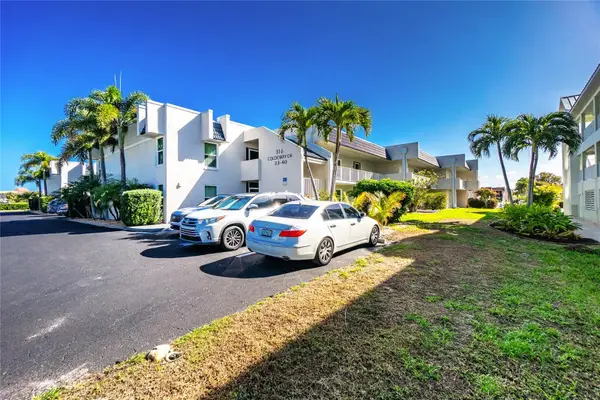 $295,000Active2 beds 2 baths1,412 sq. ft.
316 Coldeway Drive #38, PUNTA GORDA, FL 33950
MLS# C7523477Listed by: RE/MAX ALLIANCE GROUP $159,900Active2 beds 2 baths1,056 sq. ft.
1531 Placida Road #8-202, ENGLEWOOD, FL 34223
MLS# D6145382Listed by: MICHAEL SAUNDERS & COMPANY- Open Sat, 11am to 1pm
 $249,900Active2 beds 2 baths1,180 sq. ft.
208 Lewis Circle #A1, PUNTA GORDA, FL 33950
MLS# C7523402Listed by: ERA ADVANTAGE REALTY, INC.  $320,000Active3 beds 2 baths1,517 sq. ft.
2002 Bal Harbor Boulevard #1022, PUNTA GORDA, FL 33950
MLS# C7523362Listed by: MARINA PARK REALTY LLC
 $349,000Active3 beds 2 baths1,626 sq. ft.
4696 Club Drive #102, PORT CHARLOTTE, FL 33953
MLS# D6146488Listed by: RIVERWOOD REALTY $137,900Active2 beds 2 baths886 sq. ft.
25225 Rampart Boulevard #105, PUNTA GORDA, FL 33983
MLS# C7523390Listed by: RE/MAX PALM REALTY $695,000Active3 beds 3 baths1,568 sq. ft.
7466 Palm Island Drive #2922, PLACIDA, FL 33946
MLS# A4684521Listed by: EXP REALTY LLC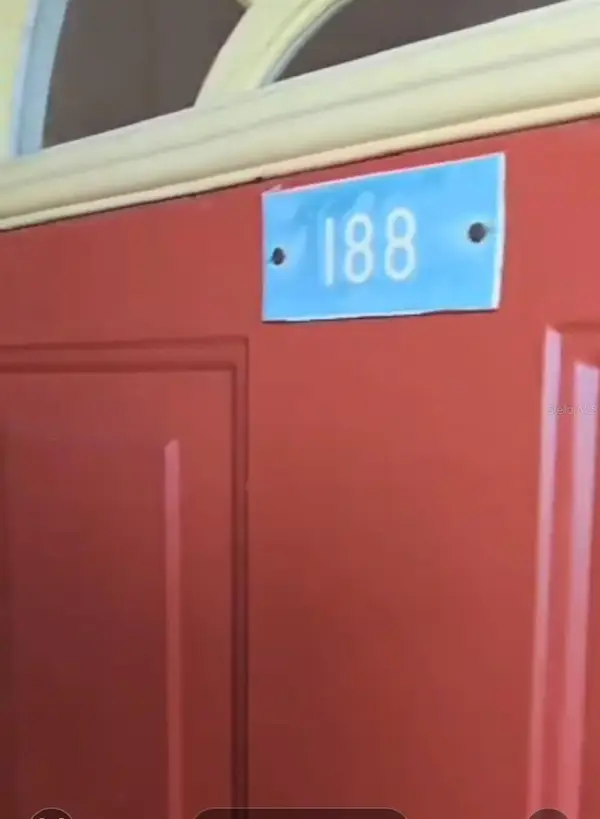 $134,750Active2 beds 2 baths1,092 sq. ft.
6800 Placida Road #188, ENGLEWOOD, FL 34224
MLS# D6146613Listed by: PARADISE EXCLUSIVE INC $210,000Active2 beds 2 baths1,120 sq. ft.
43060 Greenway Boulevard #714, Punta Gorda, FL 33982
MLS# 226011250Listed by: DOMAINREALTY.COM LLC $450,000Pending2 beds 3 baths2,106 sq. ft.
96 Vivante Boulevard #9625, PUNTA GORDA, FL 33950
MLS# C7523383Listed by: COLDWELL BANKER SUNSTAR REALTY $189,900Active2 beds 2 baths1,049 sq. ft.
1461 Aqui Esta Drive #B3, PUNTA GORDA, FL 33950
MLS# C7523132Listed by: COMPASS FLORIDA $120,000Active1 beds 1 baths689 sq. ft.
1515 Forrest Nelson Boulevard #P208, PORT CHARLOTTE, FL 33952
MLS# C7523346Listed by: COLDWELL BANKER SUNSTAR REALTY $320,000Active2 beds 2 baths1,102 sq. ft.
3670 Bal Harbor Boulevard #1F, PUNTA GORDA, FL 33950
MLS# C7523009Listed by: FIVE STAR REALTY OF CHARLOTTE $218,000Active2 beds 2 baths1,198 sq. ft.
14201 Heritage Landing Boulevard #1316, PUNTA GORDA, FL 33955
MLS# C7522983Listed by: CALENDA REAL ESTATE GROUP,INC. $1,945,000Active2 beds 2 baths1,323 sq. ft.
5000 Gasparilla Road #12B, BOCA GRANDE, FL 33921
MLS# D6146553Listed by: BOCA GRANDE REAL ESTATE, INC. $499,000Active2 beds 1 baths1,108 sq. ft.
2375 N Beach Road #2B, ENGLEWOOD, FL 34223
MLS# D6146576Listed by: KELLER WILLIAMS ISLAND LIFE REAL ESTATE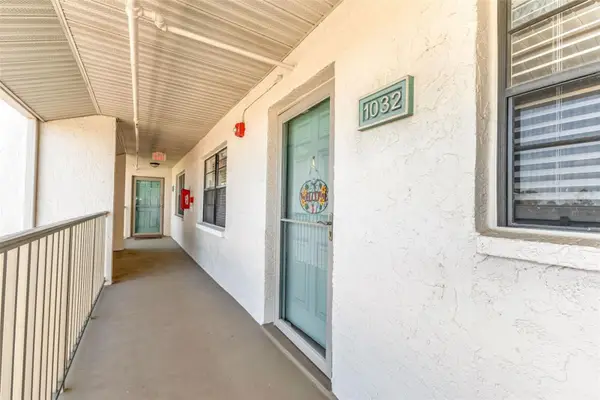 $125,000Active2 beds 2 baths1,153 sq. ft.
175 Kings Highway #1032, PUNTA GORDA, FL 33983
MLS# C7523308Listed by: KELLER WILLIAMS ISLAND LIFE REAL ESTATE $385,000Active2 beds 3 baths1,852 sq. ft.
24329 Baltic Avenue #204, PUNTA GORDA, FL 33955
MLS# C7523118Listed by: KW PEACE RIVER PARTNERS $224,900Active2 beds 2 baths1,549 sq. ft.
6800 Placida Road #TH2, 1B, ENGLEWOOD, FL 34224
MLS# D6146579Listed by: RE/MAX ALLIANCE GROUP $144,900Active2 beds 2 baths1,405 sq. ft.
23465 Harborview Road #814, PUNTA GORDA, FL 33980
MLS# A4685936Listed by: EXP REALTY LLC- Open Sat, 11am to 2pm
 $595,900Active3 beds 2 baths2,018 sq. ft.
200 Harbor Walk Drive #354, PUNTA GORDA, FL 33950
MLS# C7523258Listed by: JOHN R WOOD PROPERTIES  $329,000Pending3 beds 2 baths1,517 sq. ft.
2002 Bal Harbor Boulevard #1311, PUNTA GORDA, FL 33950
MLS# C7523289Listed by: RE/MAX ALLIANCE GROUP $179,000Active3 beds 2 baths1,011 sq. ft.
19505 Quesada Avenue #VV201, PORT CHARLOTTE, FL 33948
MLS# A4686071Listed by: SUN GLOW PROPERTY MANAGEMENT LLC $196,500Active2 beds 2 baths1,141 sq. ft.
3919 Cape Haze Drive #505, ROTONDA WEST, FL 33947
MLS# C7523276Listed by: BARNES & PHILLIPS REAL ESTATE $130,000Pending2 beds 2 baths950 sq. ft.
4260 Placida Road #24B, ENGLEWOOD, FL 34224
MLS# N6143242Listed by: PARADISE EXCLUSIVE INC $247,700Pending3 beds 2 baths1,517 sq. ft.
2002 Bal Harbor Boulevard #312, PUNTA GORDA, FL 33950
MLS# C7523259Listed by: KW PEACE RIVER PARTNERS $310,000Active2 beds 2 baths1,070 sq. ft.
1701 Beach Road #312, ENGLEWOOD, FL 34223
MLS# D6146505Listed by: COASTAL PREMIER PROPERTIES $145,000Pending2 beds 2 baths1,070 sq. ft.
3300 Loveland Boulevard #3004, PORT CHARLOTTE, FL 33980
MLS# C7523032Listed by: FIVE STAR REALTY OF CHARLOTTE $184,900Pending2 beds 2 baths1,165 sq. ft.
1335 Saxony Circle #314, PUNTA GORDA, FL 33983
MLS# A4685255Listed by: PALM PARADISE REALTY GROUP $220,000Active2 beds 2 baths996 sq. ft.
8407 Placida Road #202, PLACIDA, FL 33946
MLS# A4685394Listed by: FINE PROPERTIES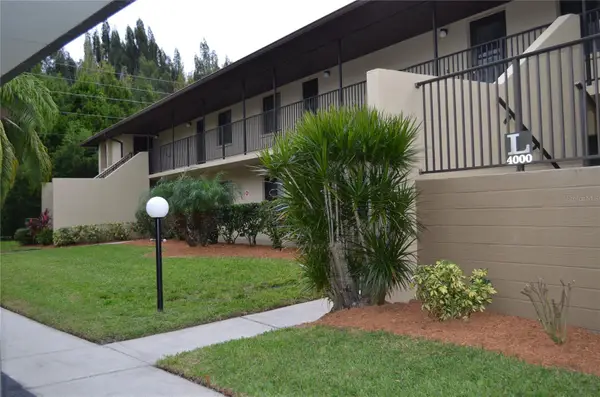 $168,900Active2 beds 2 baths893 sq. ft.
4000 Oakview Drive #L8, PUNTA GORDA, FL 33980
MLS# C7521938Listed by: HOLDAWAY HOMES REALTY LLC $167,800Active2 beds 2 baths893 sq. ft.
4024 Oakview Drive #I2, PUNTA GORDA, FL 33980
MLS# C7522036Listed by: HOLDAWAY HOMES REALTY LLC $135,000Active2 beds 2 baths838 sq. ft.
19505 Quesada Avenue #P202, PORT CHARLOTTE, FL 33948
MLS# C7522937Listed by: RE/MAX PALM REALTY $275,000Active3 beds 3 baths1,759 sq. ft.
5115 Melbourne Street #A103, PUNTA GORDA, FL 33980
MLS# C7523035Listed by: RE/MAX PALM REALTY $132,000Active2 beds 2 baths1,070 sq. ft.
3300 Loveland Boulevard #1603, PUNTA GORDA, FL 33980
MLS# A4685885Listed by: REALTY ONE GROUP MVP $325,000Active2 beds 1 baths594 sq. ft.
1385 Gulf Boulevard #3-8, ENGLEWOOD, FL 34223
MLS# A4685795Listed by: REAL RE GROUP LLC $149,000Active2 beds 2 baths899 sq. ft.
1515 Forrest Nelson Boulevard #J204, PORT CHARLOTTE, FL 33952
MLS# N6143331Listed by: NEXTHOME EXCELLENCE $87,000Active2 beds 2 baths919 sq. ft.
21260 Brinson Avenue #212, PORT CHARLOTTE, FL 33952
MLS# C7523151Listed by: COLDWELL BANKER SUNSTAR REALTY $259,900Active2 beds 2 baths1,120 sq. ft.
15835 Green Acres Avenue #3344, Babcock Ranch, FL 33982
MLS# 226010699Listed by: LENNAR REALTY INC $274,000Active2 beds 2 baths1,301 sq. ft.
15835 Green Acres Avenue #3311, Babcock Ranch, FL 33982
MLS# 226010700Listed by: LENNAR REALTY INC $249,900Active2 beds 2 baths1,154 sq. ft.
15835 Green Acres Avenue #3316, Babcock Ranch, FL 33982
MLS# 226010702Listed by: LENNAR REALTY INC $224,497Active2 beds 2 baths1,120 sq. ft.
15345 Green Acres Avenue #2115, Babcock Ranch, FL 33982
MLS# 226010703Listed by: LENNAR REALTY INC $219,900Active2 beds 2 baths1,120 sq. ft.
15375 Green Acres Avenue #2225, Babcock Ranch, FL 33982
MLS# 226010704Listed by: LENNAR REALTY INC $329,900Active2 beds 2 baths1,366 sq. ft.
15765 Green Acres Avenue #2826, Babcock Ranch, FL 33982
MLS# 226010706Listed by: LENNAR REALTY INC $329,900Pending2 beds 2 baths1,355 sq. ft.
15765 Green Acres Avenue #2827, Babcock Ranch, FL 33982
MLS# 226010707Listed by: LENNAR REALTY INC $264,000Active2 beds 2 baths1,366 sq. ft.
15435 Green Acres Avenue #2413, Babcock Ranch, FL 33982
MLS# 226010711Listed by: LENNAR REALTY INC $279,000Active3 beds 2 baths1,498 sq. ft.
255 West End Boulevard #4306, PUNTA GORDA, FL 33950
MLS# C7522062Listed by: RE/MAX PALM REALTY $248,900Active2 beds 2 baths1,138 sq. ft.
3256 White Ibis Court #324, PUNTA GORDA, FL 33950
MLS# N6143232Listed by: KELLER WILLIAMS ISLAND LIFE REAL ESTATE $128,000Active2 beds 2 baths1,092 sq. ft.
6800 Placida Road #163, ENGLEWOOD, FL 34224
MLS# D6146367Listed by: THE SUNNYBROOK REALTY LLC $180,000Active2 beds 2 baths1,187 sq. ft.
101 Normandy Way #204, ROTONDA WEST, FL 33947
MLS# C7523079Listed by: ERA ADVANTAGE REALTY, INC. $439,000Active2 beds 2 baths1,670 sq. ft.
3311 Wood Thrush Drive #113, PUNTA GORDA, FL 33950
MLS# C7522981Listed by: COMPASS FLORIDA LLC $250,000Active2 beds 2 baths1,077 sq. ft.
150 Harborside Avenue #307, PUNTA GORDA, FL 33950
MLS# A4685373Listed by: KELLER WILLIAMS ISLAND LIFE REAL ESTATE $279,000Active2 beds 2 baths1,198 sq. ft.
14041 Heritage Landing Boulevard #613, Punta Gorda, FL 33955
MLS# 2026002090Listed by: PRO GULF PROPERTIES LLC $269,900Active2 beds 2 baths1,366 sq. ft.
14221 Heritage Landing Boulevard #2025, PUNTA GORDA, FL 33955
MLS# C7522811Listed by: EXIT GULF COAST REALTY $435,000Pending3 beds 2 baths2,110 sq. ft.
14009 Black Beauty Drive #222, PUNTA GORDA, FL 33955
MLS# C7522956Listed by: CALENDA REAL ESTATE GROUP,INC. $239,900Pending3 beds 2 baths1,450 sq. ft.
1091 Live Oak #214, PORT CHARLOTTE, FL 33948
MLS# C7522988Listed by: PREMIERE PLUS REALTY COMPANY $227,000Active2 beds 2 baths1,327 sq. ft.
14016 Willow Glen Court #212, PORT CHARLOTTE, FL 33953
MLS# D6146464Listed by: FLORIDIAN REALTY SERVICES, LLC $149,900Active2 beds 2 baths924 sq. ft.
2061 Willow Hammock Circle #104, PUNTA GORDA, FL 33983
MLS# C7522693Listed by: COLDWELL BANKER REALTY $120,000Active2 beds 2 baths919 sq. ft.
4158 Tamiami Trail #F5, PORT CHARLOTTE, FL 33952
MLS# C7522935Listed by: RIVERSIDE REALTY SERVICES LLC $1,075,000Active1 beds 1 baths730 sq. ft.
5000 Gasparilla Road #BC205, BOCA GRANDE, FL 33921
MLS# D6146490Listed by: PARSLEY BALDWIN REAL ESTATE $420,000Active3 beds 2 baths2,110 sq. ft.
15919 Grassland Lane #4221, Punta Gorda, FL 33982
MLS# 2026011377Listed by: NICKLAUS VANCE $1,795,000Active2 beds 2 baths1,315 sq. ft.
5000 Gasparilla Road #56A, BOCA GRANDE, FL 33921
MLS# D6146406Listed by: GULF TO BAY SOTHEBY'S INTERNAT $419,000Pending2 beds 2 baths1,751 sq. ft.
1 Colony Point Drive #7C, PUNTA GORDA, FL 33950
MLS# C7522853Listed by: RE/MAX HARBOR REALTY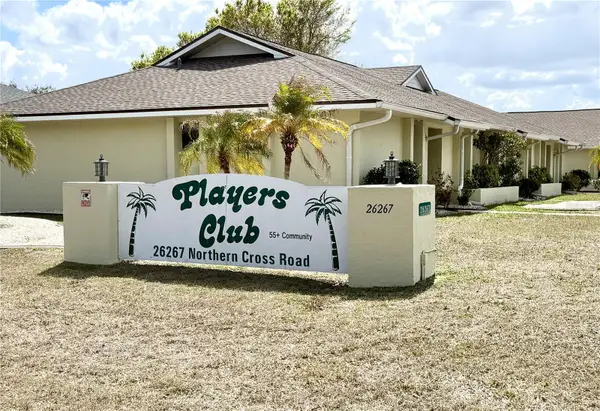 $137,900Active2 beds 2 baths891 sq. ft.
26267 Northern Cross Road #1A, PUNTA GORDA, FL 33983
MLS# C7522701Listed by: ALLISON JAMES ESTATES & HOMES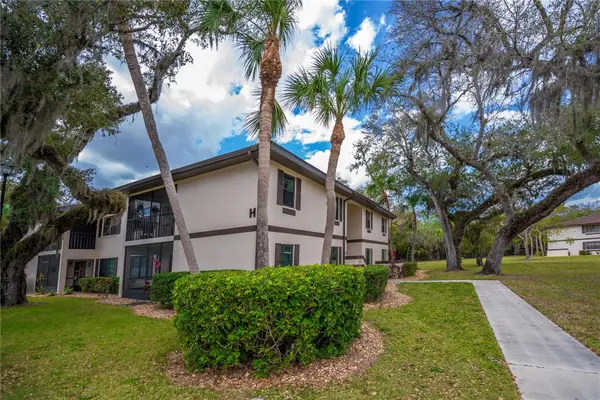 $234,900Active3 beds 2 baths1,011 sq. ft.
19505 Quesada Avenue #H101, PORT CHARLOTTE, FL 33948
MLS# C7522820Listed by: COLDWELL BANKER SUNSTAR REALTY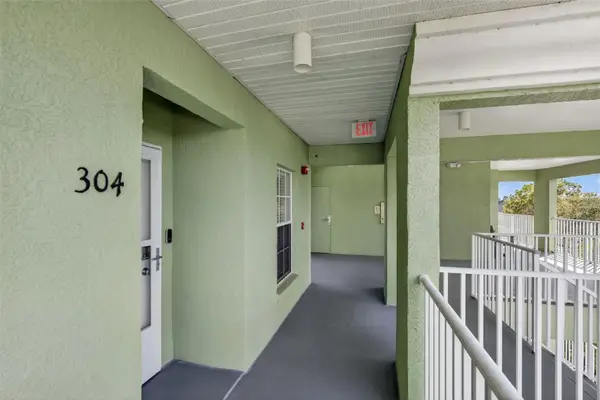 $179,900Active2 beds 2 baths924 sq. ft.
2020 Willow Hammock Circle #304, PUNTA GORDA, FL 33983
MLS# N6143240Listed by: COLDWELL BANKER REALTY $159,900Active3 beds 2 baths1,293 sq. ft.
2180 Heron Lake Drive #308, PUNTA GORDA, FL 33983
MLS# C7522434Listed by: MICHAEL SAUNDERS & COMPANY $169,000Active2 beds 2 baths887 sq. ft.
19335 Water Oak Drive #204, PORT CHARLOTTE, FL 33948
MLS# C7522884Listed by: MARINA PARK REALTY LLC $480,000Active3 beds 2 baths2,222 sq. ft.
14655 Sycamore Court #3121, PUNTA GORDA, FL 33955
MLS# C7522921Listed by: CRIMALDI & ASSOCIATES, LLC $189,000Active2 beds 2 baths1,150 sq. ft.
14459 River Beach Drive #104, PORT CHARLOTTE, FL 33953
MLS# TB8483268Listed by: GROW PROSPER MOVE REALTY $629,000Active2 beds 3 baths1,688 sq. ft.
11160 Hacienda Del Mar Boulevard #D-303, PLACIDA, FL 33946
MLS# D6146470Listed by: MICHAEL SAUNDERS & CO. - BOCA $2,450,000Active3 beds 3 baths1,640 sq. ft.
5000 Gasparilla Road #VH20, BOCA GRANDE, FL 33921
MLS# D6146472Listed by: GULF TO BAY SOTHEBY'S INTERNAT $682,000Active2 beds 3 baths1,782 sq. ft.
1425 Park Beach Circle #132, PUNTA GORDA, FL 33950
MLS# C7522854Listed by: RE/MAX HARBOR REALTY $164,900Active2 beds 2 baths1,320 sq. ft.
23465 Harborview Road #842, PORT CHARLOTTE, FL 33980
MLS# C7522845Listed by: ERA ADVANTAGE REALTY, INC. $76,230Active2 beds 2 baths919 sq. ft.
2290 Aaron Street #209, PORT CHARLOTTE, FL 33952
MLS# TB8483193Listed by: MARC JOSEPH REALTY, INC $375,000Active3 beds 2 baths1,710 sq. ft.
16398 Willowgreen Road #912, Babcock Ranch, FL 33982
MLS# 226007815Listed by: LENNAR REALTY INC $165,900Active2 beds 2 baths1,037 sq. ft.
25188 Marion Avenue #F403, PUNTA GORDA, FL 33950
MLS# C7522814Listed by: GRANT TEAM REAL ESTATE, LLC $109,900Active2 beds 2 baths919 sq. ft.
21280 Brinson Avenue #106, PORT CHARLOTTE, FL 33952
MLS# C7522611Listed by: COLDWELL BANKER REALTY $209,000Pending2 beds 2 baths1,194 sq. ft.
43993 Boardwalk Loop #1943, Punta Gorda, FL 33982
MLS# 2026008466Listed by: WATERSEDGE REALTY GROUP LLC $254,900Active2 beds 2 baths1,198 sq. ft.
14081 Heritage Landing Boulevard #246, Punta Gorda, FL 33955
MLS# 2026010813Listed by: RE/MAX PALM REALTY $317,900Active2 beds 3 baths1,350 sq. ft.
1433 Mediterranean Drive #E, PUNTA GORDA, FL 33950
MLS# C7522654Listed by: COLDWELL BANKER SUNSTAR REALTY $279,000Pending3 beds 2 baths1,808 sq. ft.
25567 Heritage Lake Boulevard #29, PUNTA GORDA, FL 33983
MLS# C7522548Listed by: FIVE STAR REALTY OF CHARLOTTE $169,900Active2 beds 2 baths1,114 sq. ft.
1080 Bal Harbor Boulevard #10C, PUNTA GORDA, FL 33950
MLS# C7522709Listed by: JOHN R WOOD PROPERTIES $129,000Active2 beds 2 baths1,025 sq. ft.
24540 Harborview Road #C1, PUNTA GORDA, FL 33980
MLS# C7522727Listed by: REALTY ONE GROUP MVP $84,900Active2 beds 2 baths1,092 sq. ft.
6800 Placida Road #193, ENGLEWOOD, FL 34224
MLS# D6146383Listed by: TALL PINES REALTY $230,000Pending3 beds 2 baths1,498 sq. ft.
2001 Bal Harbor Boulevard #2310, PUNTA GORDA, FL 33950
MLS# C7522681Listed by: REMAX LANDMARK $549,000Active3 beds 3 baths2,338 sq. ft.
89 Vivante Boulevard #8943, PUNTA GORDA, FL 33950
MLS# C7522675Listed by: RE/MAX HARBOR REALTY $704,000Active3 beds 3 baths2,338 sq. ft.
87 Vivante Boulevard #8742, PUNTA GORDA, FL 33950
MLS# C7522677Listed by: RE/MAX HARBOR REALTY $149,900Active2 beds 2 baths899 sq. ft.
1515 Forrest Nelson Boulevard #P105, PORT CHARLOTTE, FL 33952
MLS# D6146336Listed by: PARADISE EXCLUSIVE INC $1,135,000Active3 beds 3 baths2,103 sq. ft.
11000 Placida Road #2602, PLACIDA, FL 33946
MLS# D6146390Listed by: BOCA GRANDE REAL ESTATE, INC. $169,000Pending3 beds 2 baths1,293 sq. ft.
2060 Willow Hammock Circle #301, PUNTA GORDA, FL 33983
MLS# C7522671Listed by: COLDWELL BANKER SUNSTAR REALTY $230,000Active2 beds 2 baths1,626 sq. ft.
4683 Club Drive #101, PORT CHARLOTTE, FL 33953
MLS# D6145973Listed by: RIVERWOOD REALTY $220,000Active2 beds 2 baths1,230 sq. ft.
8101 Memory Lane #122, ROTONDA WEST, FL 33947
MLS# D6146317Listed by: MICHAEL SAUNDERS & COMPANY $575,000Active2 beds 2 baths1,285 sq. ft.
2424 Placida Road #C101, ENGLEWOOD, FL 34224
MLS# D6146323Listed by: MICHAEL SAUNDERS & CO. - BOCA $250,000Active2 beds 2 baths1,398 sq. ft.
601 Shreve Street #25A, PUNTA GORDA, FL 33950
MLS# C7522383Listed by: REALTY ONE GROUP MVP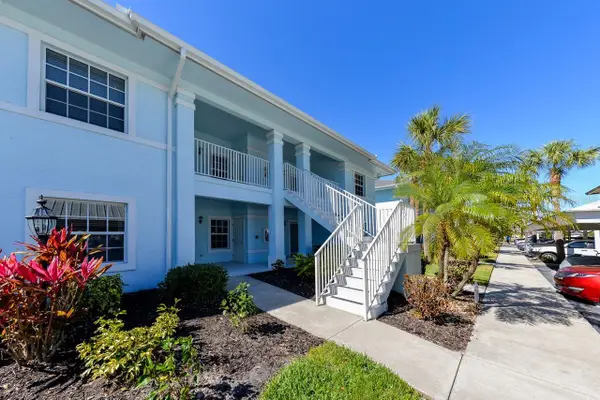 $168,900Active2 beds 2 baths1,250 sq. ft.
1479 San Cristobal Avenue #2104, PUNTA GORDA, FL 33983
MLS# C7522373Listed by: KW PEACE RIVER PARTNERS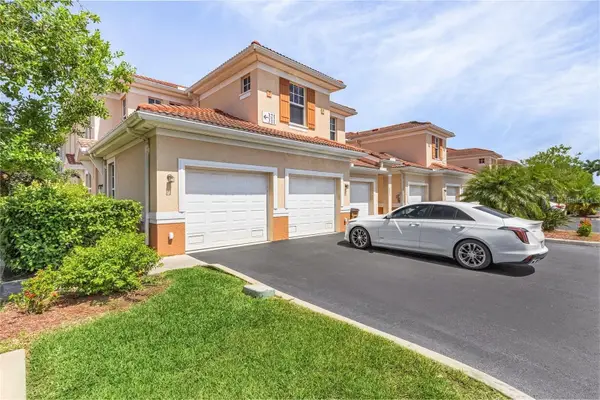 $270,000Pending2 beds 2 baths1,306 sq. ft.
240 W End Drive #311, PUNTA GORDA, FL 33950
MLS# A4684181Listed by: EXP REALTY LLC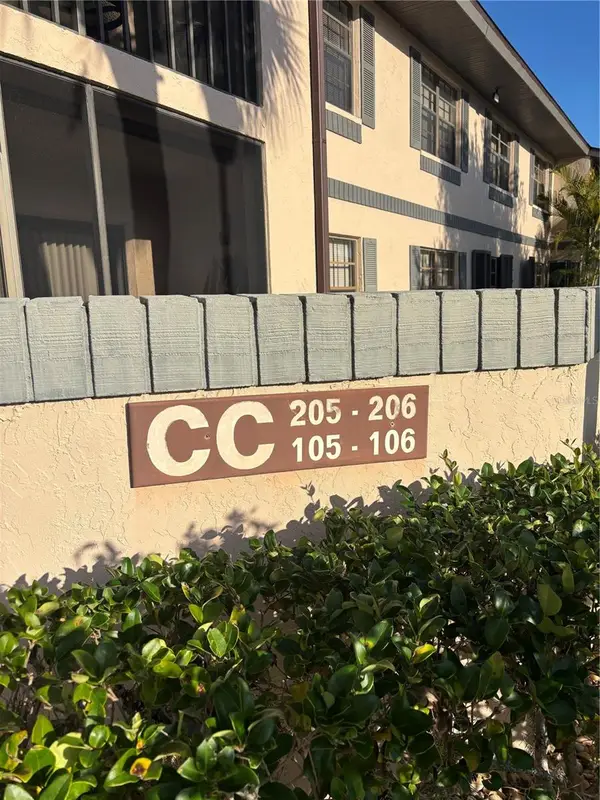 $135,000Active2 beds 2 baths899 sq. ft.
19505 Quesada Avenue #CC205, PORT CHARLOTTE, FL 33948
MLS# C7522538Listed by: EXIT GULF COAST REALTY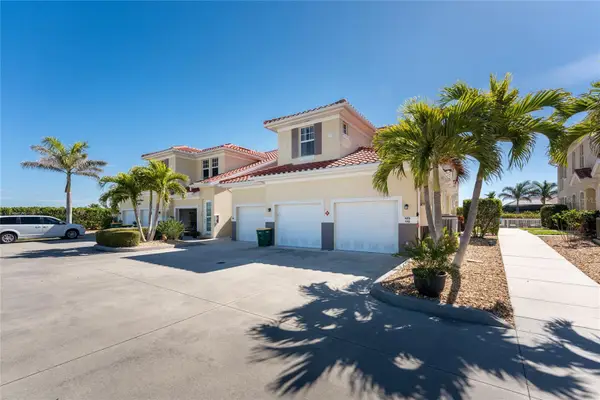 $249,000Active3 beds 2 baths1,644 sq. ft.
17200 Acapulco Road #123, PUNTA GORDA, FL 33955
MLS# C7522494Listed by: CALENDA REAL ESTATE GROUP,INC.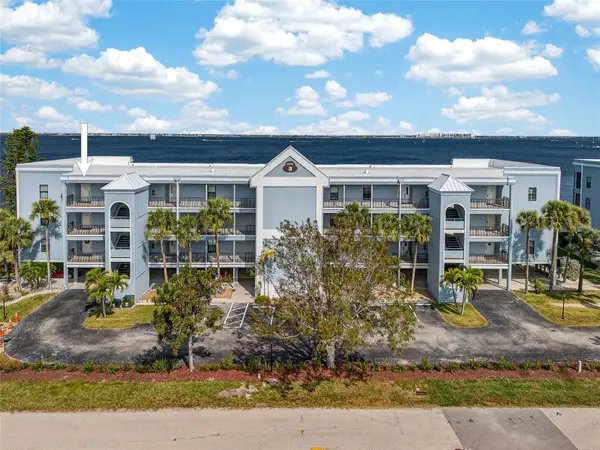 $575,000Active3 beds 2 baths1,916 sq. ft.
1750 Jamaica Way #311, PUNTA GORDA, FL 33950
MLS# C7522038Listed by: COMPASS FLORIDA $475,000Active2 beds 2 baths1,357 sq. ft.
2255 N Beach Road #20, ENGLEWOOD, FL 34223
MLS# D6146319Listed by: PARADISE EXCLUSIVE INC- Open Thu, 1 to 3pm
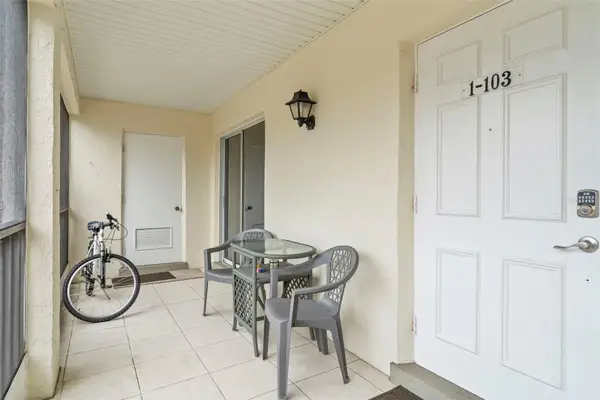 $195,000Active2 beds 2 baths1,056 sq. ft.
1531 Placida Road #1-103, ENGLEWOOD, FL 34223
MLS# N6143037Listed by: KELLER WILLIAMS ISLAND LIFE REAL ESTATE  $769,000Active3 beds 3 baths1,568 sq. ft.
7494 Palm Island Drive #2224, PLACIDA, FL 33946
MLS# D6146320Listed by: PALM ISLAND PROPERTIES INC $110,000Active2 beds 2 baths783 sq. ft.
3006 Caring Way #224, PORT CHARLOTTE, FL 33952
MLS# C7521699Listed by: KW PEACE RIVER PARTNERS $250,000Pending2 beds 2 baths1,398 sq. ft.
601 Shreve Street #33A, PUNTA GORDA, FL 33950
MLS# C7521892Listed by: RE/MAX PALM REALTY $265,000Active2 beds 2 baths1,150 sq. ft.
14459 River Beach Drive #221, PORT CHARLOTTE, FL 33953
MLS# C7522458Listed by: JOHN R WOOD PROPERTIES $549,900Active2 beds 2 baths1,624 sq. ft.
11000 Placida Road #1801, PLACIDA, FL 33946
MLS# D6145141Listed by: MICHAEL SAUNDERS & COMPANY $629,000Active4 beds 4 baths2,856 sq. ft.
8571 Amberjack Circle #402, ENGLEWOOD, FL 34224
MLS# D6145414Listed by: PARADISE EXCLUSIVE INC $600,000Active3 beds 2 baths2,018 sq. ft.
200 Harbor Walk Drive #322, PUNTA GORDA, FL 33950
MLS# N6142575Listed by: KELLER WILLIAMS ISLAND LIFE REAL ESTATE $32,000Active2 beds 2 baths1,262 sq. ft.
7201 Rum Bay Dr #4122A, PLACIDA, FL 33946
MLS# D6146304Listed by: PALM ISLAND PROPERTIES INC $499,000Pending3 beds 2 baths1,357 sq. ft.
2255 N Beach Road #14, ENGLEWOOD, FL 34223
MLS# D6146276Listed by: PARADISE EXCLUSIVE INC $140,000Active2 beds 2 baths893 sq. ft.
4000 Oakview Drive #L2, PUNTA GORDA, FL 33980
MLS# C7522389Listed by: GRANT TEAM REAL ESTATE, LLC $50,000Active2 beds 2 baths
Calle 1e #852 Piso 8, Barranquilla, FL 0
MLS# A11893587Listed by: RELATED ISG REALTY, LLC. $414,000Active2 beds 2 baths1,581 sq. ft.
1 Colony Point Drive #13C, PUNTA GORDA, FL 33950
MLS# C7522163Listed by: PEACE HARBOR REAL ESTATE INC. $265,000Active3 beds 2 baths1,644 sq. ft.
17094 Acapulco Road #321, PUNTA GORDA, FL 33955
MLS# C7521839Listed by: CALENDA REAL ESTATE GROUP,INC.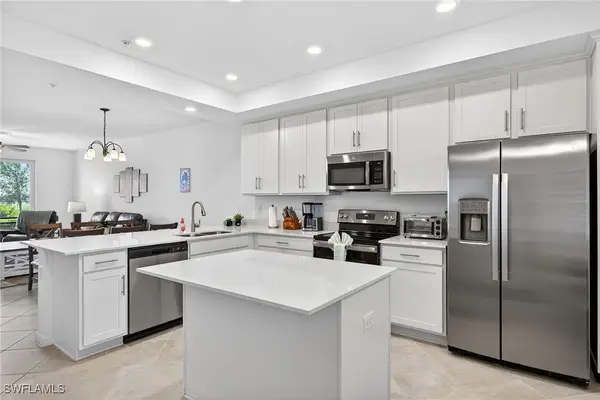 $259,000Active2 beds 2 baths1,194 sq. ft.
43985 Boardwalk Loop #2115, Punta Gorda, FL 33982
MLS# 226004942Listed by: WILLIAM RAVEIS REAL ESTATE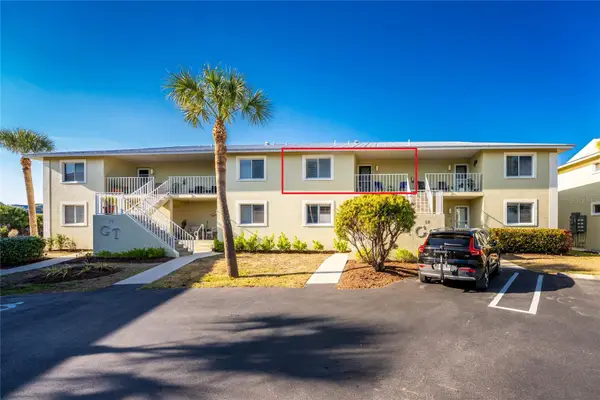 $144,900Active2 beds 2 baths933 sq. ft.
6600 Gasparilla Pines Boulevard #16-211, ENGLEWOOD, FL 34224
MLS# D6146174Listed by: RE/MAX ALLIANCE GROUP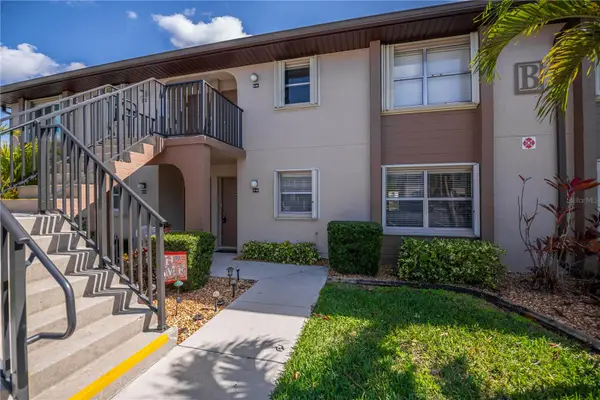 $129,900Active2 beds 2 baths860 sq. ft.
25100 Sandhill Boulevard #B102, PUNTA GORDA, FL 33983
MLS# C7522315Listed by: COLDWELL BANKER SUNSTAR REALTY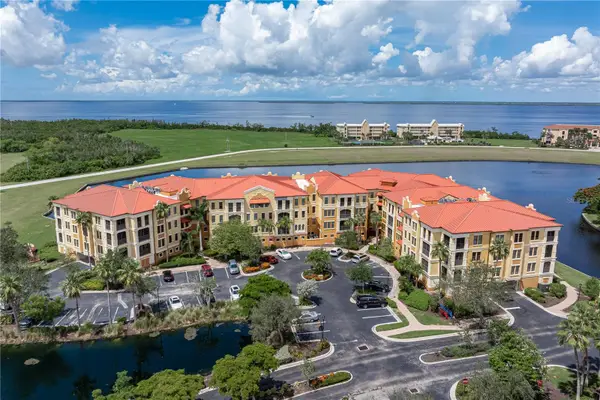 $315,000Active2 beds 2 baths1,698 sq. ft.
99 Vivante Boulevard #9945, PUNTA GORDA, FL 33950
MLS# C7522294Listed by: RE/MAX HARBOR REALTY $145,000Active2 beds 2 baths832 sq. ft.
13100 S Mccall Road #111, PORT CHARLOTTE, FL 33981
MLS# C7522359Listed by: RENAISSANCE REAL ESTATE CONSUL $639,000Active3 beds 2 baths2,018 sq. ft.
200 Harbor Walk Drive #353, PUNTA GORDA, FL 33950
MLS# C7522340Listed by: RE/MAX ALLIANCE GROUP $135,000Active2 beds 2 baths1,228 sq. ft.
93 Boundary Boulevard #303, ROTONDA WEST, FL 33947
MLS# A4682166Listed by: PALM PARADISE REALTY GROUP $359,900Active3 beds 3 baths2,572 sq. ft.
25601 Heritage Lake Boulevard #46, PUNTA GORDA, FL 33983
MLS# C7522230Listed by: COLDWELL BANKER SUNSTAR REALTY $169,900Active3 beds 2 baths1,293 sq. ft.
2020 Willow Hammock Circle #108, PUNTA GORDA, FL 33983
MLS# C7522321Listed by: MARINA PARK REALTY LLC $229,000Active2 beds 2 baths1,394 sq. ft.
601 Shreve Street #66A, PUNTA GORDA, FL 33950
MLS# C7522022Listed by: FIVE STAR REALTY OF CHARLOTTE $325,000Active3 beds 2 baths1,586 sq. ft.
240 W End Drive #1123, PUNTA GORDA, FL 33950
MLS# C7522297Listed by: RE/MAX HARBOR REALTY $144,900Active3 beds 2 baths1,146 sq. ft.
200 Rotonda Boulevard W #A4, ROTONDA WEST, FL 33947
MLS# C7522279Listed by: CHARLOTTE COUNTY PROPERTIES $575,000Active2 beds 3 baths1,688 sq. ft.
11220 Hacienda Del Mar Boulevard #204, PLACIDA, FL 33946
MLS# D6146215Listed by: BETTER HOMES AND GARDENS REAL ESTATE LIFESTYLES REALTY $439,900Active3 beds 2 baths1,882 sq. ft.
3308 Purple Martin Drive #122, PUNTA GORDA, FL 33950
MLS# C7522275Listed by: COLDWELL BANKER SUNSTAR REALTY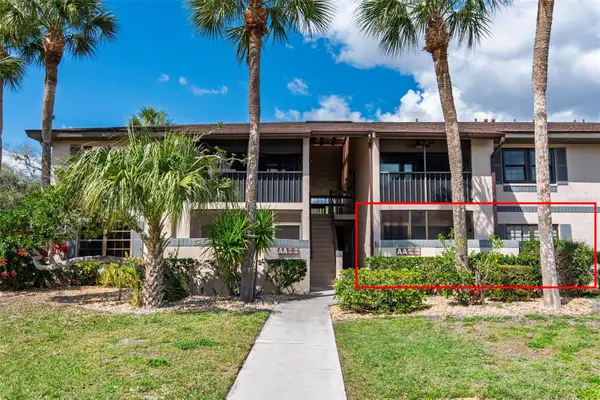 $168,000Active2 beds 2 baths899 sq. ft.
19505 Quesada Avenue #AA105, PORT CHARLOTTE, FL 33948
MLS# C7522126Listed by: SELLSTATE VISION REALTY $288,900Active2 beds 2 baths1,150 sq. ft.
14459 River Beach Drive #C218, PORT CHARLOTTE, FL 33953
MLS# D6146197Listed by: PROGRAM REALTY, LLC $845,000Active1 beds 1 baths730 sq. ft.
5000 Gasparilla Road #DC107, BOCA GRANDE, FL 33921
MLS# D6146091Listed by: GULF TO BAY SOTHEBY'S INTERNAT $525,000Active2 beds 2 baths1,070 sq. ft.
1551 Beach Road #204, ENGLEWOOD, FL 34223
MLS# D6146166Listed by: PARADISE EXCLUSIVE INC $319,900Active3 beds 2 baths1,517 sq. ft.
2002 Bal Harbor Boulevard #1921, PUNTA GORDA, FL 33950
MLS# C7522160Listed by: MICHAEL SAUNDERS & COMPANY $259,000Active2 beds 2 baths1,170 sq. ft.
6468 Hamlet Drive #4B, ENGLEWOOD, FL 34224
MLS# D6146235Listed by: MICHAEL SAUNDERS & COMPANY $525,000Active3 beds 2 baths2,043 sq. ft.
1650 W Marion Avenue #123, PUNTA GORDA, FL 33950
MLS# C7521998Listed by: FIVE STAR REALTY OF CHARLOTTE $134,900Active2 beds 2 baths886 sq. ft.
25225 Rampart Boulevard #1606, PUNTA GORDA, FL 33983
MLS# C7522144Listed by: RE/MAX HARBOR REALTY $199,000Active1 beds 1 baths668 sq. ft.
7454 Palm Island Drive #3311, PLACIDA, FL 33946
MLS# C7522136Listed by: COLDWELL BANKER SUNSTAR REALTY $135,000Pending2 beds 2 baths924 sq. ft.
2040 Willow Hammock Circle #304, PUNTA GORDA, FL 33983
MLS# C7521760Listed by: KW PEACE RIVER PARTNERS $269,000Pending3 beds 2 baths2,041 sq. ft.
4697 Club Drive #201, PORT CHARLOTTE, FL 33953
MLS# D6146240Listed by: RIVERWOOD REALTY $329,000Pending2 beds 2 baths1,355 sq. ft.
43031 Greenway Boulevard #1027, Punta Gorda, FL 33982
MLS# 226007516Listed by: REALTY ONE GROUP MVP $364,900Pending3 beds 2 baths1,586 sq. ft.
1323 Mediterranean Drive #212, PUNTA GORDA, FL 33950
MLS# C7521858Listed by: GRANT TEAM REAL ESTATE, LLC $489,900Active2 beds 2 baths1,690 sq. ft.
1400 Beach Road #1, ENGLEWOOD, FL 34223
MLS# D6146188Listed by: GULF REALTY & ASSOCIATES LLC $249,900Active2 beds 2 baths1,227 sq. ft.
19300 Water Oak Drive #102, PORT CHARLOTTE, FL 33948
MLS# C7521931Listed by: COLDWELL BANKER SUNSTAR REALTY $249,900Active2 beds 2 baths1,488 sq. ft.
3393 Grand Vista Court #101, PORT CHARLOTTE, FL 33953
MLS# C7522099Listed by: PEACE HARBOR REAL ESTATE INC. $333,000Pending3 beds 2 baths1,517 sq. ft.
2002 Bal Harbor Boulevard #1711, PUNTA GORDA, FL 33950
MLS# C7521918Listed by: RE/MAX ALLIANCE GROUP $199,000Active2 beds 2 baths1,200 sq. ft.
3224 White Ibis Court #B1-3, PUNTA GORDA, FL 33950
MLS# C7521946Listed by: FIVE STAR REALTY OF CHARLOTTE $129,900Active2 beds 2 baths1,037 sq. ft.
6796 Gasparilla Pines Boulevard #51, ENGLEWOOD, FL 34224
MLS# D6146145Listed by: RE/MAX ALLIANCE GROUP $189,000Active2 beds 1 baths1,034 sq. ft.
232 W Henry Street, PUNTA GORDA, FL 33950
MLS# C7522021Listed by: COLDWELL BANKER SUNSTAR REALTY $289,900Active3 beds 2 baths1,623 sq. ft.
3433 Grand Vista Court #202, PORT CHARLOTTE, FL 33953
MLS# C7521941Listed by: NEWAGE HOME REALTY $226,800Active2 beds 2 baths1,285 sq. ft.
9550 Fiddlers Green Circle #206, ROTONDA WEST, FL 33947
MLS# D6146159Listed by: TALL PINES REALTY $119,900Active1 beds 1 baths550 sq. ft.
21150 Gertrude Avenue #B-4, PORT CHARLOTTE, FL 33952
MLS# D6146113Listed by: KELLER WILLIAMS ISLAND LIFE REAL ESTATE $289,000Active2 beds 2 baths1,194 sq. ft.
14061 Heritage Landing Boulevard #443, PUNTA GORDA, FL 33955
MLS# O6382747Listed by: BEYCOME OF FLORIDA LLC $229,000Active2 beds 2 baths1,200 sq. ft.
3230 White Ibis Court #A2-2, Punta Gorda, FL 33950
MLS# 2026008185Listed by: DALTON WADE INC $214,000Active2 beds 2 baths1,409 sq. ft.
6699 San Casa Drive #T1, ENGLEWOOD, FL 34224
MLS# C7521724Listed by: ANYTIME REALTY LLC $129,900Active2 beds 2 baths933 sq. ft.
6796 Gasparilla Pines Boulevard #34, ENGLEWOOD, FL 34224
MLS# A4679027Listed by: WILLIAM RAVEIS REAL ESTATE $259,000Active2 beds 2 baths1,327 sq. ft.
14017 Willow Glen Court #104, PORT CHARLOTTE, FL 33953
MLS# D6145970Listed by: RIVERWOOD REALTY $499,000Active3 beds 2 baths2,222 sq. ft.
14001 Black Beauty Drive #122, PUNTA GORDA, FL 33955
MLS# C7521965Listed by: CRIMALDI & ASSOCIATES, LLC $1,495,000Active3 beds 3 baths2,103 sq. ft.
11000 Placida Road #2501, PLACIDA, FL 33946
MLS# D6146140Listed by: THE BRC GROUP, LLC $89,000Active2 beds 1 baths780 sq. ft.
1999 Kings Highway #133C, PUNTA GORDA, FL 33980
MLS# N6142891Listed by: SHARK TOOTH REALTY $289,000Pending3 beds 2 baths2,191 sq. ft.
25188 Marion Avenue #D112, PUNTA GORDA, FL 33950
MLS# C7521885Listed by: GRANT TEAM REAL ESTATE, LLC $525,000Active2 beds 2 baths1,188 sq. ft.
6005 N Beach Road #16, ENGLEWOOD, FL 34223
MLS# D6146129Listed by: MICHAEL SAUNDERS & COMPANY $480,000Active3 beds 2 baths2,222 sq. ft.
14017 Black Beauty Drive #322, PUNTA GORDA, FL 33955
MLS# C7521907Listed by: CALENDA REAL ESTATE GROUP,INC. $117,500Active2 beds 1 baths987 sq. ft.
22375 Edgewater Drive #137, PUNTA GORDA, FL 33980
MLS# C7521641Listed by: RE/MAX ALLIANCE GROUP $115,000Pending1 beds 1 baths689 sq. ft.
19505 Quesada Avenue #M107, PORT CHARLOTTE, FL 33948
MLS# C7521752Listed by: COLDWELL BANKER SUNSTAR REALTY $299,500Active3 beds 3 baths1,759 sq. ft.
5127 Melbourne Street #F103, PUNTA GORDA, FL 33980
MLS# C7521853Listed by: RE/MAX PALM REALTY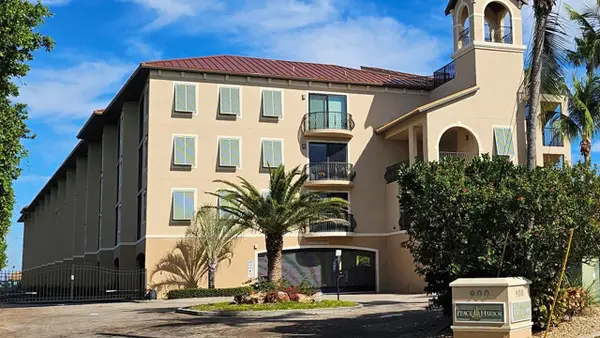 $419,000Pending3 beds 2 baths1,647 sq. ft.
900 E Marion Avenue #1201, PUNTA GORDA, FL 33950
MLS# O6382116Listed by: HOUWZER INC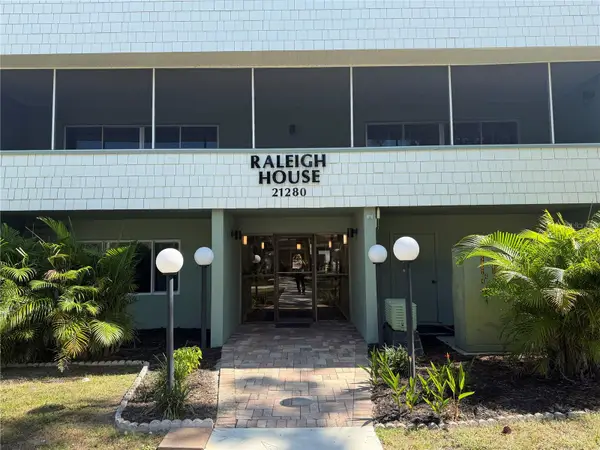 $79,000Active2 beds 2 baths919 sq. ft.
21280 Brinson Avenue #203, PORT CHARLOTTE, FL 33952
MLS# C7521232Listed by: RC PROPERTY MANAGEMENT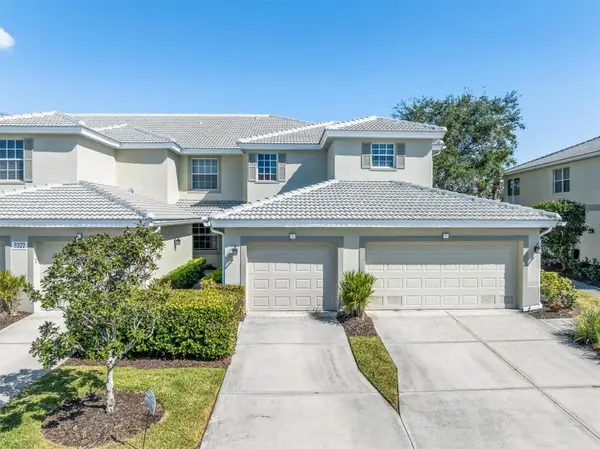 $223,000Active3 beds 2 baths1,616 sq. ft.
3322 Grand Vista Court #203, PORT CHARLOTTE, FL 33953
MLS# C7521806Listed by: KW PEACE RIVER PARTNERS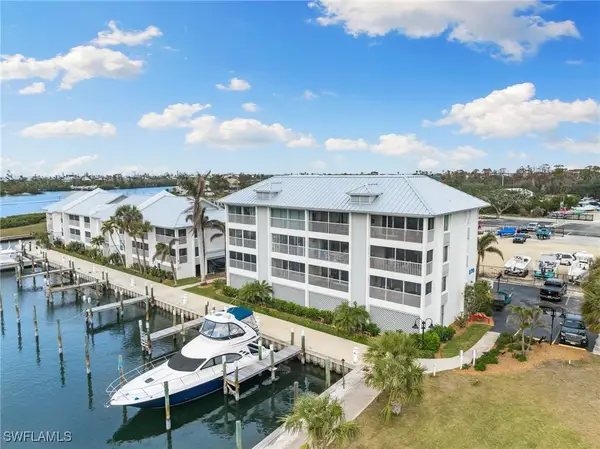 $260,000Active1 beds 1 baths697 sq. ft.
7070 Placida Road #1212, Placida, FL 33946
MLS# 226003265Listed by: ALFRED ROBBINS REALTY GROUP $180,000Active2 beds 2 baths1,077 sq. ft.
150 Harborside Avenue #129, PUNTA GORDA, FL 33950
MLS# C7521848Listed by: ALLISON JAMES ESTATES & HOMES $288,900Active2 beds 2 baths1,198 sq. ft.
14081 Heritage Landing Boulevard #236, PUNTA GORDA, FL 33955
MLS# D6146081Listed by: CENTURY 21 TROPICAL BREEZE $369,000Active2 beds 2 baths1,477 sq. ft.
3334 Purple Martin Drive #215, PUNTA GORDA, FL 33950
MLS# C7521757Listed by: RE/MAX HARBOR REALTY $429,000Pending3 beds 2 baths2,110 sq. ft.
15919 Grassland Lane #4222, Babcock Ranch, FL 33982
MLS# 226006710Listed by: DOMAINREALTY.COM LLC $725,000Active2 beds 2 baths1,755 sq. ft.
2245 N Beach Rd. #203, ENGLEWOOD, FL 34223
MLS# D6146111Listed by: WENDY REINHARDT REALTY,INC. $349,000Pending3 beds 2 baths1,999 sq. ft.
8571 Amberjack Circle #304, ENGLEWOOD, FL 34224
MLS# D6146056Listed by: PARADISE EXCLUSIVE INC $120,000Active2 beds 1 baths959 sq. ft.
22375 Edgewater Drive #205, Punta Gorda, FL 33980
MLS# 2026006929Listed by: EPIQUE REALTY, INC. $380,000Active3 beds 2 baths1,917 sq. ft.
14009 Black Beauty Drive #212, Punta Gorda, FL 33955
MLS# 226006449Listed by: SELLSTATE TITANIUM REALTY $155,000Active2 beds 2 baths964 sq. ft.
1515 Forrest Nelson Boulevard #L104, PORT CHARLOTTE, FL 33952
MLS# C7521655Listed by: COLDWELL BANKER SUNSTAR REALTY $400,000Active3 beds 3 baths2,338 sq. ft.
87 Vivante Boulevard #403, PUNTA GORDA, FL 33950
MLS# C7521663Listed by: RE/MAX PALM REALTY $535,000Active3 beds 2 baths2,225 sq. ft.
95 N Marion Court #135, PUNTA GORDA, FL 33950
MLS# C7520770Listed by: COMPASS FLORIDA LLC $275,000Active2 beds 2 baths1,232 sq. ft.
7470 Palm Island Drive #2811, PLACIDA, FL 33946
MLS# D6146063Listed by: PALM ISLAND PROPERTIES INC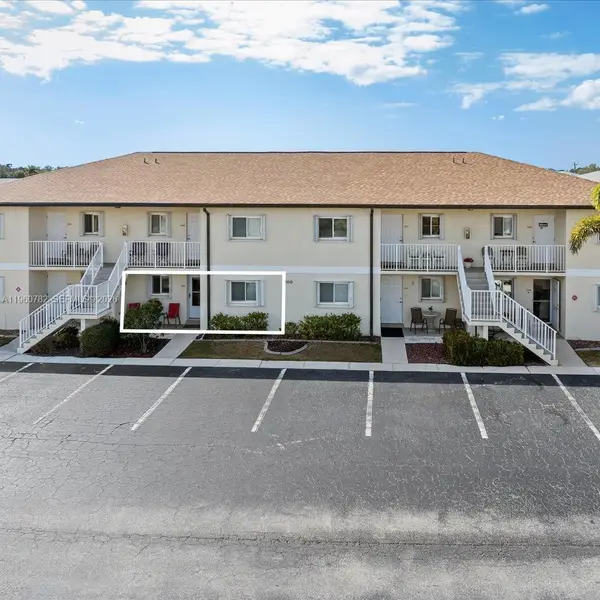 $139,900Active2 beds 2 baths886 sq. ft.
25275 Rampart Blvd #202, Punta Gorda, FL 33983
MLS# A11960782Listed by: TIME REALTY SERVICES INC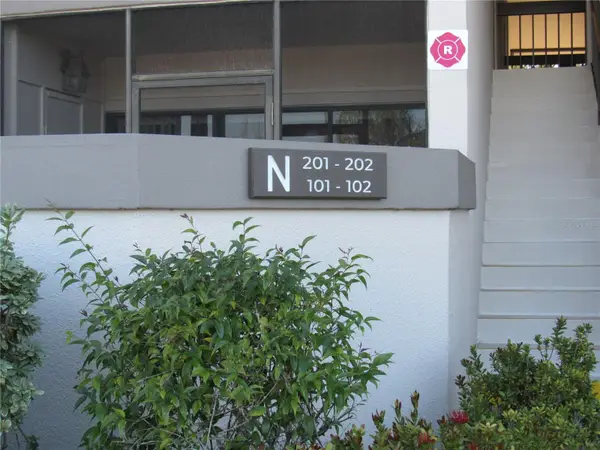 $138,500Active2 beds 2 baths899 sq. ft.
1515 Forrest Nelson Boulevard #N201, PORT CHARLOTTE, FL 33952
MLS# C7521576Listed by: COLDWELL BANKER SUNSTAR REALTY $739,000Active1 beds 1 baths784 sq. ft.
5852 Gasparilla Road #M11, BOCA GRANDE, FL 33921
MLS# D6146040Listed by: GULF TO BAY SOTHEBY'S INTERNAT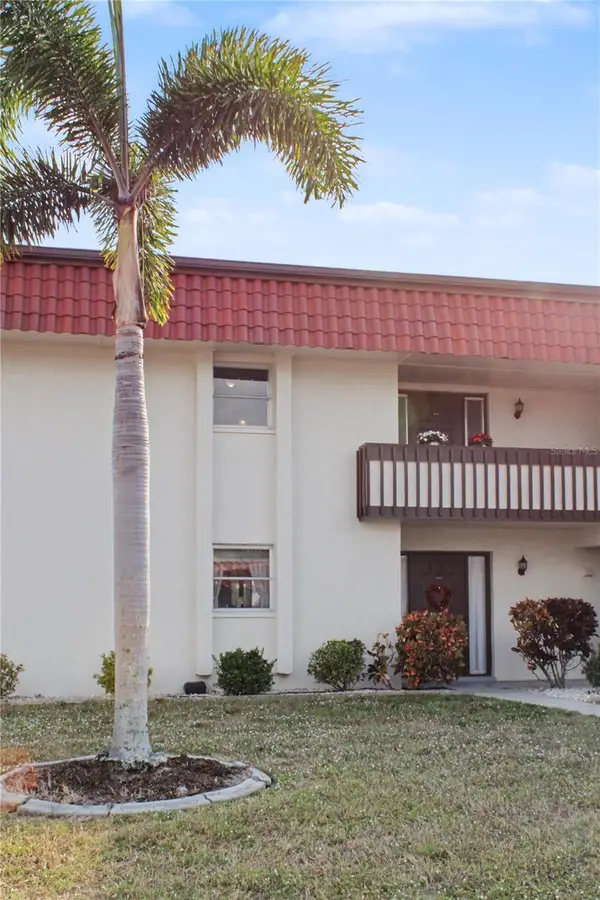 $169,000Active2 beds 2 baths1,114 sq. ft.
311 Garvin Street #409C, PUNTA GORDA, FL 33950
MLS# TB8471907Listed by: HOMECOIN.COM $259,000Active3 beds 2 baths1,301 sq. ft.
43997 Boardwalk Loop #1831, Punta Gorda, FL 33982
MLS# 2026005690Listed by: WATERSEDGE REALTY GROUP LLC $229,000Active2 beds 2 baths1,120 sq. ft.
14051 Heritage Landing Boulevard #515, PUNTA GORDA, FL 33955
MLS# C7521016Listed by: CALENDA REAL ESTATE GROUP,INC. $1,975,000Active3 beds 3 baths2,779 sq. ft.
5858 Gasparilla Road #39, BOCA GRANDE, FL 33921
MLS# D6145966Listed by: BOCA GRANDE REAL ESTATE, INC. $129,000Pending2 beds 2 baths972 sq. ft.
255 Boundary Boulevard #104, ROTONDA WEST, FL 33947
MLS# C7521585Listed by: RE/MAX ALLIANCE GROUP $1,999,999Active2 beds 2 baths1,168 sq. ft.
5000 Gasparilla Road #13A, BOCA GRANDE, FL 33921
MLS# D6145874Listed by: PARADISE EXCLUSIVE INC $109,900Active2 beds 2 baths919 sq. ft.
21300 Brinson Avenue #111, PORT CHARLOTTE, FL 33952
MLS# C7521578Listed by: COLDWELL BANKER REALTY $225,000Pending3 beds 2 baths1,497 sq. ft.
2001 Bal Harbor Boulevard #2304, PUNTA GORDA, FL 33950
MLS# C7521529Listed by: COLDWELL BANKER SUNSTAR REALTY $155,000Active2 beds 2 baths924 sq. ft.
2061 Willow Hammock Circle #205, PUNTA GORDA, FL 33983
MLS# C7521514Listed by: COLDWELL BANKER SUNSTAR REALTY $675,000Active2 beds 3 baths1,782 sq. ft.
1425 Park Beach Circle #1310, PUNTA GORDA, FL 33950
MLS# C7521396Listed by: RE/MAX HARBOR REALTY $550,000Active2 beds 3 baths1,688 sq. ft.
11200 Hacienda Del Mar Boulevard #B-204, PLACIDA, FL 33946
MLS# D6145606Listed by: PARADISE EXCLUSIVE INC $100,000Pending2 beds 2 baths960 sq. ft.
22441 Westchester Boulevard #1500G, PUNTA GORDA, FL 33980
MLS# C7521243Listed by: SELLSTATE VISION REALTY $78,900Active1 beds 1 baths841 sq. ft.
3100 Harbor Boulevard #108, PORT CHARLOTTE, FL 33952
MLS# C7521442Listed by: POOLE REALTY GROUP, LLC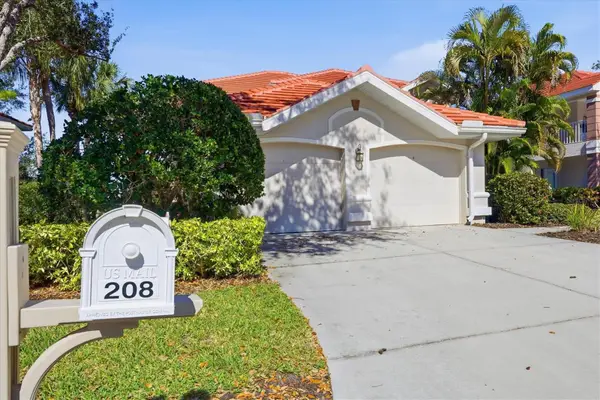 $279,000Active2 beds 2 baths1,327 sq. ft.
14000 Willow Glen Court #208, PORT CHARLOTTE, FL 33953
MLS# D6145979Listed by: RIVERWOOD REALTY $249,000Active2 beds 2 baths1,077 sq. ft.
150 Harborside Avenue #209, PUNTA GORDA, FL 33950
MLS# C7521465Listed by: SELLSTATE VISION REALTY $129,500Active2 beds 2 baths871 sq. ft.
9000 Griggs Road #G, ENGLEWOOD, FL 34224
MLS# N6142781Listed by: KW COASTAL LIVING $135,000Active2 beds 2 baths1,240 sq. ft.
23465 Harborview Road #108, PUNTA GORDA, FL 33980
MLS# C7521489Listed by: SUNBELT MANAGEMENT SERVICES $299,900Active2 beds 2 baths1,120 sq. ft.
4410 Warren Avenue #108, PORT CHARLOTTE, FL 33953
MLS# D6145928Listed by: COCONUT BAY REALTY, LLC $289,900Active3 beds 3 baths1,831 sq. ft.
5117 Melbourne Street #B304, PUNTA GORDA, FL 33980
MLS# C7520021Listed by: CALENDA REAL ESTATE GROUP,INC. $189,900Pending3 beds 3 baths1,759 sq. ft.
5115 Melbourne Street #A303, PUNTA GORDA, FL 33980
MLS# C7520938Listed by: COMPASS FLORIDA $150,000Active2 beds 2 baths860 sq. ft.
25050 Sandhill Boulevard #BLG 3 A4, Punta Gorda, FL 33983
MLS# 2025011492Listed by: REALTY ONE GROUP MVP $359,000Active2 beds 2 baths1,655 sq. ft.
16000 Grassland Lane #3128, Punta Gorda, FL 33982
MLS# 2025020765Listed by: NICKLAUS VANCE $569,999Active4 beds 3 baths1,867 sq. ft.
1623 Sea Haven Drive #304, Punta Gorda, FL 33950
MLS# 226005538Listed by: TAYLOR MORRISON REALTY OF FL $149,900Pending2 beds 2 baths1,044 sq. ft.
3310 Loveland Boulevard #2304, PUNTA GORDA, FL 33980
MLS# C7521406Listed by: COLDWELL BANKER SUNSTAR REALTY $128,800Pending2 beds 2 baths937 sq. ft.
24540 Harborview Road #A2, PUNTA GORDA, FL 33980
MLS# D6145856Listed by: CENTURY 21 TROPICAL BREEZE $136,500Pending2 beds 2 baths860 sq. ft.
25100 Sandhill Boulevard #202, PUNTA GORDA, FL 33983
MLS# C7521331Listed by: RE/MAX HARBOR REALTY $498,900Active2 beds 2 baths1,237 sq. ft.
2950 N Beach Road #A315, ENGLEWOOD, FL 34223
MLS# D6145381Listed by: GULF REALTY & ASSOCIATES LLC $259,900Active3 beds 2 baths1,729 sq. ft.
8571 Amberjack Circle #103, ENGLEWOOD, FL 34224
MLS# D6145936Listed by: RE/MAX ALLIANCE GROUP $129,900Active2 beds 2 baths838 sq. ft.
19505 Quesada Avenue #EE202, PORT CHARLOTTE, FL 33948
MLS# C7521329Listed by: ERA ADVANTAGE REALTY, INC. $115,000Active2 beds 2 baths1,153 sq. ft.
175 Kings Highway #225 (B5), PUNTA GORDA, FL 33983
MLS# C7516210Listed by: KELLER WILLIAMS ISLAND LIFE REAL ESTATE $125,000Active2 beds 2 baths1,046 sq. ft.
22481 Westchester Boulevard #A22, PUNTA GORDA, FL 33980
MLS# C7521321Listed by: OCEAN PARTNERS REAL ESTATE $129,999Active2 beds 2 baths899 sq. ft.
1515 Forrest Nelson Boulevard #O104, PORT CHARLOTTE, FL 33952
MLS# C7521082Listed by: COLDWELL BANKER SUNSTAR REALTY $649,000Active3 beds 3 baths2,172 sq. ft.
200 Harbor Walk Drive #155, PUNTA GORDA, FL 33950
MLS# N6142682Listed by: PREMIER SOTHEBYS INTL REALTY $269,900Active2 beds 2 baths1,198 sq. ft.
14081 Heritage Landing Boulevard #227, PUNTA GORDA, FL 33955
MLS# C7521235Listed by: CRIMALDI & ASSOCIATES, LLC $310,000Active2 beds 2 baths1,380 sq. ft.
14267 Heritage Landing Boulevard #1212, PUNTA GORDA, FL 33955
MLS# C7520545Listed by: CALENDA REAL ESTATE GROUP,INC. $439,900Active3 beds 2 baths1,917 sq. ft.
14073 Black Beauty Drive #1012, PUNTA GORDA, FL 33955
MLS# C7521228Listed by: CRIMALDI & ASSOCIATES, LLC $639,000Active2 beds 3 baths1,688 sq. ft.
11120 Hacienda Del Mar Boulevard #F-205, PLACIDA, FL 33946
MLS# D6145878Listed by: MICHAEL SAUNDERS & CO. - BOCA $529,900Active2 beds 2 baths1,237 sq. ft.
2955 N Beach Road #A425, ENGLEWOOD, FL 34223
MLS# D6145861Listed by: RE/MAX ALLIANCE GROUP $224,900Pending3 beds 2 baths1,407 sq. ft.
14201 Heritage Landing Boulevard #1328, Punta Gorda, FL 33955
MLS# 2026005273Listed by: LUXURY REAL ESTATE GROUP LLC $200,000Active2 beds 2 baths1,405 sq. ft.
23465 Harborview Road #624, PORT CHARLOTTE, FL 33980
MLS# C7521177Listed by: MARINA PARK REALTY LLC $325,000Active3 beds 2 baths1,867 sq. ft.
3640 Bal Harbor Boulevard #131, PUNTA GORDA, FL 33950
MLS# A4680580Listed by: REAL BROKER, LLC $119,900Active2 beds 2 baths1,092 sq. ft.
6800 Placida Road #169, ENGLEWOOD, FL 34224
MLS# D6145918Listed by: TALL PINES REALTY $94,500Active2 beds 2 baths919 sq. ft.
21260 Brinson Avenue #303, Port Charlotte, FL 33952
MLS# 226004549Listed by: BEYCOME OF FLORIDA LLC $249,900Pending3 beds 2 baths1,616 sq. ft.
3353 Grand Vista Court #203, PORT CHARLOTTE, FL 33953
MLS# C7520859Listed by: PEACE HARBOR REAL ESTATE INC. $599,000Active3 beds 2 baths2,018 sq. ft.
200 Harbor Walk Drive #233, PUNTA GORDA, FL 33950
MLS# C7520619Listed by: RE/MAX HARBOR REALTY $134,900Active2 beds 2 baths886 sq. ft.
25275 Rampart Boulevard #1607, PUNTA GORDA, FL 33983
MLS# C7521104Listed by: FIVE STAR REALTY OF CHARLOTTE $345,000Active2 beds 1 baths912 sq. ft.
5055 N Beach Road #101, ENGLEWOOD, FL 34223
MLS# N6142641Listed by: RE/MAX PALM $925,000Active3 beds 2 baths1,414 sq. ft.
5030 N Beach Road #3, ENGLEWOOD, FL 34223
MLS# D6145843Listed by: GULF REALTY & ASSOCIATES LLC $189,900Active2 beds 2 baths1,279 sq. ft.
1408 San Cristobal Avenue #6, PUNTA GORDA, FL 33983
MLS# C7521142Listed by: BARNES & PHILLIPS REAL ESTATE $100,000Active2 beds 1 baths987 sq. ft.
22375 Edgewater Drive #238, PUNTA GORDA, FL 33980
MLS# C7520773Listed by: RE/MAX PALM REALTY $375,000Pending2 beds 2 baths1,751 sq. ft.
1 Colony Point Drive #16C, PUNTA GORDA, FL 33950
MLS# C7520503Listed by: KW PEACE RIVER PARTNERS $101,999Active2 beds 2 baths919 sq. ft.
2437 Harbor Boulevard #108, PORT CHARLOTTE, FL 33952
MLS# C7520929Listed by: COLDWELL BANKER REALTY $300,000Pending3 beds 2 baths1,293 sq. ft.
8405 Placida Road #201, PLACIDA, FL 33946
MLS# D6145832Listed by: KW COASTAL LIVING $139,500Pending2 beds 2 baths886 sq. ft.
25225 Rampart Boulevard #501, PUNTA GORDA, FL 33983
MLS# D6145845Listed by: PROGRAM REALTY, LLC $350,000Active2 beds 2 baths1,484 sq. ft.
1323 Mediterranean Drive #222, PUNTA GORDA, FL 33950
MLS# C7520664Listed by: MARINA PARK REALTY LLC $275,000Pending2 beds 2 baths1,422 sq. ft.
44000 Boardwalk Loop #1312, Punta Gorda, FL 33982
MLS# 2026002808Listed by: JOHN R. WOOD PROPERTIES $412,000Pending3 beds 2 baths1,741 sq. ft.
43314 Water Bird Way #6711, Punta Gorda, FL 33982
MLS# 2026004696Listed by: PINNACLE PROPERTY GROUP $325,000Active2 beds 2 baths1,147 sq. ft.
25188 Marion Avenue #B309, PUNTA GORDA, FL 33950
MLS# C7520867Listed by: SUNCOASTEAM REALTY LLC $79,900Active2 beds 2 baths1,039 sq. ft.
4158 Tamiami Trail #Q2, PORT CHARLOTTE, FL 33952
MLS# A4680016Listed by: WEST ISLANDS REALTY INC $123,000Active1 beds 1 baths689 sq. ft.
19505 Quesada Avenue #S208, PORT CHARLOTTE, FL 33948
MLS# C7520563Listed by: RE/MAX PALM REALTY- Open Fri, 11am to 2pm
 $211,000Active2 beds 2 baths1,230 sq. ft.
9850 Fiddlers Green Circle #228, ROTONDA WEST, FL 33947
MLS# D6145803Listed by: TALL PINES REALTY  $349,000Active2 beds 2 baths1,626 sq. ft.
4728 Club Drive #101, PORT CHARLOTTE, FL 33953
MLS# D6145431Listed by: RIVERWOOD REALTY $249,000Active2 beds 2 baths1,120 sq. ft.
14091 Heritage Landing Boulevard #115, PUNTA GORDA, FL 33955
MLS# C7520256Listed by: CALENDA REAL ESTATE GROUP,INC.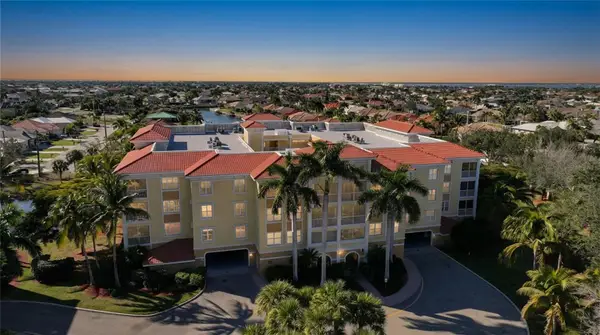 $310,000Pending3 beds 2 baths1,768 sq. ft.
255 W End Drive #4203, PUNTA GORDA, FL 33950
MLS# C7520697Listed by: COLDWELL BANKER SUNSTAR REALTY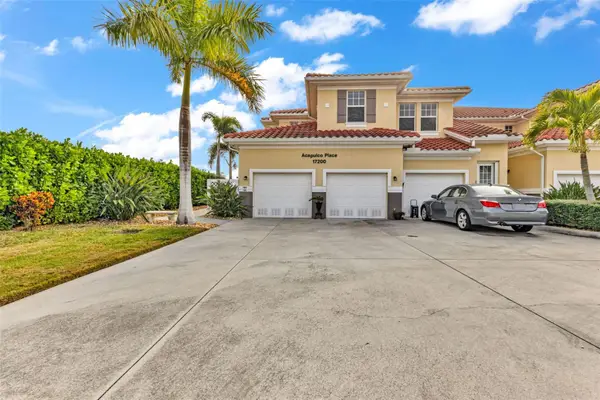 $229,000Active3 beds 2 baths1,644 sq. ft.
17200 Acapulco Road #121, PUNTA GORDA, FL 33955
MLS# C7520569Listed by: KW PEACE RIVER PARTNERS
Local realty services provided by:CENTURY 21 SUNBELT REALTY, CENTURY 21 Beggins Enterprises, CENTURY 21 Carioti
The information being provided by Stellar Mls is for the consumer's personal, non-commercial use and may not be used for any purpose other than to identify prospective properties consumer may be interested in purchasing. Any information relating to real estate for sale referenced on this web site comes from the Internet Data Exchange (IDX) program of the Stellar Mls. CENTURY 21 SUNBELT REALTY is not a Multiple Listing Service (MLS), nor does it offer MLS access. This website is a service of CENTURY 21 SUNBELT REALTY, a broker participant of Stellar Mls. This web site may reference real estate listing(s) held by a brokerage firm other than the broker and/or agent who owns this web site.
The accuracy of all information, regardless of source, including but not limited to open house information, square footages and lot sizes, is deemed reliable but not guaranteed and should be personally verified through personal inspection by and/or with the appropriate professionals. The data contained herein is copyrighted by Stellar Mls and is protected by all applicable copyright laws. Any unauthorized dissemination of this information is in violation of copyright laws and is strictly prohibited.
Properties in listings may have been sold or may no longer be available.
Copyright 2026 Stellar Mls. All rights reserved.
Information deemed reliable but not guaranteed. Information is provided, in part, by Greater Miami MLS. This information being provided is for consumer's personal, non-commercial use and may not be used for any other purpose other than to identify prospective properties consumers may be interested in purchasing.
Popular searches near Charlotte County, FL
Popular neighborhoods near Charlotte County, FL
- Amnesty, North Port homes for sale
- Atwater, North Port homes for sale
- Bannock, North Port homes for sale
- Beechwood, North Port homes for sale
- Blueleaf, North Port homes for sale
- Bobcat Trail, North Port homes for sale
- Burnt Shore Marina, Burnt Store Marina homes for sale
- Burnt Store Isles, Punta Gorda homes for sale
- Fairview, North Port homes for sale
- Gardenside, North Port homes for sale
- Haberland, North Port homes for sale
- Kenvil, North Port homes for sale
- Langlais, North Port homes for sale
- Newman, North Port homes for sale
- Price End, North Port homes for sale
- Punta Gorda Isles, Punta Gorda homes for sale
- San Mateo, North Port homes for sale
- Toledo Blade, North Port homes for sale
- Woodhaven, North Port homes for sale
- Yorkshire, North Port homes for sale
Zip codes near Charlotte County, FL
- 33909 homes for sale
- 33921 homes for sale
- 33946 homes for sale
- 33947 homes for sale
- 33948 homes for sale
- 33950 homes for sale
- 33952 homes for sale
- 33953 homes for sale
- 33954 homes for sale
- 33955 homes for sale
- 33980 homes for sale
- 33981 homes for sale
- 33982 homes for sale
- 33983 homes for sale
- 33993 homes for sale
- 34269 homes for sale
- 34286 homes for sale
- 34287 homes for sale
- 34288 homes for sale
- 34289 homes for sale
Protect your home and budget from life's surprises with an Assurant Home Warranty, backed by a partner that supports you through every step of homeownership. Explore Plans.
©2026 Century 21 Real Estate LLC. All rights reserved. CENTURY 21®, the CENTURY 21 Logo and C21® are service marks owned by Century 21 Real Estate LLC. Century 21 Real Estate LLC fully supports the principles of the Fair Housing Act and the Equal Opportunity Act. Each office is independently owned and operated. Listing information is deemed reliable but not guaranteed accurate.