- Alexandria properties for sale
- Ball properties for sale
- Bordelonville properties for sale
- Bunkie properties for sale
- Center Point properties for sale
- Cottonport properties for sale
- Deville properties for sale
- Fifth Ward properties for sale
- Forest Hill properties for sale
- Glenmora properties for sale
- Hessmer properties for sale
- Lecompte properties for sale
- Mansura properties for sale
- Marksville properties for sale
- Moreauville properties for sale
- Oakdale properties for sale
- Pineville properties for sale
- Plaucheville properties for sale
- Ville Platte properties for sale
- Woodworth properties for sale
Cheneyville, LA - homes for sale
2 of 2 results displayed
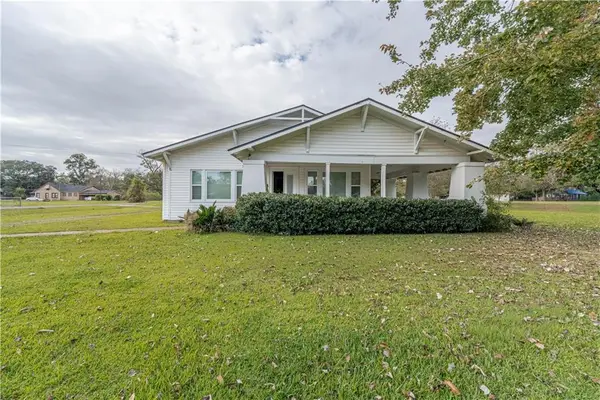 $160,000Active3 beds 2 baths1,883 sq. ft.
501 Wadsworth Avenue, Cheneyville, LA 71325
MLS# 2533472Listed by: LATTER AND BLUM CENTRAL REALTY LLC $154,000Active3 beds 2 baths2,481 sq. ft.
502 Wadsworth Avenue, Cheneyville, LA 71325
MLS# 2511026Listed by: COURVILLE REALTY
Local realty services provided by:CENTURY 21 Buelow-Miller Realty
Popular searches near Cheneyville, LA
©2025 Century 21 Real Estate LLC. All rights reserved. CENTURY 21®, the CENTURY 21 Logo and C21® are service marks owned by Century 21 Real Estate LLC. Century 21 Real Estate LLC fully supports the principles of the Fair Housing Act and the Equal Opportunity Act. Each office is independently owned and operated. Listing information is deemed reliable but not guaranteed accurate.
©2025 Century 21 Real Estate LLC. All rights reserved. CENTURY 21®, the CENTURY 21 Logo and C21® are service marks owned by Century 21 Real Estate LLC. Century 21 Real Estate LLC fully supports the principles of the Fair Housing Act and the Equal Opportunity Act. Each office is independently owned and operated. Listing information is deemed reliable but not guaranteed accurate.