- Benns Church homes for sale
- Carrollton homes for sale
- Chesapeake homes for sale
- Corapeake homes for sale
- Courthouse homes for sale
- Haslett homes for sale
- Hunters Mill homes for sale
- Moyock homes for sale
- Moyock township homes for sale
- Newland homes for sale
- Newport homes for sale
- Norfolk homes for sale
- Portsmouth homes for sale
- Providence homes for sale
- South Mills homes for sale
- South Mills Township homes for sale
- Suffolk homes for sale
- Sunbury homes for sale
- Virginia Beach homes for sale
- Windsor homes for sale
23323, VA - homes for sale
161 of 161 results displayed
- New
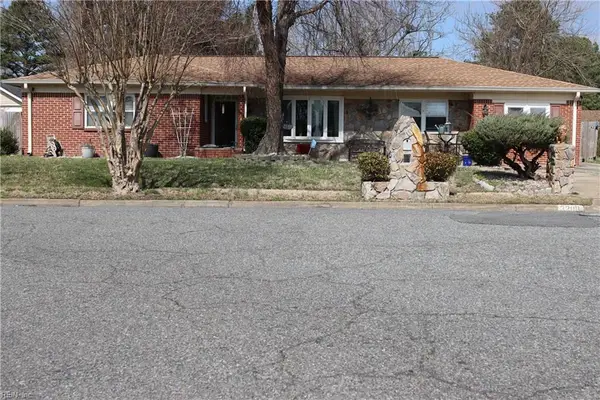
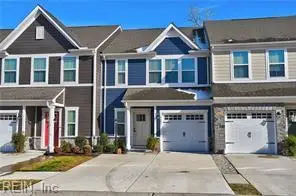 $414,900Active3 beds 3 baths1,744 sq. ft.
1605 Redwing Arc, Chesapeake, VA 23322
MLS# 10627517Listed by: A Better Way Realty Inc. - New
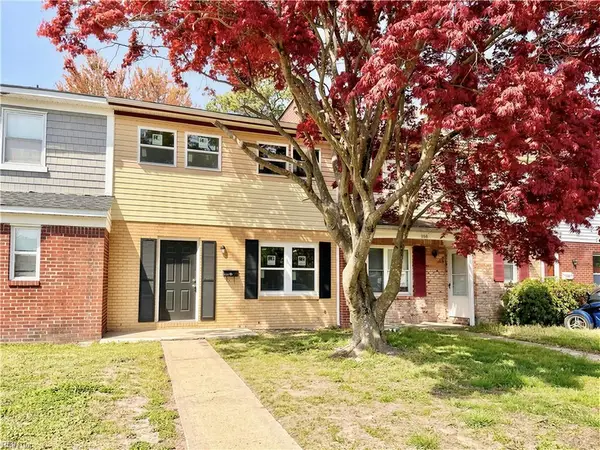
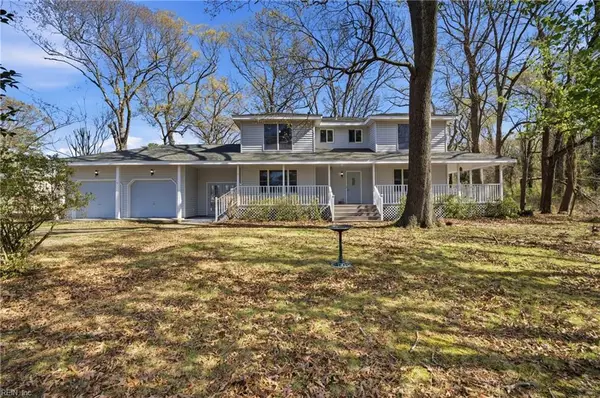
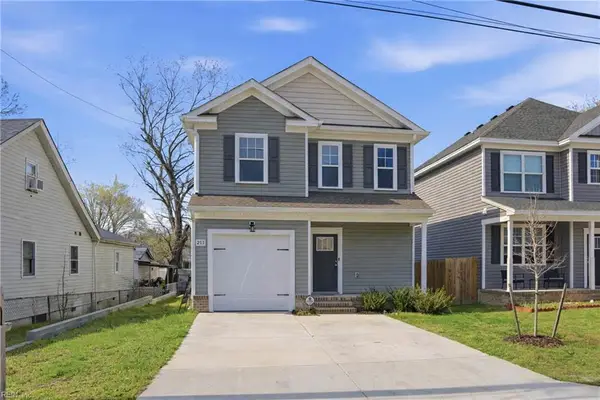
 $450,000Active3 beds 3 baths2,404 sq. ft.
907 Adventure Way, Chesapeake, VA 23323
MLS# 10627069Listed by: EXIT Realty Central - New
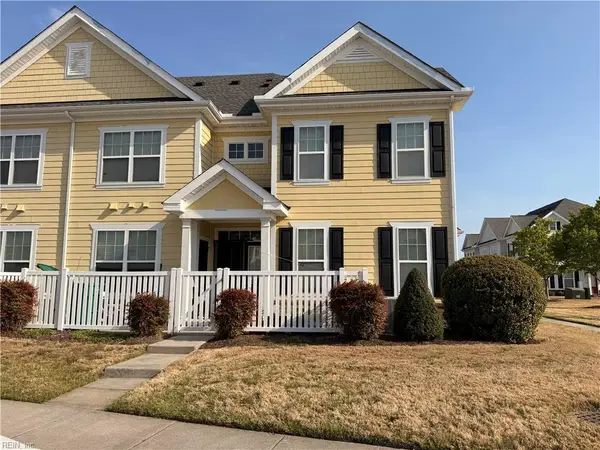
 $249,000Active3 beds 2 baths1,470 sq. ft.
1016 Castle Court, Chesapeake, VA 23323
MLS# 10627280Listed by: Swell Real Estate Co - New
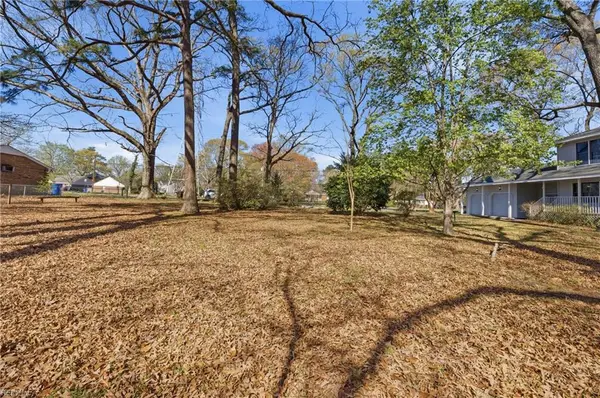 $150,000Active0.4 Acres
921 Michael Drive, Chesapeake, VA 23323
MLS# 10627263Listed by: Signature Homes - New
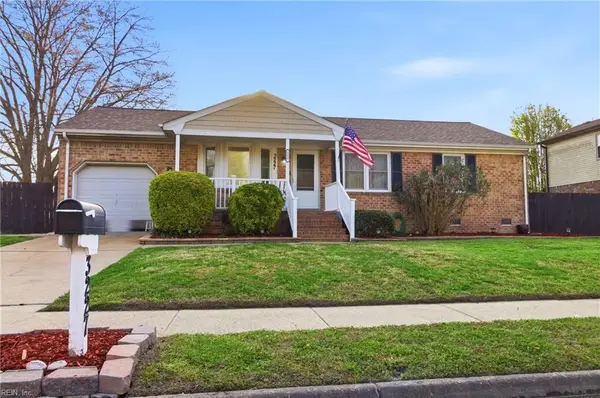
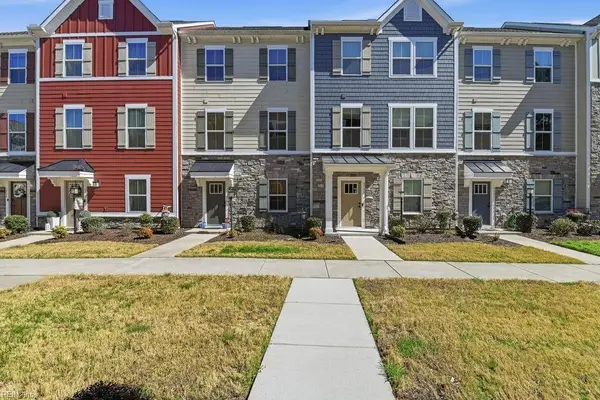
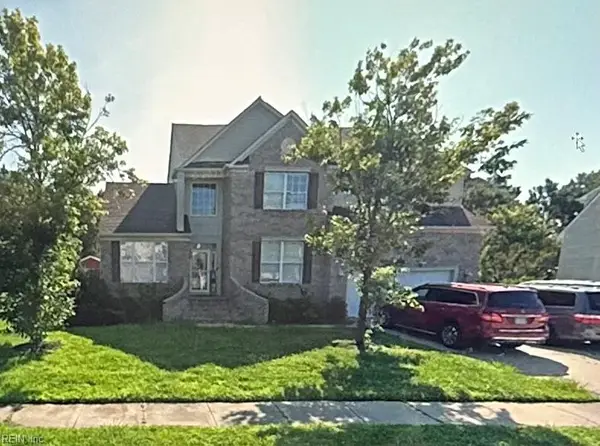
 $389,000Active4 beds 2 baths1,685 sq. ft.
428 Rock Drive, Chesapeake, VA 23323
MLS# 10627238Listed by: BHHS RW Towne Realty - New
 $399,999Active3 beds 3 baths2,452 sq. ft.
514 Miami Drive, Chesapeake, VA 23323
MLS# 10627226Listed by: Providence Realty Inc. - New
 $355,000Active3 beds 2 baths1,120 sq. ft.
3227 Troy Lane, Chesapeake, VA 23323
MLS# 10626586Listed by: Own Real Estate LLC - New
 $385,000Active4 beds 2 baths1,984 sq. ft.
3200 Bruno Drive, Chesapeake, VA 23323
MLS# 10626582Listed by: Fathom Realty - New
 $695,900Active4 beds 4 baths2,500 sq. ft.
1906 Mccoy Rd, Chesapeake, VA 23323
MLS# 10627188Listed by: BHHS RW Towne Realty - New
 $695,900Active4 beds 4 baths2,500 sq. ft.
1904 Mccoy Rd, Chesapeake, VA 23323
MLS# 10627193Listed by: BHHS RW Towne Realty - New
 $425,000Active5 beds 3 baths2,224 sq. ft.
925 Michael Drive, Chesapeake, VA 23323
MLS# 10627186Listed by: Signature Homes - New
 $640,000Active5 beds 3 baths2,802 sq. ft.
2138 Tall Pine Drive, Chesapeake, VA 23323
MLS# 10626983Listed by: Coastal Group Inc. - New
 $309,000Active2 beds 3 baths1,471 sq. ft.
521 Nesbit Drive #103, Chesapeake, VA 23323
MLS# 10626925Listed by: LPT Realty LLC - New
 $385,000Active3 beds 3 baths1,720 sq. ft.
1705 Foremast Loop, Chesapeake, VA 23323
MLS# 10626315Listed by: CENTURY 21 Nachman Realty - New
 $415,000Active3 beds 3 baths1,850 sq. ft.
211 Diamond Avenue, Chesapeake, VA 23323
MLS# 10626254Listed by: Iron Valley Real Est. Prestige - New
 $580,000Active5 beds 3 baths3,319 sq. ft.
3505 Ethel James Drive, Chesapeake, VA 23323
MLS# 10626221Listed by: Swell Realty Co - New
 $379,900Active3 beds 2 baths1,636 sq. ft.
912 Oklahoma Drive, Chesapeake, VA 23323
MLS# 10626158Listed by: Howard Hanna Real Estate Svcs. 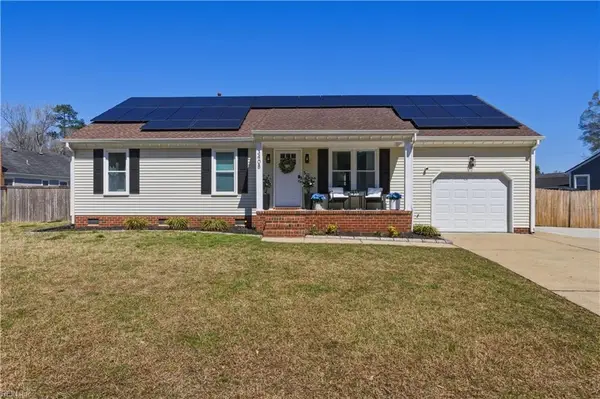 $424,900Pending4 beds 2 baths1,476 sq. ft.
3408 Blackhawk Court, Chesapeake, VA 23323
MLS# 10625976Listed by: Iron Valley Real Estate HR $225,000Active3 beds 2 baths900 sq. ft.
2717 Thomas Street, Chesapeake, VA 23323
MLS# 10626049Listed by: BHHS RW Towne Realty $160,000Active2 beds 1 baths961 sq. ft.
303 Diamond Avenue, Chesapeake, VA 23323
MLS# 10626102Listed by: ONYX Realty Professionals LLC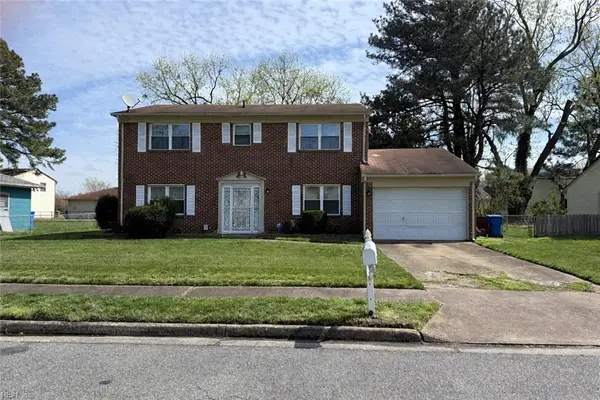 $200,000Active4 beds 3 baths1,932 sq. ft.
809 Parapet Road, Chesapeake, VA 23323
MLS# 10625660Listed by: EXIT Realty Central $380,000Active3 beds 2 baths1,516 sq. ft.
2645 Roundtree Circle, Chesapeake, VA 23323
MLS# 10625839Listed by: BHHS RW Towne Realty $625,000Active4 beds 3 baths3,050 sq. ft.
1853 Rockwood Drive, Chesapeake, VA 23323
MLS# 10625928Listed by: Iron Valley Real Estate HR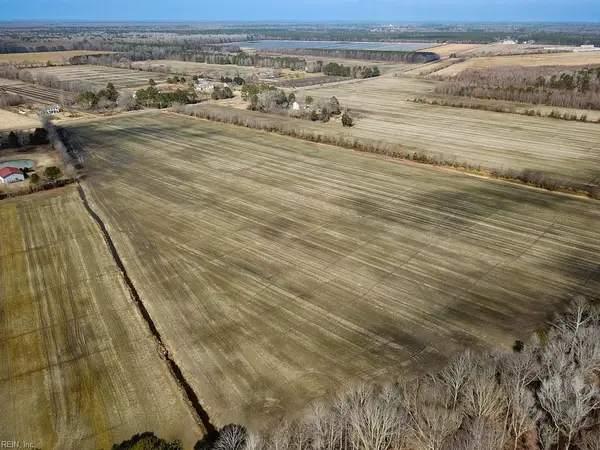 $2,200,000Active118 Acres
118Ac West Road, Chesapeake, VA 23323
MLS# 10625643Listed by: MOP Land and Farms Realty $310,000Active3 beds 2 baths1,430 sq. ft.
304 Quail Meadow Drive, Chesapeake, VA 23323
MLS# 10625715Listed by: Benham Real Estate LLC $325,000Active3 beds 2 baths1,176 sq. ft.
820 Henry Avenue, Chesapeake, VA 23323
MLS# 10625802Listed by: Howard Hanna Real Estate Svcs. $425,000Active3 beds 2 baths2,055 sq. ft.
2309 Battery Park Road, Chesapeake, VA 23323
MLS# 10625829Listed by: Keller Williams Realty Twn Ctr $565,000Active5 beds 3 baths2,500 sq. ft.
2825 Ridgeboard Place, Chesapeake, VA 23323
MLS# 10625792Listed by: Iron Valley Real Est. Prestige $450,000Pending3 beds 3 baths1,558 sq. ft.
2313 Shorebird Court, Chesapeake, VA 23323
MLS# 10625212Listed by: LPT Realty LLC $250,000Active2 beds 1 baths988 sq. ft.
102 Diamond Avenue #D, Chesapeake, VA 23323
MLS# 10625421Listed by: Iron Valley Real Est Norfolk $330,000Active3 beds 1 baths1,400 sq. ft.
3132 Kenelm Drive, Chesapeake, VA 23323
MLS# 10625307Listed by: 1st Class RealEstate Integrity $694,990Active4 beds 3 baths2,748 sq. ft.
MM Intracoastal(the Hadley ) Way, Chesapeake, VA 23322
MLS# 10624963Listed by: D R Horton Realty of Virginia $419,000Active3 beds 3 baths1,679 sq. ft.
902 Centurion Cir, CHESAPEAKE, VA 23323
MLS# VACK2000142Listed by: KW METRO CENTER $519,900Active4 beds 3 baths2,112 sq. ft.
709 Big Bear Lane, Chesapeake, VA 23323
MLS# 10621118Listed by: Earl Sanders Realty Inc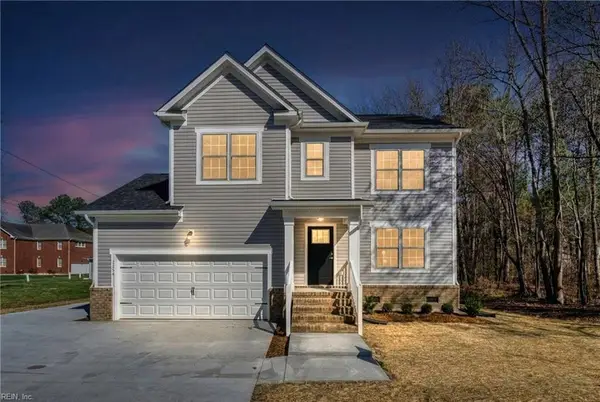 $575,000Active5 beds 3 baths2,073 sq. ft.
2256 Shipyard Road, Chesapeake, VA 23323
MLS# 10625117Listed by: BHHS RW Towne Realty $425,000Pending4 beds 2 baths1,778 sq. ft.
502 Willow Bend Drive, Chesapeake, VA 23323
MLS# 10624476Listed by: The Real Estate Group $550,000Active4 beds 3 baths2,632 sq. ft.
3216 Farange Drive, Chesapeake, VA 23323
MLS# 10624338Listed by: BHHS RW Towne Realty $375,000Pending4 beds 2 baths1,600 sq. ft.
3144 Gaston Drive, Chesapeake, VA 23323
MLS# 10624525Listed by: A Better Way Realty Inc. $475,000Active4 beds 4 baths2,177 sq. ft.
1803 Honey Milk Road, Chesapeake, VA 23323
MLS# 10624679Listed by: The Real Estate Group $399,900Pending4 beds 3 baths2,000 sq. ft.
23 Diamond Avenue, Chesapeake, VA 23323
MLS# 10624743Listed by: Iron Valley Real Estate HR $435,000Pending4 beds 3 baths1,916 sq. ft.
917 Ferryman Quay, Chesapeake, VA 23323
MLS# 10624786Listed by: BHHS RW Towne Realty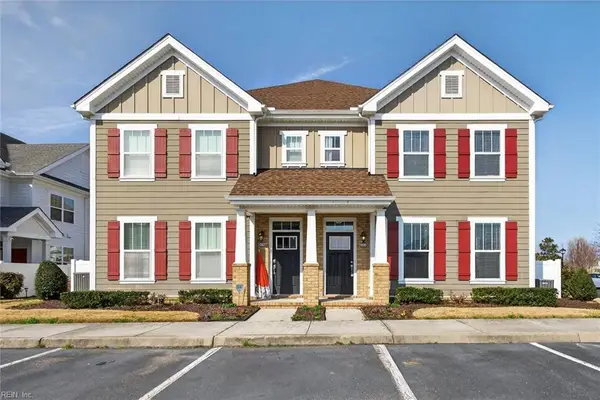 $295,000Pending2 beds 3 baths1,471 sq. ft.
500 Hermit Thrush Way, Chesapeake, VA 23323
MLS# 10624850Listed by: BHHS RW Towne Realty $520,000Pending4 beds 3 baths2,530 sq. ft.
503 Miami Dr, Chesapeake, VA 23323
MLS# 10624687Listed by: KW Coastal Virginia Chesapeake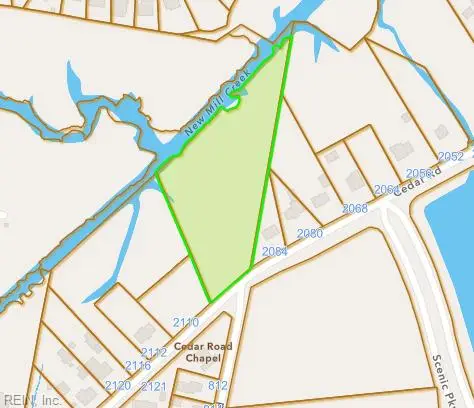 $250,000Active3.7 Acres
3.7AC Cedar Road, Chesapeake, VA 23323
MLS# 10624382Listed by: Creed Realty $645,000Active4 beds 3 baths2,674 sq. ft.
341 George Washington Highway S, Chesapeake, VA 23323
MLS# 10624216Listed by: Iron Valley Real Est Norfolk $229,900Pending3 beds 2 baths1,058 sq. ft.
2722 Janice Lynn Ct, Chesapeake, VA 23323
MLS# 10624517Listed by: KW Coastal Virginia Chesapeake $530,000Pending4 beds 3 baths2,100 sq. ft.
2013 Burson Drive, Chesapeake, VA 23323
MLS# 10624651Listed by: The Real Estate Group $439,900Active3 beds 3 baths2,446 sq. ft.
943 Gabion Way, Chesapeake, VA 23323
MLS# 10624383Listed by: RE/MAX Prime $829,900Active5 beds 4 baths3,600 sq. ft.
1653 Shipyard Road, Chesapeake, VA 23323
MLS# 10624563Listed by: AtCoastal Realty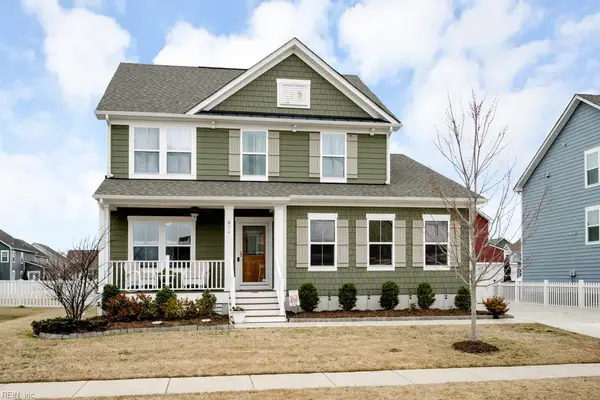 $539,900Active4 beds 3 baths2,116 sq. ft.
824 Canoe Street, Chesapeake, VA 23323
MLS# 10624193Listed by: CRG Coastal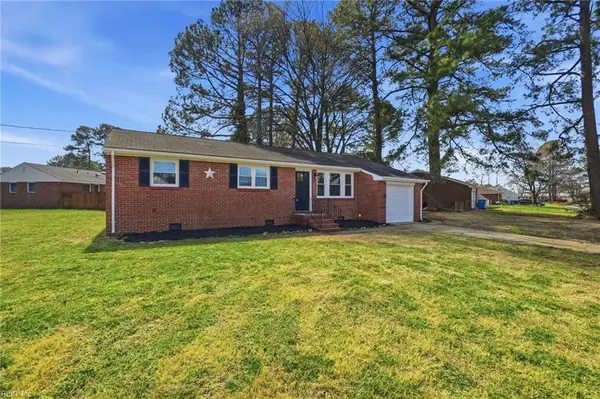 $365,000Active3 beds 2 baths1,208 sq. ft.
1512 Boxwood Drive, Chesapeake, VA 23323
MLS# 10624049Listed by: Long & Foster Real Estate Inc. $225,000Pending3 beds 2 baths1,722 sq. ft.
404 George Washington Highway N, Chesapeake, VA 23323
MLS# 10624064Listed by: KW Coastal Virginia Chesapeake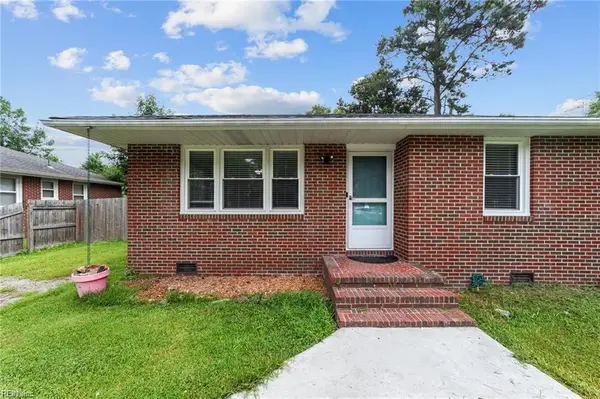 $325,000Active3 beds 1 baths1,319 sq. ft.
2856 Flag Road, Chesapeake, VA 23323
MLS# 10623684Listed by: Redfin Corporation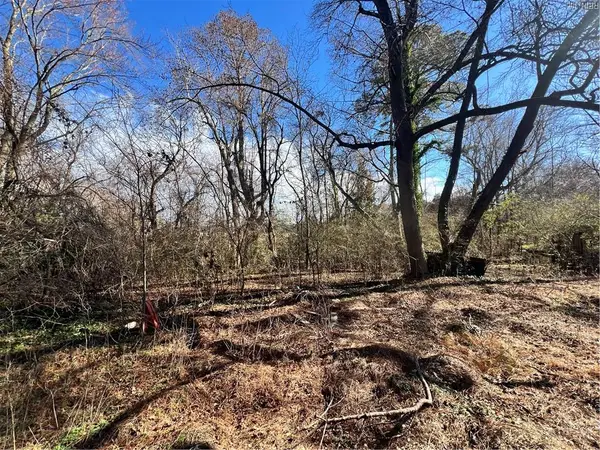 $3,000Pending0.07 Acres
Lot 18 Douglas Avenue, Chesapeake, VA 23323
MLS# 10623915Listed by: EXP Realty LLC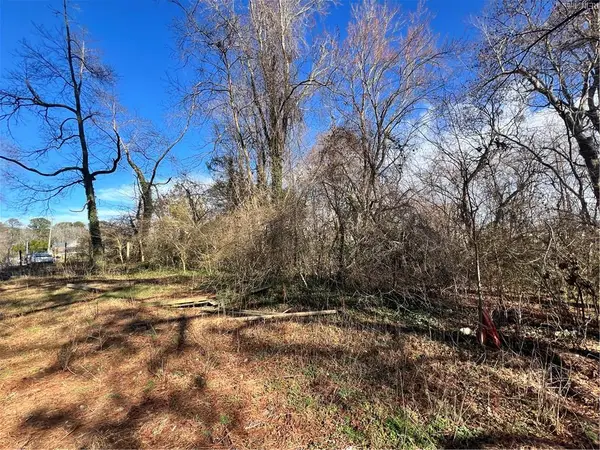 $3,000Pending0.06 Acres
Lot 19 Douglas Avenue, Chesapeake, VA 23323
MLS# 10623920Listed by: EXP Realty LLC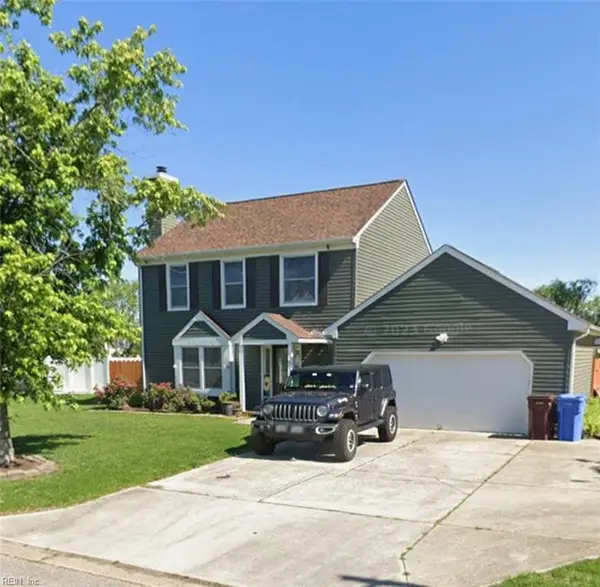 $535,000Pending3 beds 3 baths2,034 sq. ft.
633 Creekwood Drive, Chesapeake, VA 23323
MLS# 10623973Listed by: Wainwright Real Estate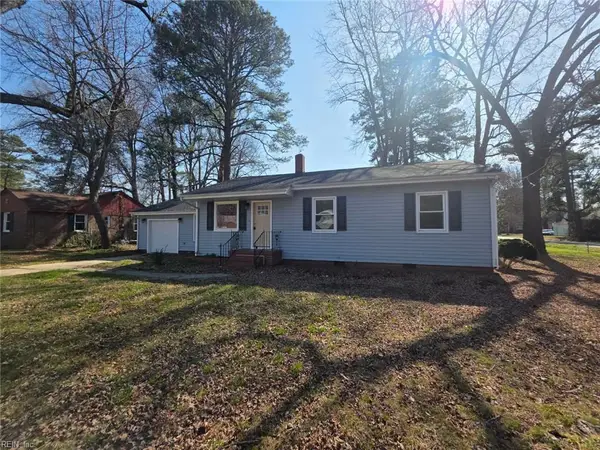 $359,900Active3 beds 1 baths1,400 sq. ft.
2213 Springdale Road, Chesapeake, VA 23323
MLS# 10623989Listed by: World Class Realty $159,900Pending3 beds 1 baths1,409 sq. ft.
901 King Arthur Drive, Chesapeake, VA 23323
MLS# 10623678Listed by: Benham Real Estate LLC $685,000Active4 beds 3 baths3,000 sq. ft.
3307 Dodd Drive, Chesapeake, VA 23323
MLS# 10623886Listed by: Triumph Realty Group LLC $465,000Pending3 beds 2 baths1,567 sq. ft.
2333 Number Ten Lane, Chesapeake, VA 23323
MLS# 10623894Listed by: The Real Estate Group $392,500Active4 beds 2 baths1,700 sq. ft.
2315 Cross Street, Chesapeake, VA 23323
MLS# 10623791Listed by: KFinCo Realty $375,000Active4 beds 2 baths1,800 sq. ft.
3204 Bruno Drive, Chesapeake, VA 23323
MLS# 10623637Listed by: Iron Valley Real Estate HR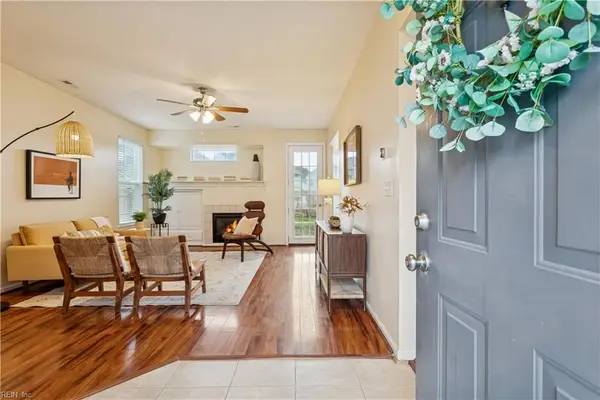 $435,000Pending3 beds 3 baths1,700 sq. ft.
808 Winter King Court, Chesapeake, VA 23323
MLS# 10623377Listed by: KW Allegiance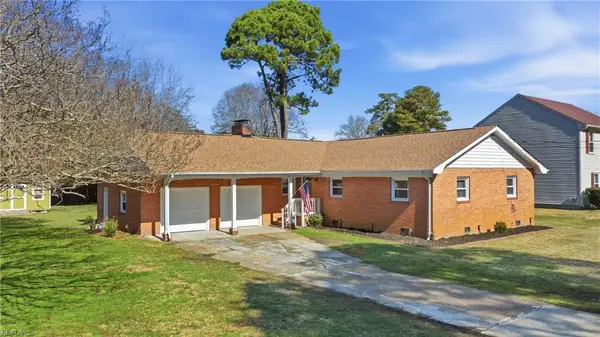 $428,000Pending3 beds 2 baths1,675 sq. ft.
324 Mobile Drive, Chesapeake, VA 23323
MLS# 10623229Listed by: The Miller Real Estate Group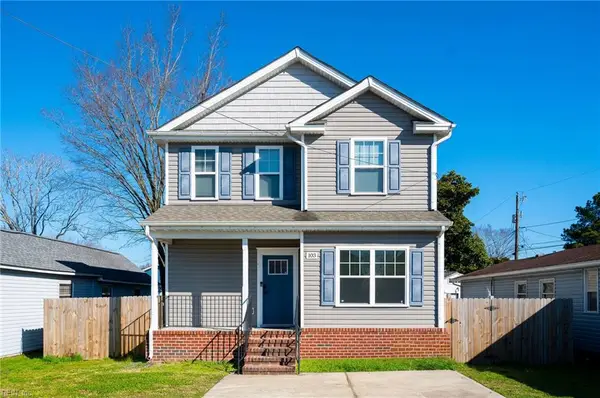 $390,000Pending4 beds 3 baths1,972 sq. ft.
103 Ford Street, Chesapeake, VA 23323
MLS# 10623183Listed by: Garrett Realty Partners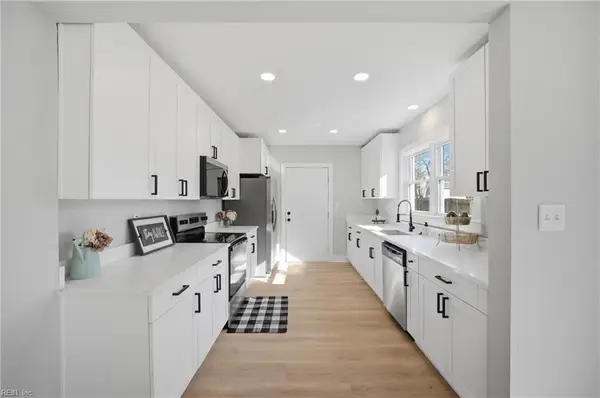 $419,900Pending6 beds 3 baths2,950 sq. ft.
2220 Battery Park Rd, Chesapeake, VA 23323
MLS# 10623165Listed by: Exit Realty Professionals $550,000Active5 beds 3 baths3,014 sq. ft.
3207 Hearring Way, Chesapeake, VA 23323
MLS# 10623090Listed by: RE/MAX Alliance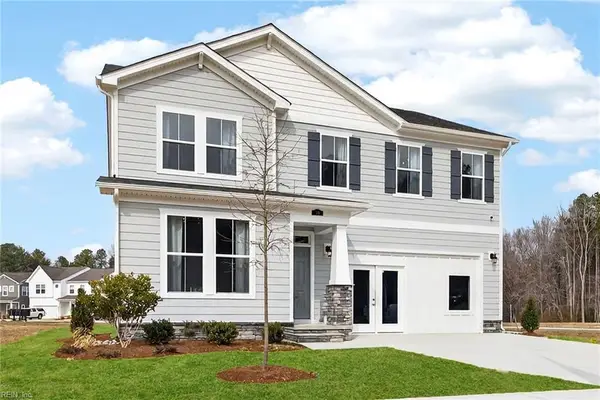 $474,900Active5 beds 3 baths2,427 sq. ft.
MM Poppy, Suffolk, VA 23434
MLS# 10622993Listed by: Today Homes Realty LLC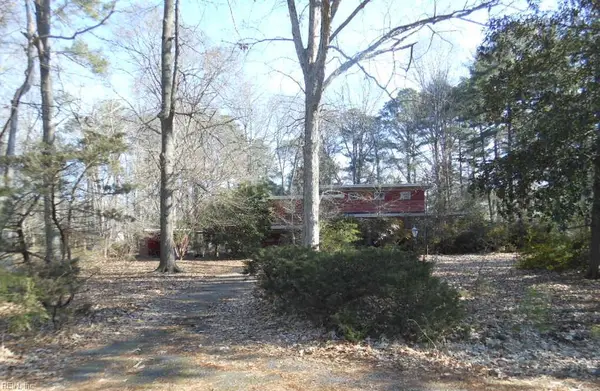 $287,000Pending3 beds 3 baths3,500 sq. ft.
2602 Cecilia Terrace, Chesapeake, VA 23323
MLS# 10622974Listed by: EXP Realty LLC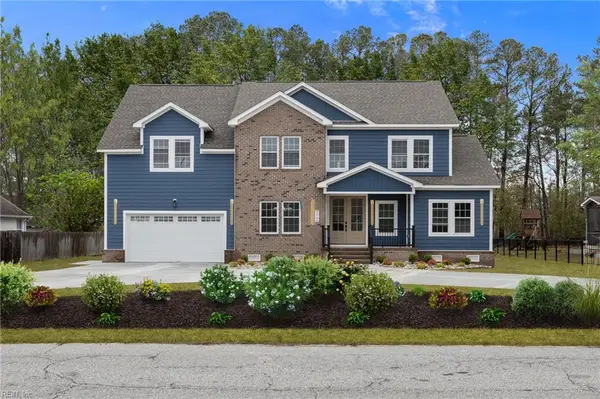 $849,999Active6 beds 5 baths4,000 sq. ft.
2064 Cedar Road, Chesapeake, VA 23323
MLS# 10622957Listed by: Partners In Real Estate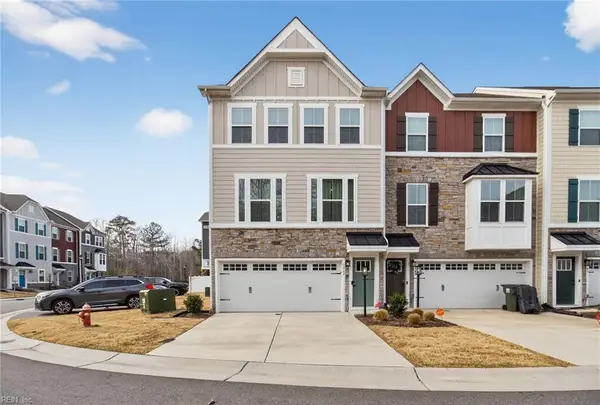 $439,900Pending3 beds 4 baths2,432 sq. ft.
1747 Ark Royal Road, Chesapeake, VA 23323
MLS# 10621594Listed by: Wainwright Real Estate $400,000Active3 beds 3 baths2,000 sq. ft.
949 Gabion Way, Chesapeake, VA 23323
MLS# 10620994Listed by: Keller Williams Capital Props.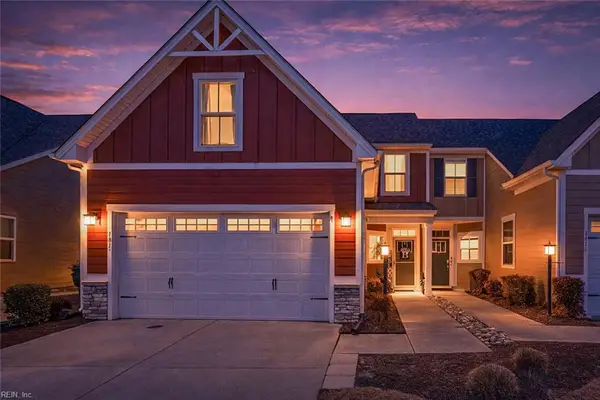 $440,000Active3 beds 3 baths1,975 sq. ft.
1818 Zephyr Way, Chesapeake, VA 23323
MLS# 10625683Listed by: Judy Reed Realty $669,900Active97.9 Acres
2237 Shillelagh Road, Chesapeake, VA 23323
MLS# 10621269Listed by: The Real Estate Group $375,000Pending4 beds 2 baths1,720 sq. ft.
2552 Roundtree Circle, Chesapeake, VA 23323
MLS# 10621302Listed by: EXP Realty LLC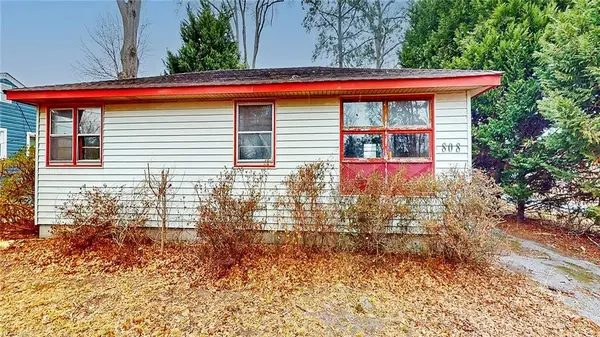 $155,000Pending3 beds 2 baths937 sq. ft.
808 State Street, Chesapeake, VA 23323
MLS# 10621385Listed by: Better Homes & Gdns Ntv Am Grp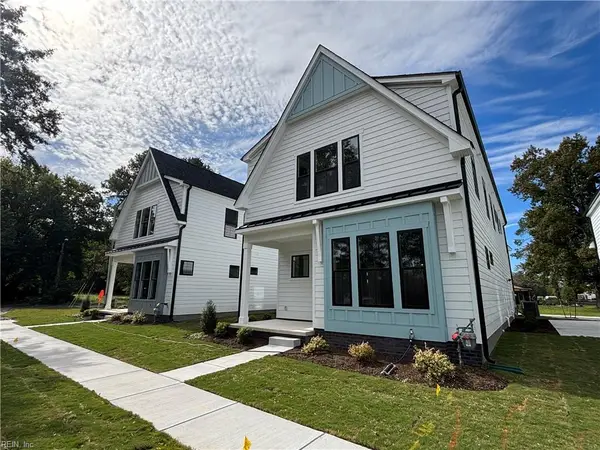 $621,820Active3 beds 4 baths2,500 sq. ft.
901 Calhoun Way, Chesapeake, VA 23322
MLS# 10621398Listed by: BHHS RW Towne Realty $152,500Pending0.25 Acres
1832 Rockwood Drive, Chesapeake, VA 23323
MLS# 10620806Listed by: The Real Estate Group $152,500Pending0.25 Acres
1836 Rockwood Drive, Chesapeake, VA 23323
MLS# 10620809Listed by: The Real Estate Group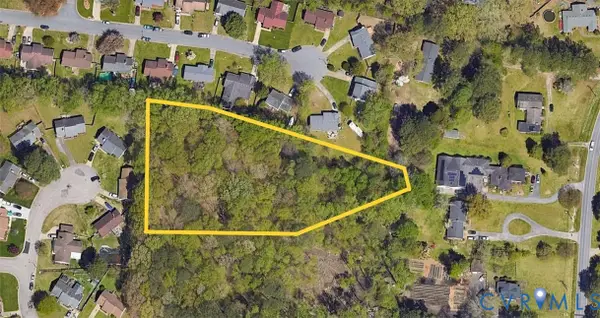 $45,000Active2.15 Acres
000 Shell Road, Chesapeake, VA 23323
MLS# 2604205Listed by: SAMSON PROPERTIES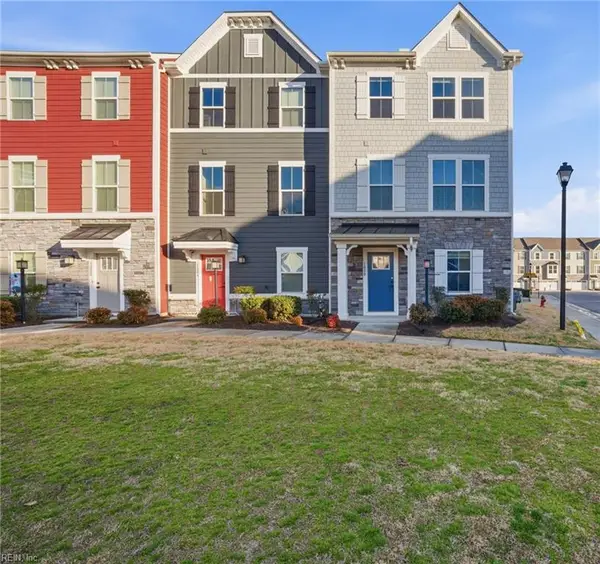 $379,900Pending3 beds 4 baths1,720 sq. ft.
1000 Revenge Way, Chesapeake, VA 23323
MLS# 10621123Listed by: EXP Realty LLC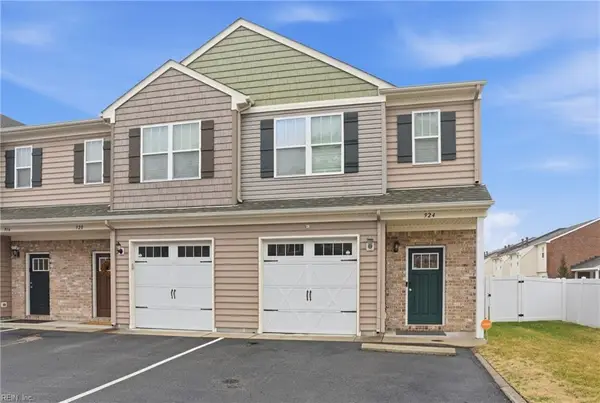 $230,000Pending3 beds 3 baths1,512 sq. ft.
924 Deep Branch Way, Chesapeake, VA 23323
MLS# 10621128Listed by: Iron Valley Real Estate HR $549,900Active4 beds 4 baths2,653 sq. ft.
1815 Honey Milk Road, Chesapeake, VA 23323
MLS# 10620973Listed by: Atlantic Sothebys Int'l Realty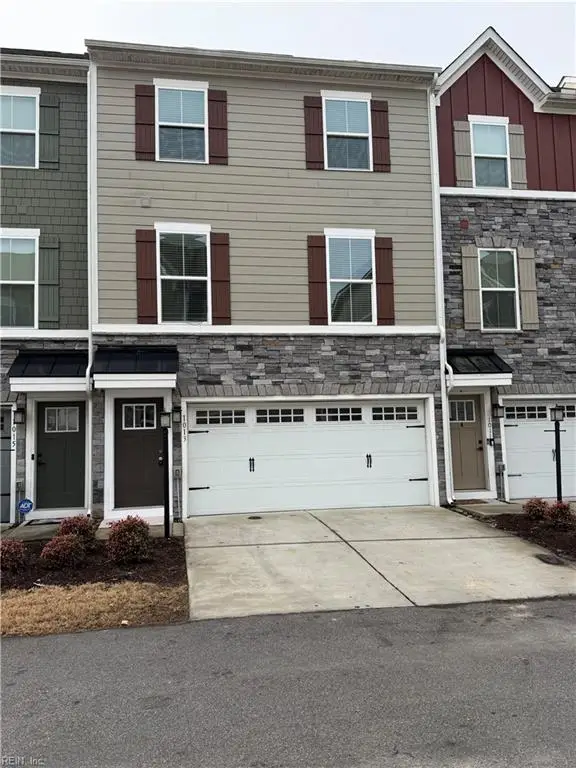 $422,700Active3 beds 3 baths2,036 sq. ft.
1013 Port Side Way, Chesapeake, VA 23323
MLS# 10620981Listed by: Own Real Estate LLC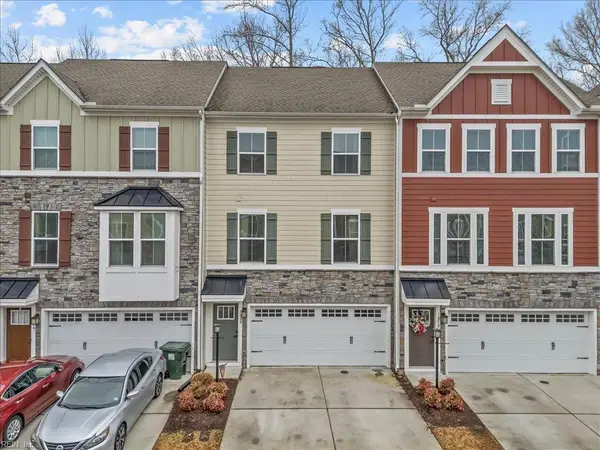 $412,000Active4 beds 3 baths2,036 sq. ft.
1808 Aft Way, Chesapeake, VA 23323
MLS# 10620525Listed by: Triumph Realty $395,000Active4 beds 3 baths2,000 sq. ft.
2812 Flag Road, Chesapeake, VA 23323
MLS# 10620721Listed by: World Class Realty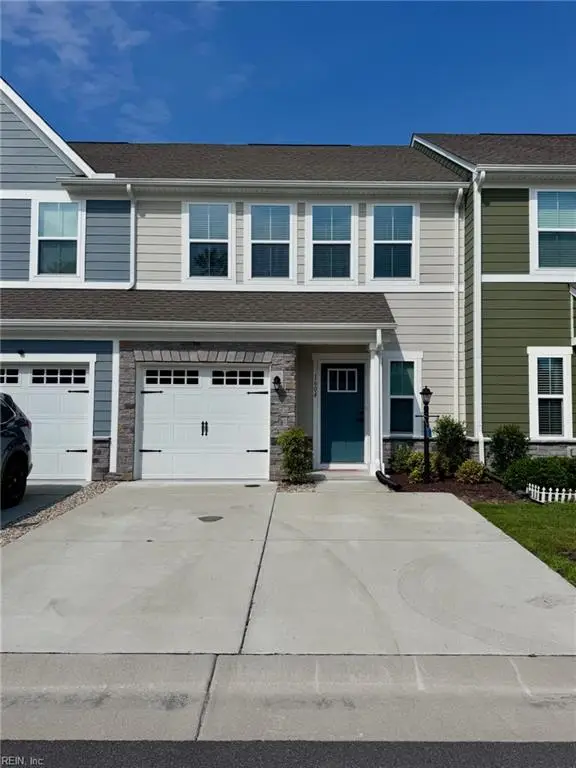 $419,900Active3 beds 3 baths1,776 sq. ft.
1604 Redwing Arch, Chesapeake, VA 23323
MLS# 10620770Listed by: Wainwright Real Estate $297,400Pending3 beds 2 baths1,400 sq. ft.
2029 Battery Park Road, Chesapeake, VA 23323
MLS# 10620478Listed by: Iron Valley Real Estate HR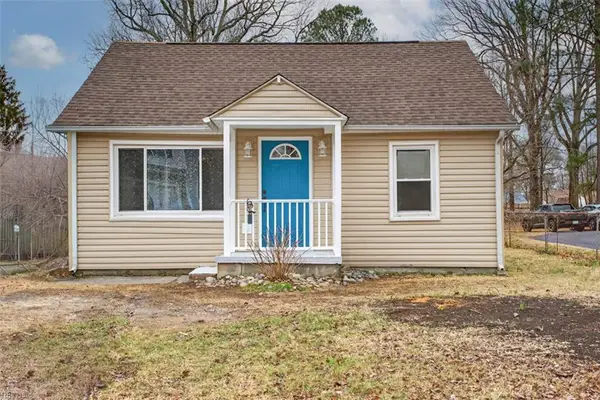 $269,900Pending3 beds 1 baths1,016 sq. ft.
2213 Tennessee Drive, Chesapeake, VA 23323
MLS# 10620505Listed by: BHHS RW Towne Realty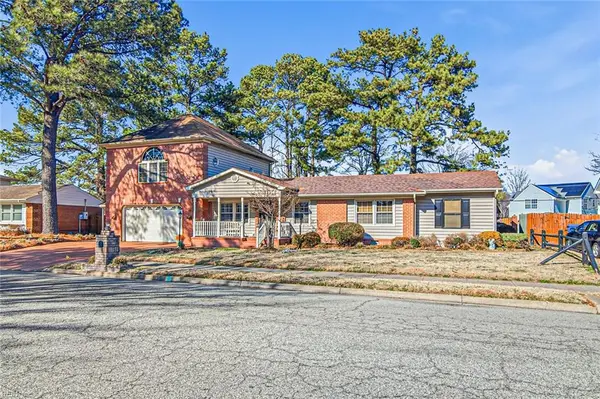 $389,000Pending4 beds 2 baths2,172 sq. ft.
909 King Arthur Drive, Chesapeake, VA 23323
MLS# 10620371Listed by: Maxwell Realty LLC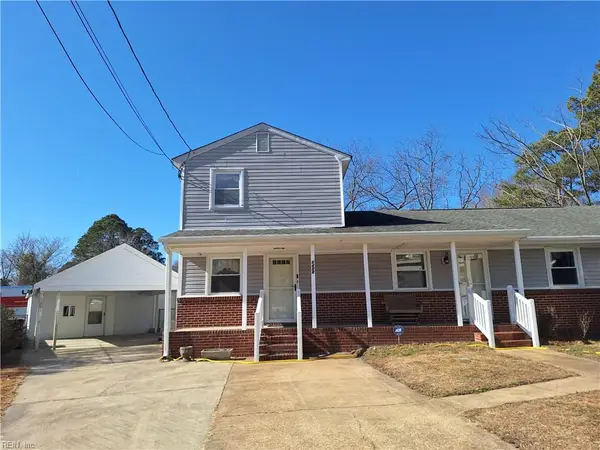 $325,000Active4 beds 3 baths1,850 sq. ft.
1400 Misty Court, Chesapeake, VA 23323
MLS# 10620212Listed by: A Better Way Realty Inc. $585,000Active5 beds 3 baths3,151 sq. ft.
3215 Joplin Lane, Chesapeake, VA 23323
MLS# 10620025Listed by: RE/MAX Allegiance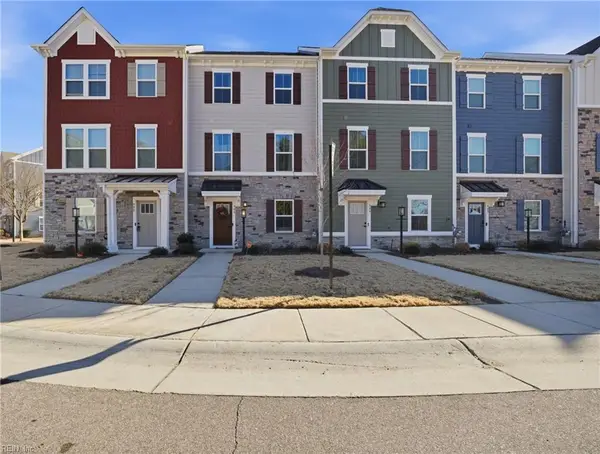 $369,900Pending3 beds 3 baths1,720 sq. ft.
906 Capstan Way, Chesapeake, VA 23323
MLS# 10619735Listed by: The Real Estate Group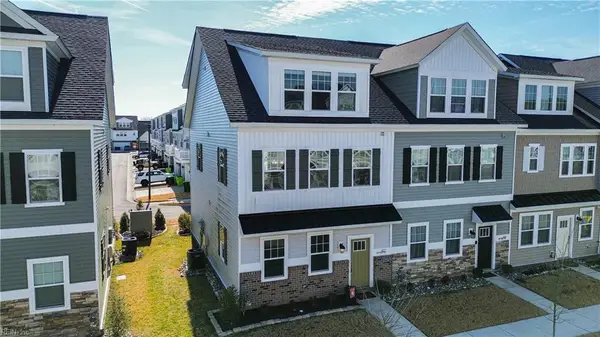 $460,000Active3 beds 4 baths2,141 sq. ft.
427 Life Tree Trail, Chesapeake, VA 23323
MLS# 10619830Listed by: Aweigh Real Estate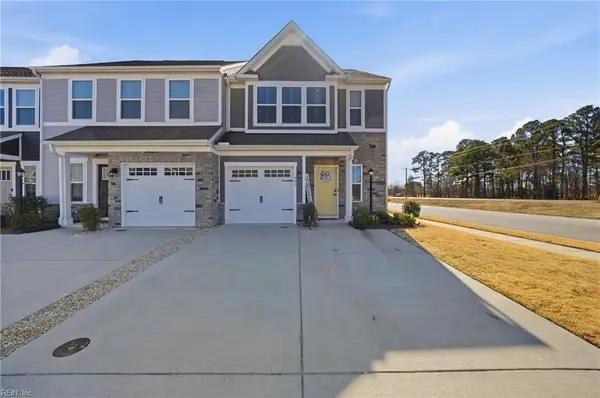 $424,500Active3 beds 3 baths1,791 sq. ft.
557 Bright Red Run, Chesapeake, VA 23323
MLS# 10619747Listed by: RHOAD & CO.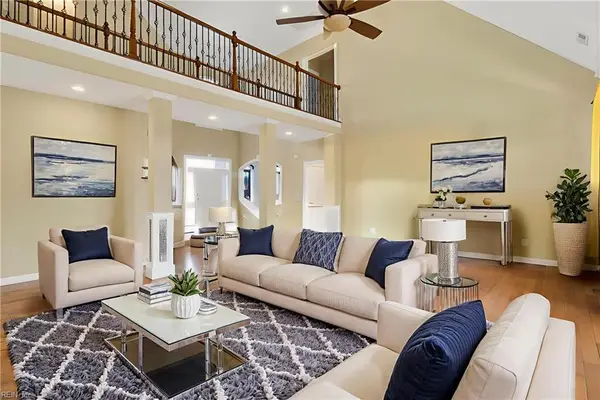 $799,000Active5 beds 5 baths4,175 sq. ft.
1945 Lancing Crest Lane, Chesapeake, VA 23323
MLS# 10619225Listed by: Keller Williams Capital Props.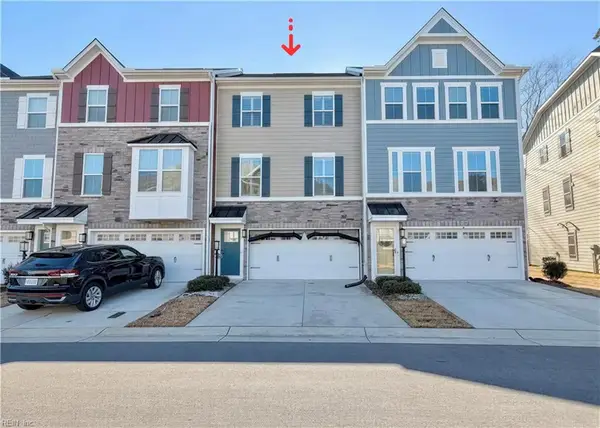 $429,000Pending3 beds 3 baths2,050 sq. ft.
1733 Fortune Terrace, Chesapeake, VA 23323
MLS# 10619367Listed by: Swell Real Estate Co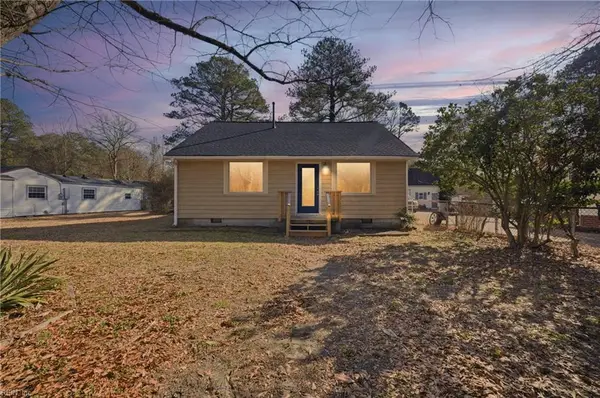 $275,000Pending4 beds 1 baths1,587 sq. ft.
185 George Washington Highway S, Chesapeake, VA 23323
MLS# 10619339Listed by: PMI Virginia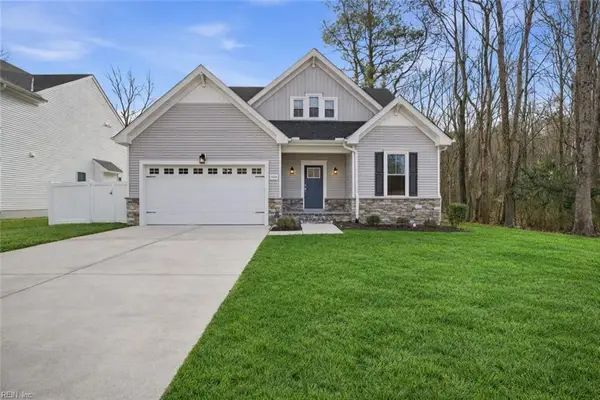 $598,900Active4 beds 3 baths2,200 sq. ft.
2029 Shipyard Road, Chesapeake, VA 23323
MLS# 10619205Listed by: 1st Class RealEstate Integrity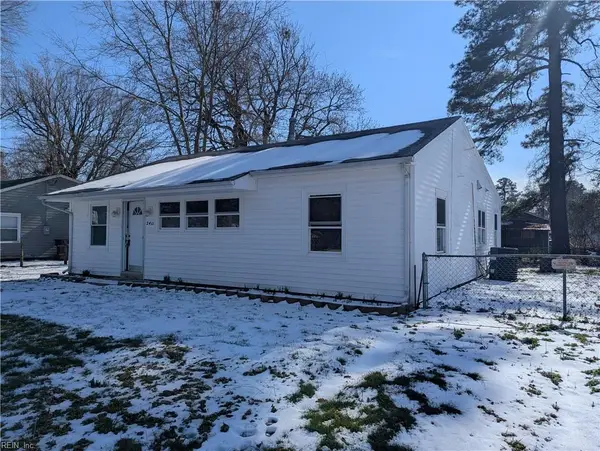 $250,000Pending3 beds 2 baths1,369 sq. ft.
2411 Youngman Road, Chesapeake, VA 23323
MLS# 10619160Listed by: LPT Realty LLC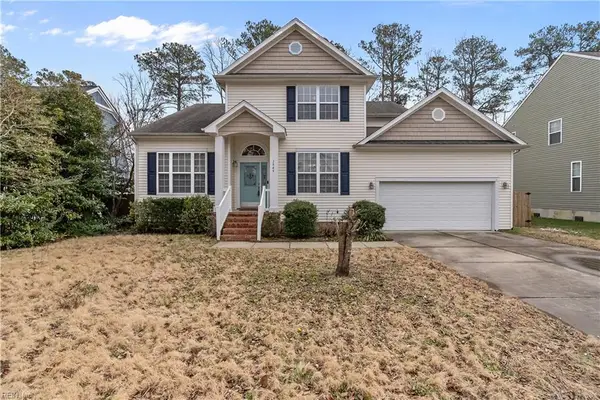 $600,000Pending4 beds 3 baths2,842 sq. ft.
1949 Lemonwood Road, Chesapeake, VA 23323
MLS# 10619148Listed by: EXP Realty LLC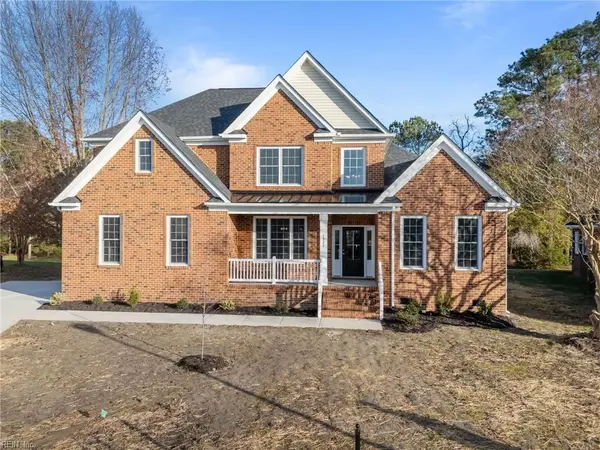 $849,900Active5 beds 4 baths2,900 sq. ft.
1920 Lancing Crest Lane, Chesapeake, VA 23323
MLS# 10619036Listed by: BHHS RW Towne Realty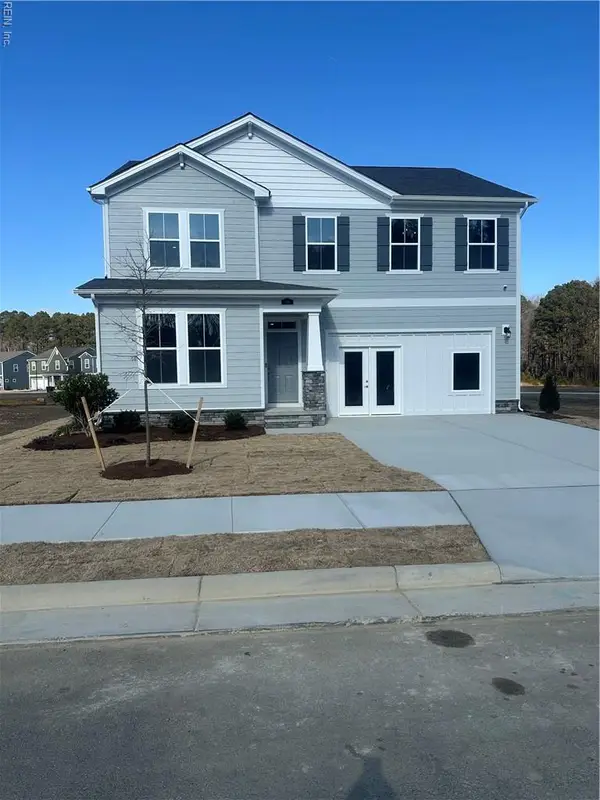 $509,900Active5 beds 3 baths2,427 sq. ft.
MM Poppy, Suffolk, VA 23435
MLS# 10618739Listed by: Today Homes Realty LLC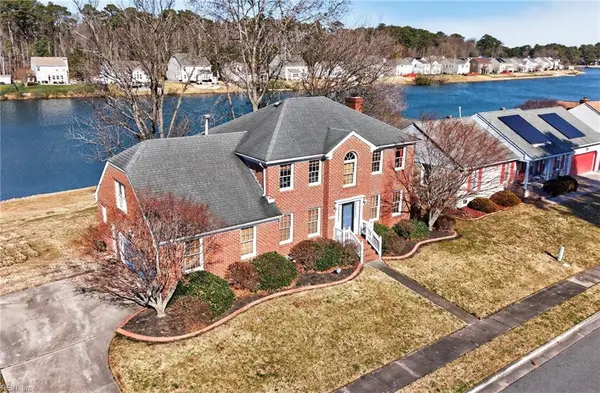 $530,000Pending4 beds 3 baths3,169 sq. ft.
4108 Lakeview Drive, Chesapeake, VA 23323
MLS# 10618231Listed by: BHHS RW Towne Realty $328,000Pending3 beds 2 baths1,512 sq. ft.
2685 Powell Circle, Chesapeake, VA 23323
MLS# 10618237Listed by: The Bryant Group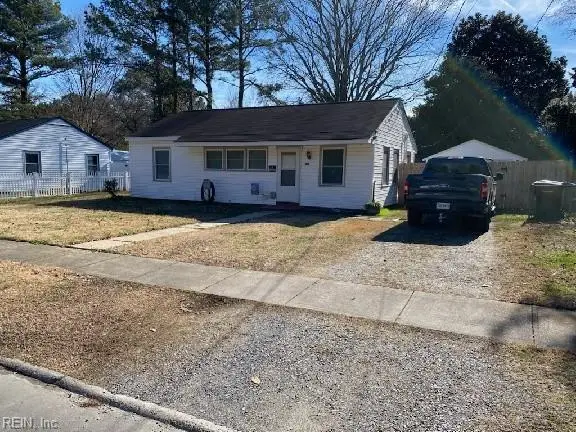 $245,000Pending3 beds 1 baths925 sq. ft.
2507 Sunset Drive, Chesapeake, VA 23323
MLS# 10617306Listed by: Wainwright Real Estate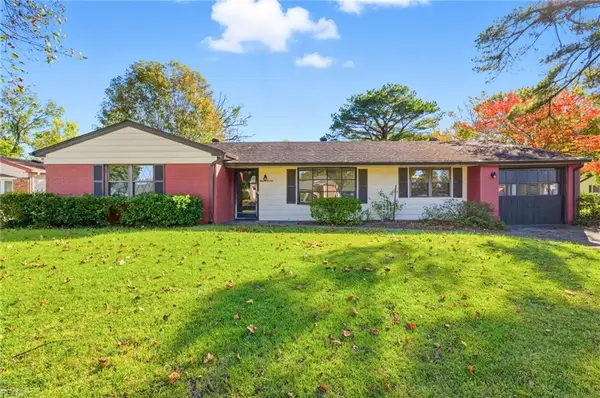 $345,000Pending3 beds 2 baths1,727 sq. ft.
1101 Kenelm Court, Chesapeake, VA 23323
MLS# 10617320Listed by: Thrive Realty $775,995Pending4 beds 4 baths2,500 sq. ft.
1916 Mccoy Road, Chesapeake, VA 23323
MLS# 10617197Listed by: BHHS RW Towne Realty $95,000Active2 beds 1 baths764 sq. ft.
2053 Iowa Street, Chesapeake, VA 23323
MLS# 10616828Listed by: KW Coastal Virginia Chesapeake $575,000Active5 beds 3 baths3,093 sq. ft.
2210 Chesterfield Loop, Chesapeake, VA 23323
MLS# 10616641Listed by: RE/MAX Alliance $360,000Pending4 beds 2 baths1,346 sq. ft.
1008 Shore Road, Chesapeake, VA 23323
MLS# 10615401Listed by: Keller Williams Town Center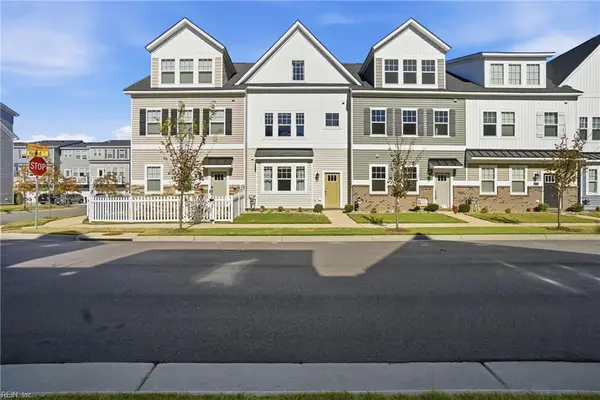 $429,000Pending3 beds 4 baths1,685 sq. ft.
411 Asuza Street, Chesapeake, VA 23323
MLS# 10625159Listed by: AMW Real Estate Inc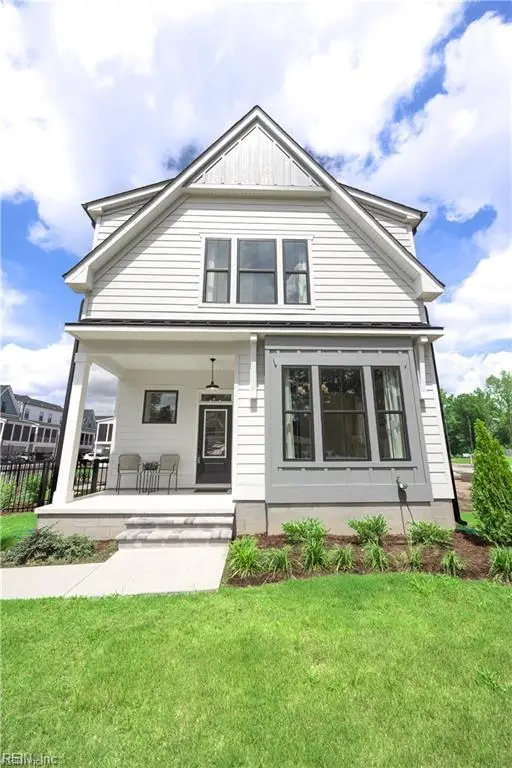 $640,115Pending3 beds 4 baths2,500 sq. ft.
909 Calhoun Way, Chesapeake, VA 23322
MLS# 10615671Listed by: BHHS RW Towne Realty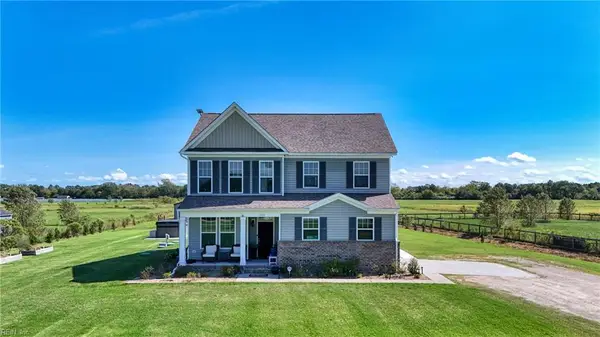 $725,000Pending4 beds 3 baths2,384 sq. ft.
1517 Lookout Court, Chesapeake, VA 23323
MLS# 10615734Listed by: BHHS RW Towne Realty $438,500Pending4 beds 4 baths2,432 sq. ft.
1808 Gangway Trace, Chesapeake, VA 23323
MLS# 10615551Listed by: A Better Way Realty Inc.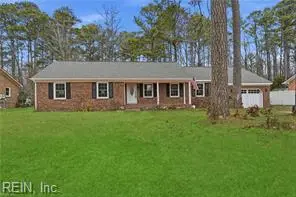 $475,000Active4 beds 2 baths1,948 sq. ft.
3154 Martin Johnson Road, Chesapeake, VA 23323
MLS# 10625543Listed by: Howard Hanna Real Estate Svcs. $220,000Pending0 Acres
1928 Foxwood Drive, Chesapeake, VA 23323
MLS# 10615095Listed by: Judy Reed Realty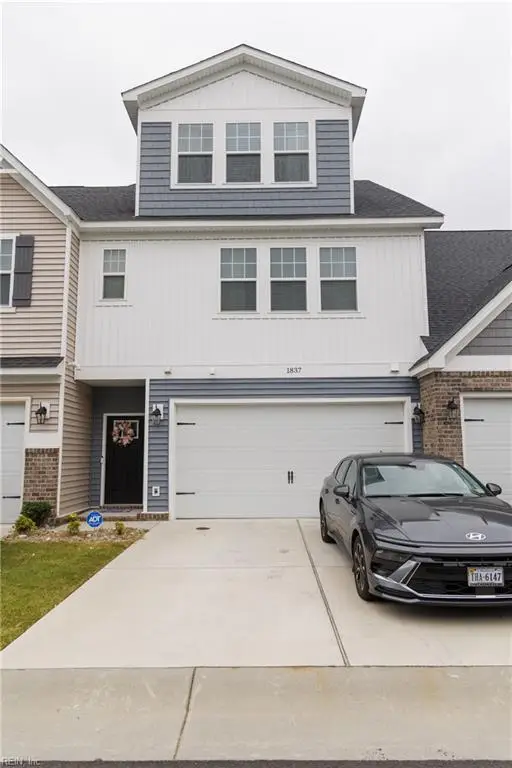 $558,000Active4 beds 4 baths2,316 sq. ft.
1837 Honey Milk Road, Chesapeake, VA 23323
MLS# 10614400Listed by: Wainwright Real Estate $499,999Pending4 beds 3 baths2,072 sq. ft.
324 Big Pond Lane, Chesapeake, VA 23323
MLS# 10614917Listed by: Wainwright Real Estate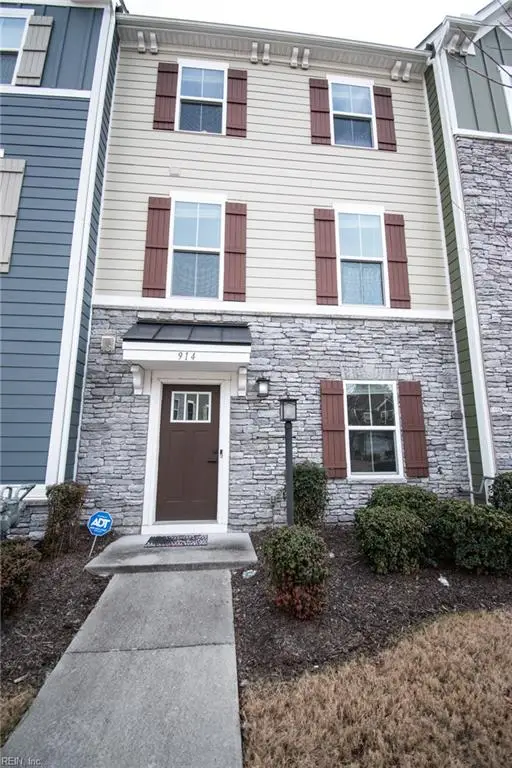 $440,000Active3 beds 4 baths2,089 sq. ft.
914 Avast Way, Chesapeake, VA 23323
MLS# 10614679Listed by: KW Coastal Virginia Chesapeake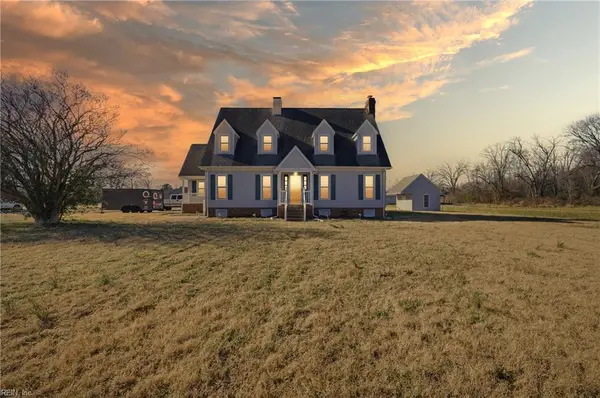 $600,000Pending4 beds 3 baths2,025 sq. ft.
1432 West Road, Chesapeake, VA 23323
MLS# 10614631Listed by: The Agency $151,600Active2 beds 2 baths1,356 sq. ft.
413 George Washington Highway N, Chesapeake, VA 23323
MLS# 10614432Listed by: Real Broker LLC $405,000Pending3 beds 3 baths2,100 sq. ft.
995 Gabion Way, Chesapeake, VA 23323
MLS# 10614243Listed by: RE/MAX Alliance $509,900Active4 beds 3 baths2,222 sq. ft.
3201 Jean Court, Chesapeake, VA 23323
MLS# 10614228Listed by: Creative Realty LLC $414,900Active3 beds 3 baths1,744 sq. ft.
1605 Redwing Arc, Chesapeake, VA 23323
MLS# 10612411Listed by: A Better Way Realty Inc. $599,900Pending5 beds 4 baths3,400 sq. ft.
627 Mill Creek Parkway, Chesapeake, VA 23323
MLS# 10613069Listed by: EXP Realty LLC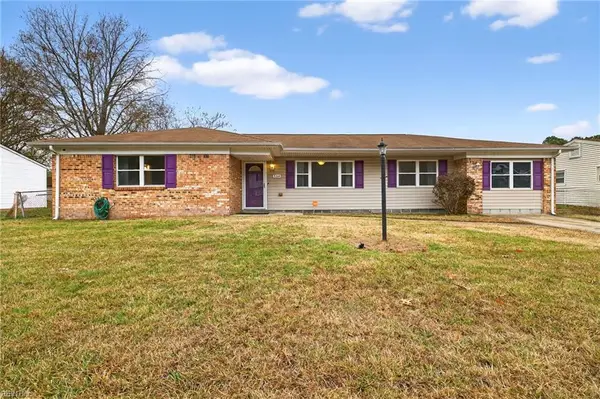 $350,000Pending4 beds 2 baths1,984 sq. ft.
3244 Sir Meliot Drive, Chesapeake, VA 23323
MLS# 10621016Listed by: RE/MAX Allegiance $348,000Pending3 beds 1 baths1,973 sq. ft.
2320 Battery Park Road, Chesapeake, VA 23323
MLS# 10611867Listed by: Samson Properties $190,000Active1.38 Acres
2701 Seven Eleven Road, Chesapeake, VA 23323
MLS# 10611752Listed by: Wainwright Real Estate $668,000Active5 beds 3 baths2,350 sq. ft.
2116 Cedar Road, Chesapeake, VA 23323
MLS# 10619413Listed by: EXP Realty LLC $584,900Pending5 beds 3 baths3,228 sq. ft.
3009 Patrick Henry Drive, Chesapeake, VA 23323
MLS# 10610233Listed by: World Class Realty & Prop Mgmt $175,000Pending2 beds 1 baths825 sq. ft.
2410 Payne Road, Chesapeake, VA 23323
MLS# 10625523Listed by: The Real Estate Group $525,000Active5 beds 3 baths2,926 sq. ft.
2601 Sawtooth Circle, Chesapeake, VA 23323
MLS# 10608572Listed by: Real Broker LLC $568,700Active4 beds 3 baths2,680 sq. ft.
704 Log Fern Lane, Chesapeake, VA 23323
MLS# 10607965Listed by: CENTURY 21 Nachman Realty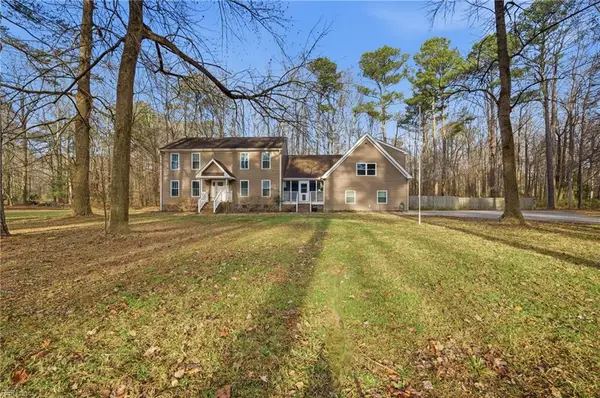 $675,000Pending4 beds 4 baths2,714 sq. ft.
3528 Kentucky Trail, Chesapeake, VA 23323
MLS# 10615414Listed by: Aweigh Real Estate $745,000Pending5 beds 4 baths2,700 sq. ft.
2014 Millville Road, Chesapeake, VA 23323
MLS# 10604594Listed by: G Daniels & Company $575,900Pending5 beds 3 baths2,700 sq. ft.
212 Andiron Arch, Chesapeake, VA 23323
MLS# 10604134Listed by: Iron Valley Real Estate HR $400,000Pending4 beds 3 baths1,734 sq. ft.
1241 N River Drive, Chesapeake, VA 23323
MLS# 10617273Listed by: Real Broker LLC $445,000Pending3 beds 3 baths2,000 sq. ft.
949 Gabion Way, Chesapeake, VA 23323
MLS# 10603335Listed by: KW Coastal Chesapeake Virginia LLC $1,700,000Active12 Acres
10+AC Yadkin Property I-64 Express Way Road, Chesapeake, VA 23323
MLS# 10569030Listed by: First Providence Realty Inc $700,000Active6 beds 4 baths2,802 sq. ft.
3504 Old Mill Road, Chesapeake, VA 23323
MLS# 10615465Listed by: 1st Class RealEstate Integrity $499,999Pending4 beds 3 baths2,068 sq. ft.
2139 Sunset Maple Street, Chesapeake, VA 23323
MLS# 10597420Listed by: ERA Real Estate Professionals $805,115Pending4 beds 4 baths2,500 sq. ft.
1918 Mccoy Rd, Chesapeake, VA 23323
MLS# 10612653Listed by: BHHS RW Towne Realty $590,000Pending4 beds 3 baths2,842 sq. ft.
1949 Lemonwood Road, Chesapeake, VA 23323
MLS# 10589282Listed by: EXP Realty LLC $560,000Active4 beds 4 baths2,653 sq. ft.
1801 Honey Milk Road, Chesapeake, VA 23323
MLS# 10615568Listed by: Keller Williams Realty Twn Ctr $290,000Active7.4 Acres
1813 Shillelagh Road, Chesapeake, VA 23323
MLS# 10615873Listed by: 757 Realty $650,000Pending4 beds 3 baths1,860 sq. ft.
253 George Washington Highway S, Chesapeake, VA 23323
MLS# 10622922Listed by: COVA Home Realty $755,715Pending4 beds 4 baths3,042 sq. ft.
2328 Shillelagh Road, Chesapeake, VA 23323
MLS# 10563572Listed by: AtCoastal Realty $599,900Active3 beds 3 baths2,500 sq. ft.
925 Calhoun Way, Chesapeake, VA 23322
MLS# 10567862Listed by: Howard Hanna Real Estate Services $868,188Pending5 beds 5 baths3,668 sq. ft.
2352 Shillelagh Road, Chesapeake, VA 23323
MLS# 10577272Listed by: AtCoastal Realty $369,000Active14.91 Acres
Lot 2 Shillelagh Road, Chesapeake, VA 23323
MLS# 10577240Listed by: RE/MAX Alliance $395,000Active10 Acres
10 AC Millville Road, Chesapeake, VA 23323
MLS# 10574904Listed by: Coldwell Banker Premier $441,000Pending4 beds 4 baths2,518 sq. ft.
3116 Ferncliff Court, Chesapeake, VA 23323
MLS# 10587868Listed by: Holloway Experience Real Est. $299,000Active11.45 Acres
8 Shillelagh Road, Chesapeake, VA 23323
MLS# 10568909Listed by: Howard Hanna Real Estate Svcs. $880,035Pending5 beds 4 baths2,700 sq. ft.
1917 Mccoy Rd, Chesapeake, VA 23323
MLS# 10567313Listed by: BHHS RW Towne Realty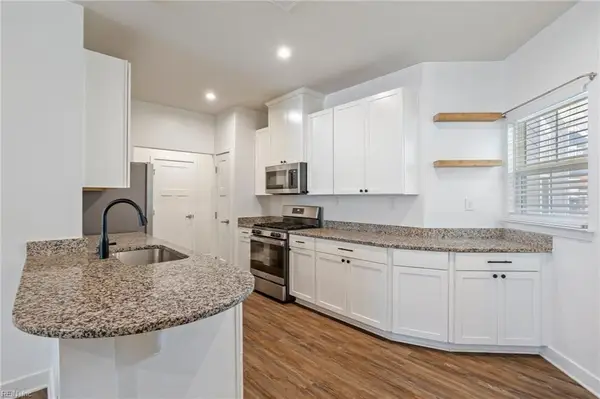 $430,000Pending3 beds 3 baths1,975 sq. ft.
1830 Whelp Way, Chesapeake, VA 23323
MLS# 10614230Listed by: The Agency $95,000Pending0.69 Acres
.69 ac Old Mill Road, Chesapeake, VA 23323
MLS# 10554957Listed by: The Real Estate Group $769,900Pending4 beds 4 baths2,500 sq. ft.
1908 Mccoy Road, Chesapeake, VA 23323
MLS# 10510017Listed by: BHHS RW Towne Realty $160,000Active0.56 Acres
Par B George Washington Highway S, Chesapeake, VA 23323
MLS# 10244776Listed by: Samson Properties $982,800Active12.28 Acres
1928 Moses Grandy Trail, Chesapeake, VA 23323
MLS# 10395057Listed by: BHHS RW Towne Realty $3,537,900Active0 Acres
Lots Moses Grandy ( Par.b,c,d) Trail, Chesapeake, VA 23323
MLS# 10395092Listed by: BHHS RW Towne Realty
Local realty services provided by:CENTURY 21 Realty @ Home, CENTURY 21 Dale Realty Co.
The listings data displayed on this medium comes in part from the Real Estate Information Network Inc. (REIN) and has been authorized by participating listing Broker Members of REIN for display. REIN's listings are based upon Data submitted by its Broker Members, and REIN therefore makes no representation or warranty regarding the accuracy of the Data. All users of REIN's listings database should confirm the accuracy of the listing information directly with the listing agent. 2026 REIN. REIN's listings Data and information is protected under federal copyright laws. Federal law prohibits, among other acts, the unauthorized copying or alteration of, or preparation of derivative works from, all or any part of copyrighted materials, including certain compilations of Data and information. COPYRIGHT VIOLATORS MAY BE SUBJECT TO SEVERE FINES AND PENALTIES UNDER FEDERAL LAW. REIN updates its listings on a daily basis. Data last updated: March 19, 2026 This application does not include information on all of the properties available for sale at this time.
Some listings may be duplicated in the search results due to the co-mingling of listings from more than one multiple listing service. Should there be different listing information between the duplicated listings; user is advised to verify the accuracy of the listing information before making any financial decisions.
2026 REIN, Inc. Information Deemed Reliable But Not Guaranteed.
Popular searches near 23323
Popular neighborhoods near 23323
- Blackwater, Virginia Beach homes for sale
- Camelot, Chesapeake homes for sale
- College Park, Virginia Beach homes for sale
- Coventry, Virginia Beach homes for sale
- Deep Creek, Chesapeake homes for sale
- Downtown, Portsmouth homes for sale
- Glenwood Seasons, Virginia Beach homes for sale
- Great Bridge, Chesapeake homes for sale
- Greenbrier, Chesapeake homes for sale
- Indian River, Chesapeake homes for sale
- Kempsville, Virginia Beach homes for sale
- Norfolk Highlands, Chesapeake homes for sale
- Olde Towne, Portsmouth homes for sale
- Rivercrest, Chesapeake homes for sale
- Salem, Virginia Beach homes for sale
- Salem Woods, Virginia Beach homes for sale
- South Chesapeake, Chesapeake homes for sale
- South Norfolk, Chesapeake homes for sale
- Uptown, Portsmouth homes for sale
- Western Branch, Chesapeake homes for sale
Counties near Chesapeake, 23323
- Camden County homes for sale
- Chesapeake city County homes for sale
- Chowan County homes for sale
- Currituck County homes for sale
- Franklin city County homes for sale
- Gates County homes for sale
- Hampton city County homes for sale
- Hertford County homes for sale
- Isle of Wight County homes for sale
- Newport News city County homes for sale
- Norfolk city County homes for sale
- Pasquotank County homes for sale
- Perquimans County homes for sale
- Poquoson city County homes for sale
- Portsmouth city County homes for sale
- Southampton County homes for sale
- Suffolk city County homes for sale
- Surry County homes for sale
- Virginia Beach city County homes for sale
- York County homes for sale
Protect your home and budget from life's surprises with an Assurant Home Warranty, backed by a partner that supports you through every step of homeownership. Explore Plans.
©2026 Century 21 Real Estate LLC. All rights reserved. CENTURY 21®, the CENTURY 21 Logo and C21® are service marks owned by Century 21 Real Estate LLC. Century 21 Real Estate LLC fully supports the principles of the Fair Housing Act and the Equal Opportunity Act. Each office is independently owned and operated. Listing information is deemed reliable but not guaranteed accurate.