- Bedford Park homes for sale
- Berwyn homes for sale
- Blue Island homes for sale
- Burbank homes for sale
- Calumet homes for sale
- Calumet Park homes for sale
- Chicago homes for sale
- Cicero homes for sale
- Evergreen Park homes for sale
- Hometown homes for sale
- Oak Lawn homes for sale
- Oak Park homes for sale
- Oak Park Township homes for sale
- Riverdale homes for sale
- Riverside homes for sale
- Stickney Township homes for sale
- Stickney homes for sale
- Summit homes for sale
- Summit Argo homes for sale
- Whiting homes for sale
60615, IL - homes for sale
166 of 166 results displayed
- New
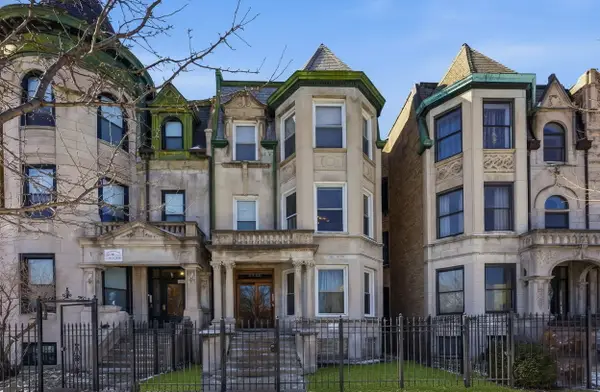
 $535,000Active3 beds 2 baths1,400 sq. ft.
1428 E 55th Street, Chicago, IL 60615
MLS# 12606397Listed by: PROSPERITY HOMES CO.
- New
 $1,125,000Active9 beds 6 baths
4841 S Prairie Avenue, Chicago, IL 60615
MLS# 12605340Listed by: NORTH CLYBOURN GROUP, INC. - New
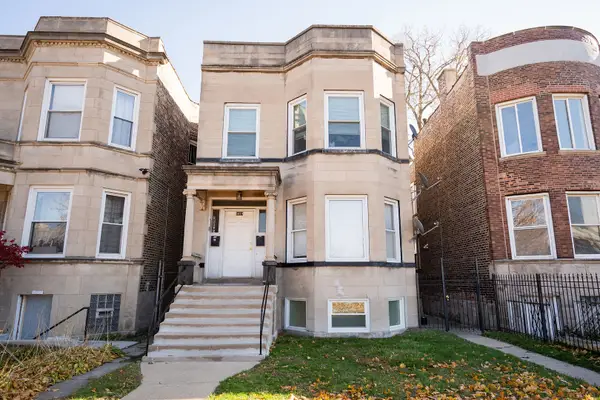
 $799,000Active9 beds 6 baths
4736 S Prairie Avenue, Chicago, IL 60615
MLS# 12606041Listed by: NORTH CLYBOURN GROUP, INC. - New
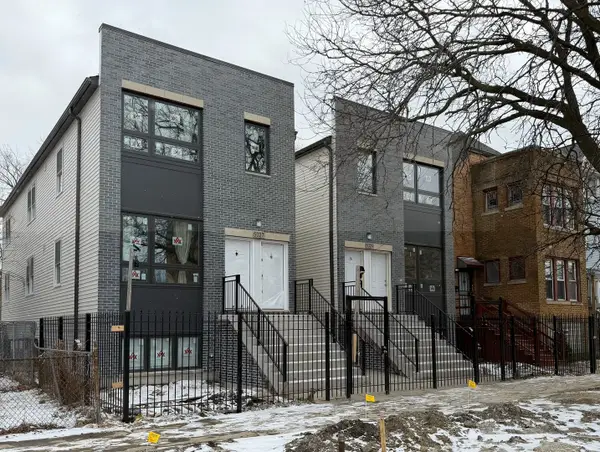
 $699,900Active8 beds 6 baths
5419 S Wabash Avenue, Chicago, IL 60615
MLS# 12605934Listed by: KELLER WILLIAMS PREFERRED RLTY - New
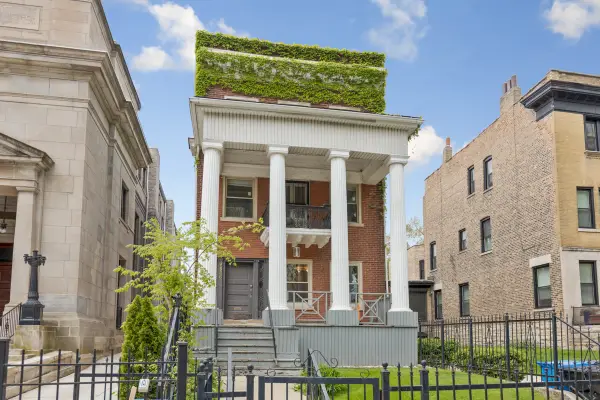 $925,000Active6 beds 5 baths
4836 S Dorchester Avenue, Chicago, IL 60615
MLS# 12605785Listed by: PRINCE REALTY GROUP LLC - New
 $289,500Active3 beds 3 baths1,800 sq. ft.
1755 E 55th Street #1201, Chicago, IL 60615
MLS# 12604741Listed by: COMPASS - New
 $1,450,000Active12 beds 10 baths
5029 S Indiana Avenue, Chicago, IL 60615
MLS# 12604602Listed by: PEDESTAL REALTY LLC - New
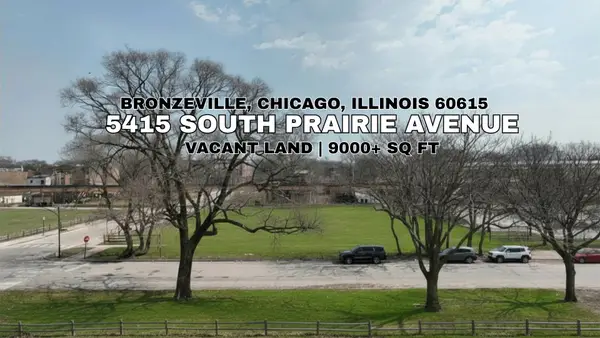 $225,000Active0 Acres
5415 S Prairie Avenue, Chicago, IL 60615
MLS# 12603145Listed by: COLDWELL BANKER REALTY  $719,000Pending5 beds 3 baths
5337 S Maryland Avenue, Chicago, IL 60615
MLS# 12527685Listed by: BERKSHIRE HATHAWAY HOMESERVICES CHICAGO $349,000Pending2 beds 2 baths1,500 sq. ft.
1653 E 55th Street #2, Chicago, IL 60615
MLS# 12597564Listed by: CROSS STREET REAL ESTATE- New
 $225,000Active2 beds 1 baths1,300 sq. ft.
5470 S Woodlawn Avenue #1E, Chicago, IL 60615
MLS# 12601864Listed by: COLDWELL BANKER REALTY  $375,000Pending3 beds 2 baths1,650 sq. ft.
5142 S Greenwood Avenue #2, Chicago, IL 60615
MLS# 12592044Listed by: BERKSHIRE HATHAWAY HOMESERVICES CHICAGO- Open Sat, 11am to 1pmNew
 $849,900Active5 beds 3 baths
1201 E Madison Park Drive #3, Chicago, IL 60615
MLS# 12601588Listed by: KELLER WILLIAMS ONECHICAGO - New
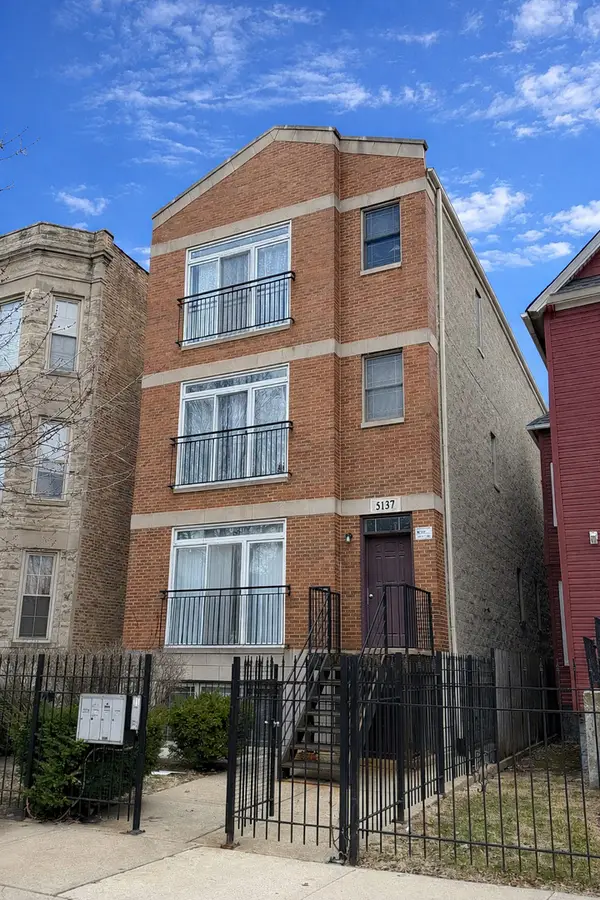 $1,130,000Active12 beds 8 baths
5137 S Wabash Avenue, Chicago, IL 60615
MLS# 12600021Listed by: EXP REALTY - New
 $285,000Active2 beds 1 baths
5108 S Woodlawn Avenue #3G, Chicago, IL 60615
MLS# 12600942Listed by: ULTIMATE REALTY GROUP LLC - New
 $410,000Active3 beds 2 baths1,700 sq. ft.
5474 S Everett Avenue #1N, Chicago, IL 60615
MLS# 12592663Listed by: RE/MAX PREMIER - New
 $1,849,000Active6 beds 5 baths4,700 sq. ft.
4801 S Kimbark Avenue, Chicago, IL 60615
MLS# 12515990Listed by: BERKSHIRE HATHAWAY HOMESERVICES CHICAGO  $650,000Active4 beds 3 baths
4701 S Woodlawn Avenue, Chicago, IL 60615
MLS# 12598026Listed by: NORTH CLYBOURN GROUP, INC. $240,000Pending3 beds 2 baths1,600 sq. ft.
5218 S Dorchester Avenue #1, Chicago, IL 60615
MLS# 12577501Listed by: @PROPERTIES CHRISTIE'S INTERNATIONAL REAL ESTATE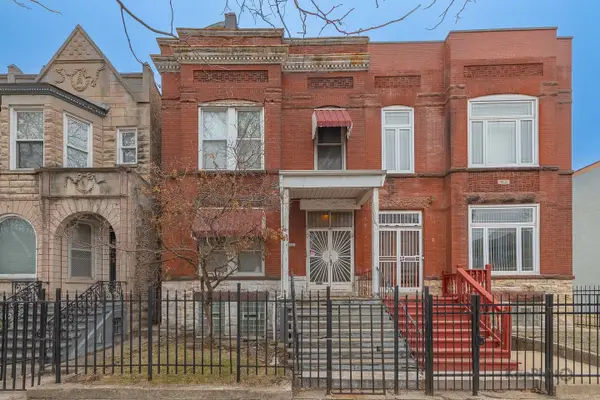
 $249,000Pending6 beds 2 baths
4931 S Champlain Avenue, Chicago, IL 60615
MLS# 12597130Listed by: CENTURY 21 S.G.R., INC.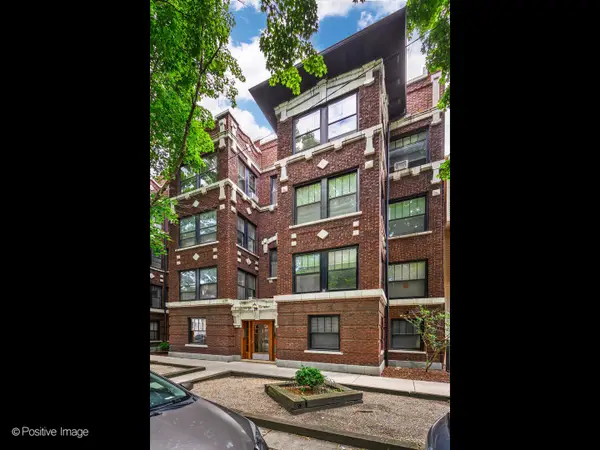 $295,000Pending2 beds 1 baths1,800 sq. ft.
1365 E 52nd Street #1E, Chicago, IL 60615
MLS# 12581515Listed by: COMPASS $770,000Active7 beds 5 baths
611 E 50th Place, Chicago, IL 60615
MLS# 12596802Listed by: RE/MAX PREMIER LUXURY COLLECTION $199,000Pending3 beds 2 baths1,200 sq. ft.
5220 S Michigan Avenue #2, Chicago, IL 60615
MLS# 12596952Listed by: MCSULLY PROPERTIES LLC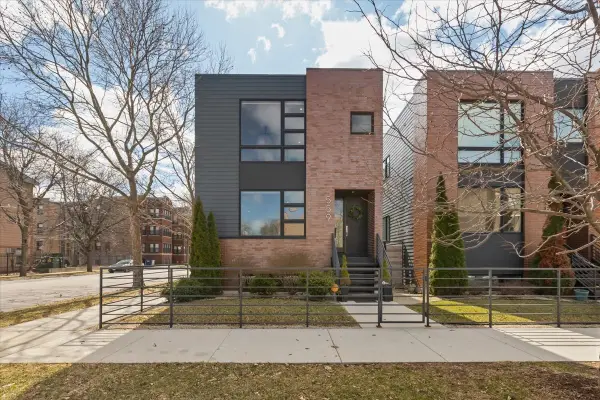 $999,000Active5 beds 4 baths3,000 sq. ft.
559 E 50th Street, Chicago, IL 60615
MLS# 12595894Listed by: EXIT STRATEGY REALTY / EMA MANAGEMENT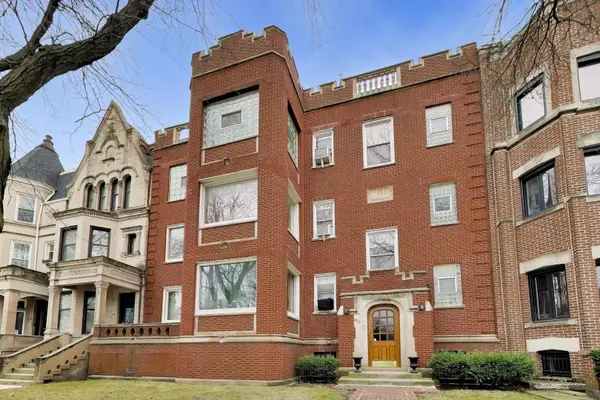 $409,000Active4 beds 3 baths2,200 sq. ft.
825 E Drexel Square #2, Chicago, IL 60615
MLS# 12564556Listed by: @PROPERTIES CHRISTIE'S INTERNATIONAL REAL ESTATE $270,000Pending2 beds 2 baths1,632 sq. ft.
1221 E 53rd Street #1, Chicago, IL 60615
MLS# 12573155Listed by: KELLER WILLIAMS ONECHICAGO $109,900Active1 beds 1 baths522 sq. ft.
4800 S Chicago Beach Drive #2708S, Chicago, IL 60615
MLS# 12594470Listed by: KELLER WILLIAMS PREFERRED RLTY $275,000Pending3 beds 3 baths
5000 S Cornell Avenue #20A, Chicago, IL 60615
MLS# 12592212Listed by: ULTIMATE REALTY GROUP LLC $232,500Active3 beds 2 baths1,465 sq. ft.
5050 S East End Avenue #1E, Chicago, IL 60615
MLS# 12592977Listed by: PRIME TIME REALTY GROUP LLC $300,000Active3 beds 2 baths1,800 sq. ft.
1615 E Hyde Park Boulevard #2, Chicago, IL 60615
MLS# 12594132Listed by: @PROPERTIES CHRISTIE'S INTERNATIONAL REAL ESTATE $175,000Active2 beds 2 baths1,100 sq. ft.
5207 S Indiana Avenue #G, Chicago, IL 60615
MLS# 12593727Listed by: ENTERPRISE REALTY POWER BROKER $250,000Pending2 beds 2 baths936 sq. ft.
Address Withheld By Seller, Chicago, IL 60637
MLS# 12565744Listed by: COMPASS $165,000Active1 beds 1 baths
1400 E 55th Place #908S, Chicago, IL 60615
MLS# 12592685Listed by: ULTIMATE REALTY GROUP LLC $1,575,000Active7 beds 3 baths3,000 sq. ft.
5309 S Greenwood Avenue, Chicago, IL 60615
MLS# 12552059Listed by: BERKSHIRE HATHAWAY HOMESERVICES CHICAGO $170,000Pending2 beds 2 baths1,050 sq. ft.
1450 E 55th Place #720S, Chicago, IL 60637
MLS# 12591885Listed by: HOMETOWN REAL ESTATE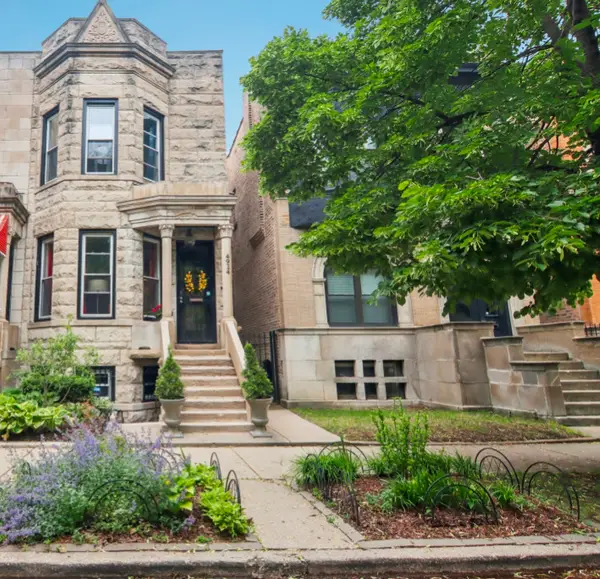 $660,000Active4 beds 4 baths3,000 sq. ft.
4914 S Washington Park Court, Chicago, IL 60615
MLS# 12591501Listed by: REDFIN CORPORATION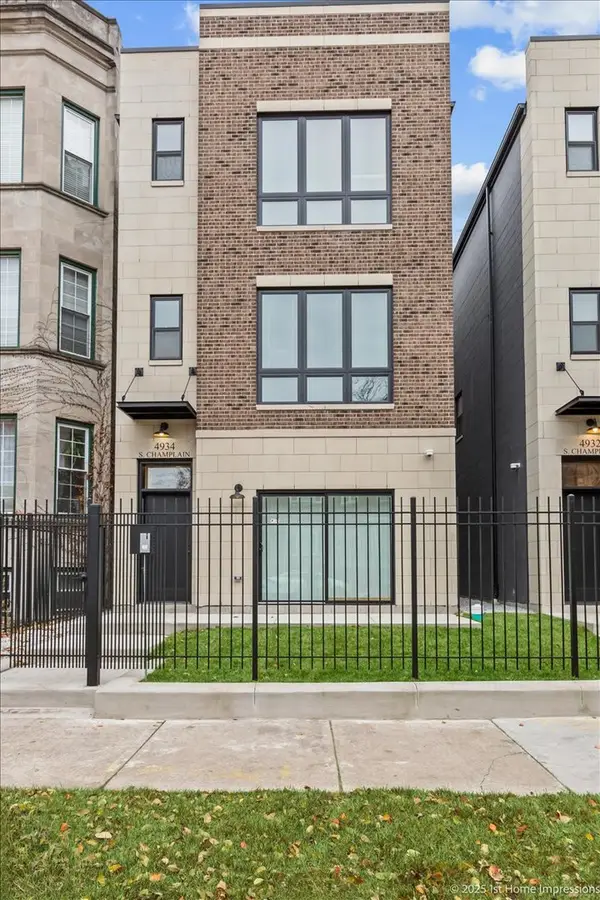 $1,199,000Pending9 beds 6 baths
4934 S Champlain Avenue, Chicago, IL 60615
MLS# 12591435Listed by: COMPASS $475,000Active3 beds 4 baths2,600 sq. ft.
840 E 52nd Street #1E, Chicago, IL 60615
MLS# 12591233Listed by: BAIRD & WARNER $140,000Active-- beds 1 baths
1400 E 55th Place #613S, Chicago, IL 60637
MLS# 12590919Listed by: HOMETOWN REAL ESTATE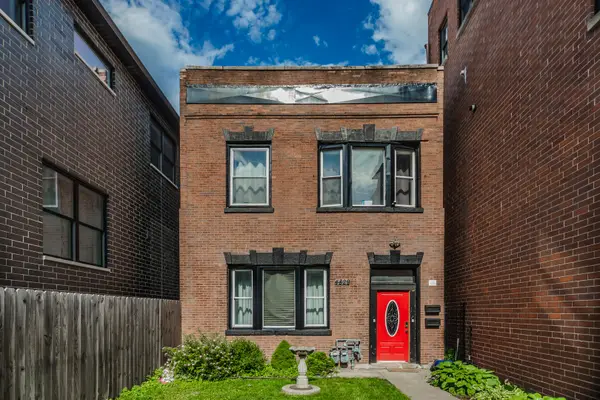 $500,000Active5 beds 2 baths
4829 S Champlain Avenue, Chicago, IL 60615
MLS# 12590468Listed by: BAIRD & WARNER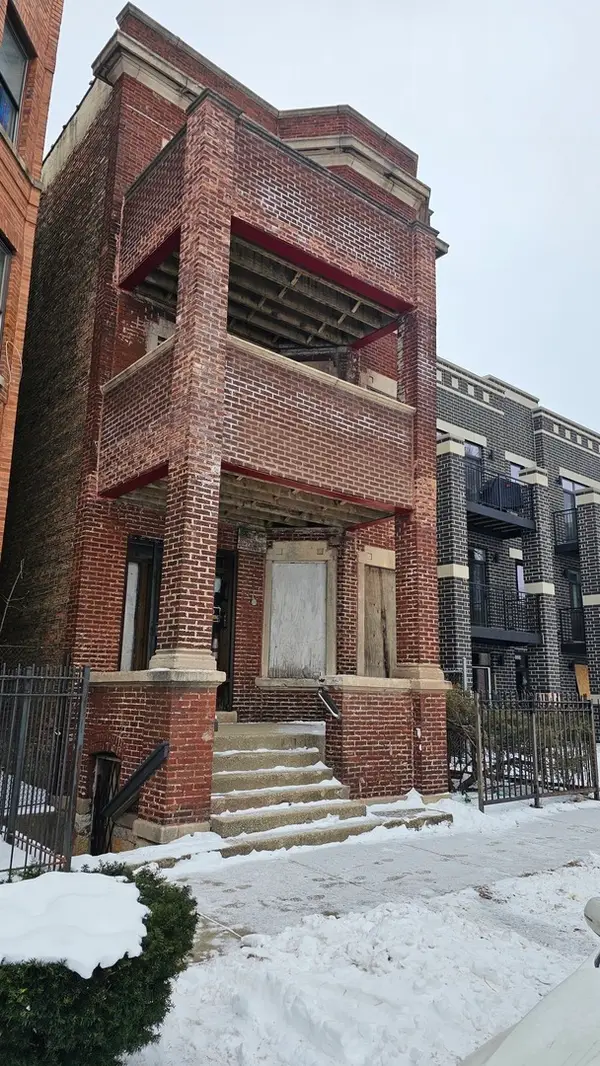 $525,000Active13 beds 6 baths
5319 S Calumet Avenue, Chicago, IL 60615
MLS# 12585191Listed by: GREEN BREEZE REALTY LLC $1,295,000Pending5 beds 4 baths3,460 sq. ft.
5029 S Dorchester Avenue, Chicago, IL 60615
MLS# 12579972Listed by: BERKSHIRE HATHAWAY HOMESERVICES CHICAGO- Open Sun, 1 to 2pm
 $175,000Active2 beds 2 baths1,600 sq. ft.
4837 S Forrestville Avenue #1, Chicago, IL 60615
MLS# 12586052Listed by: STRAIGHT-A REALTY, LLC  $1,199,000Pending9 beds 6 baths
4932 S Champlain Avenue, Chicago, IL 60615
MLS# 12587039Listed by: COMPASS $969,000Active9 beds 6 baths
5008 S Prairie Avenue, Chicago, IL 60615
MLS# 12586841Listed by: BAIRD & WARNER $299,999Active4 beds 2 baths
5135 S Kenwood Avenue #502, Chicago, IL 60615
MLS# 12585146Listed by: EXP REALTY $195,000Active2 beds 2 baths875 sq. ft.
1451 E 55th Street #430N, Chicago, IL 60615
MLS# 12585188Listed by: CONCENTRIC REALTY INC. $152,500Active1 beds 1 baths773 sq. ft.
4800 S Chicago Beach Drive #2611N, Chicago, IL 60615
MLS# 12569673Listed by: @PROPERTIES COMMERCIAL $390,000Active3 beds 2 baths2,000 sq. ft.
1354 E 48th Street #2E, Chicago, IL 60615
MLS# 12581893Listed by: JAMESON SOTHEBY'S INTL REALTY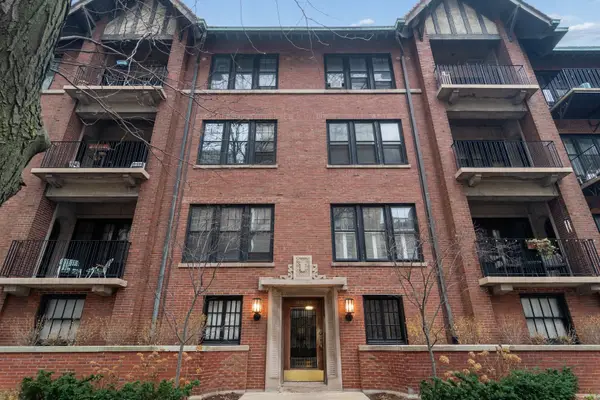 $135,000Pending1 beds 1 baths580 sq. ft.
1633 E Hyde Park Boulevard #3D, Chicago, IL 60615
MLS# 12583647Listed by: BAIRD & WARNER $229,750Active2 beds 1 baths1,200 sq. ft.
Address Withheld By Seller, Chicago, IL 60615
MLS# 12578041Listed by: KELLER WILLIAMS ONECHICAGO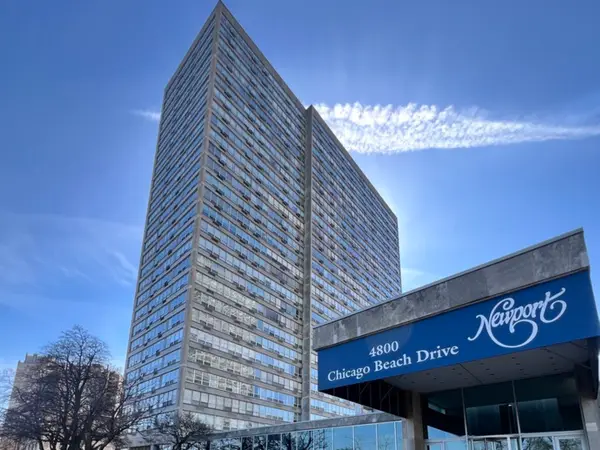 $240,000Active2 beds 2 baths1,200 sq. ft.
4800 S Chicago Beach Drive #2006S, Chicago, IL 60615
MLS# 12544488Listed by: COLDWELL BANKER REALTY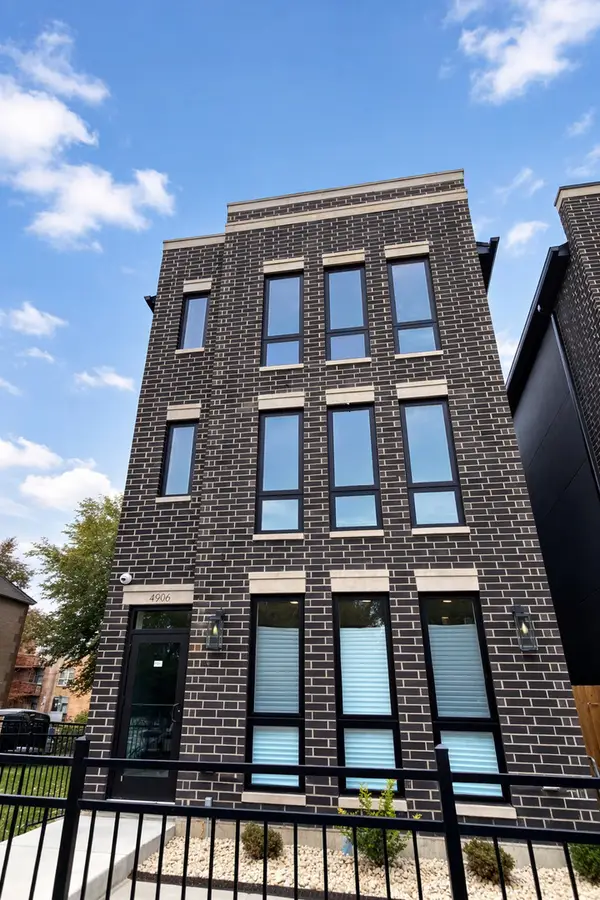 $1,200,000Active9 beds 6 baths
4906 S Saint Lawrence Avenue, Chicago, IL 60615
MLS# 12581757Listed by: EXP REALTY $1,199,900Active5 beds 5 baths5,080 sq. ft.
Address Withheld By Seller, Chicago, IL 60615
MLS# 12501118Listed by: @PROPERTIES CHRISTIE'S INTERNATIONAL REAL ESTATE $199,999Pending2 beds 2 baths1,500 sq. ft.
5471 S Hyde Park Boulevard #10A, Chicago, IL 60615
MLS# 12576468Listed by: BERKSHIRE HATHAWAY HOMESERVICES CHICAGO $925,000Active4 beds 3 baths2,931 sq. ft.
5428 S Blackstone Avenue, Chicago, IL 60615
MLS# 12559482Listed by: BAIRD & WARNER $825,000Active3 beds 3 baths1,881 sq. ft.
5114 S Kenwood Avenue #3B, Chicago, IL 60615
MLS# 12578358Listed by: @PROPERTIES CHRISTIE'S INTERNATIONAL REAL ESTATE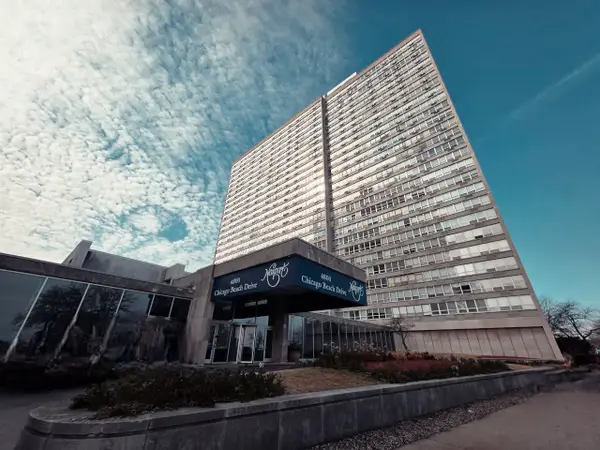 $139,500Active1 beds 1 baths734 sq. ft.
4800 S Chicago Beach Drive #810S, Chicago, IL 60615
MLS# 12577602Listed by: EXIT STRATEGY REALTY $1,000,000Active4 beds 4 baths2,403 sq. ft.
4721 S Ingleside Avenue, Chicago, IL 60615
MLS# 12568045Listed by: JAMESON SOTHEBY'S INTL REALTY $162,000Active1 beds 1 baths686 sq. ft.
5401 S Hyde Park Boulevard #1206, Chicago, IL 60615
MLS# 12527447Listed by: 11 ARROWS REALTY AND MANAGEMENT, LLC $2,895,000Active7 beds 7 baths7,000 sq. ft.
5235 S University Avenue, Chicago, IL 60615
MLS# 12575960Listed by: BERKSHIRE HATHAWAY HOMESERVICES CHICAGO $371,000Pending4 beds 4 baths3,151 sq. ft.
951 E Hyde Park Boulevard, Chicago, IL 60615
MLS# 12576290Listed by: REALHOME SERVICES & SOLUTIONS, INC.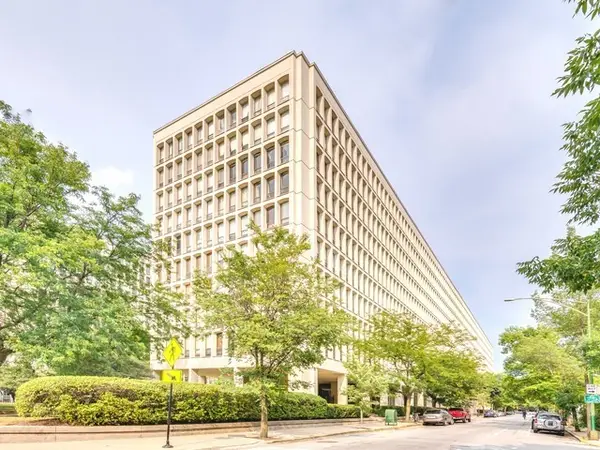 $155,000Active1 beds 1 baths
1400 E 55th Place #703S, Chicago, IL 60637
MLS# 12574097Listed by: ULTIMATE REALTY GROUP LLC- New
 $799,000Active4 beds 4 baths3,378 sq. ft.
5114 S Dorchester Avenue, Chicago, IL 60615
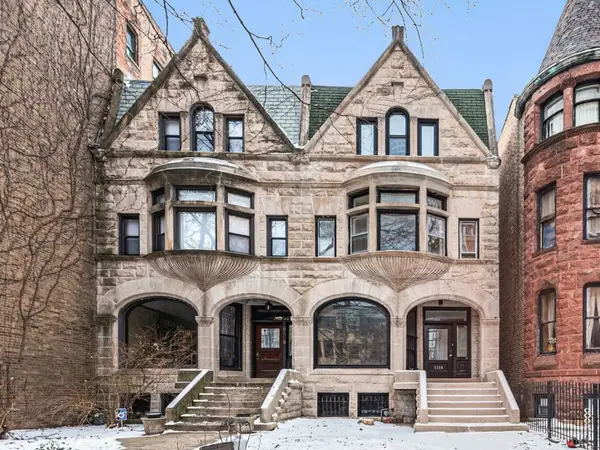
MLS# 12606442Listed by: KELLER WILLIAMS THRIVE 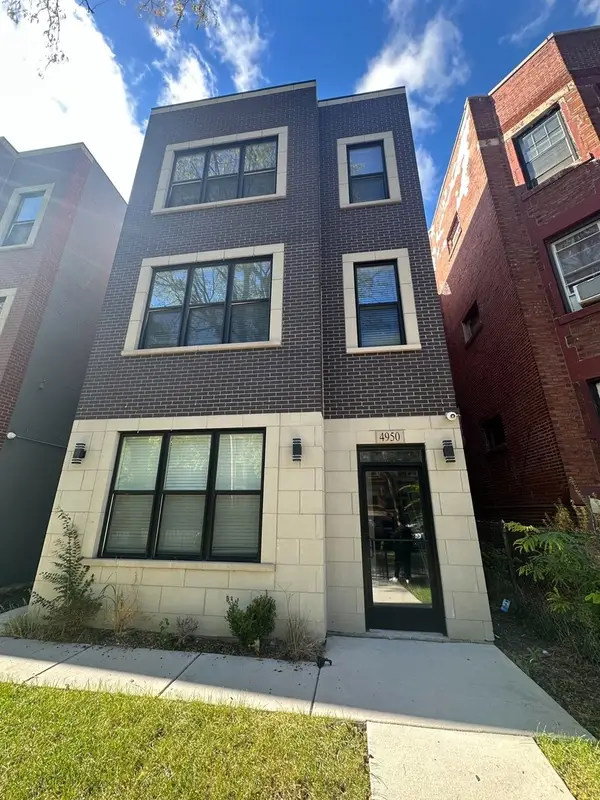 $1,200,000Active9 beds 6 baths
4950 S Michigan Avenue, Chicago, IL 60615
MLS# 12570137Listed by: HORVATH & TREMBLAY IL, LLC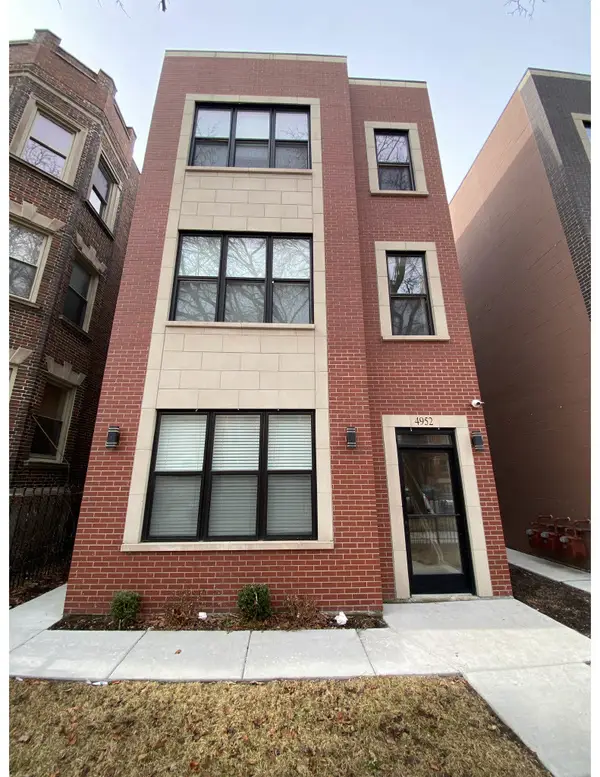 $1,200,000Active9 beds 6 baths
4952 S Michigan Avenue, Chicago, IL 60615
MLS# 12571108Listed by: HORVATH & TREMBLAY IL, LLC $325,000Active3 beds 2 baths1,850 sq. ft.
4730 S Drexel Avenue #3N, Chicago, IL 60615
MLS# 12571281Listed by: EXIT REALTY REDEFINED $729,000Pending4 beds 4 baths4,000 sq. ft.
4950 S Chicago Beach Drive #13A, Chicago, IL 60615
MLS# 12569097Listed by: BERKSHIRE HATHAWAY HOMESERVICES CHICAGO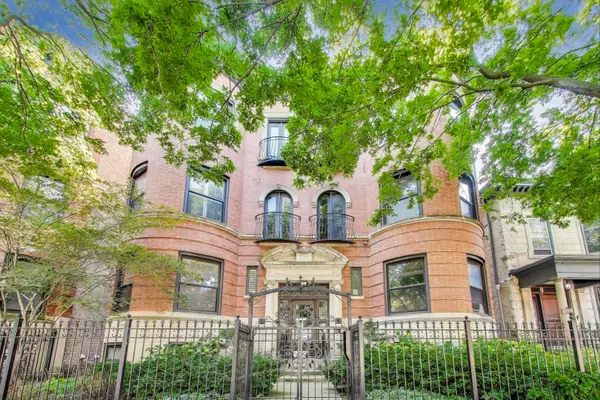 $285,000Active3 beds 2 baths1,597 sq. ft.
5014 S Blackstone Avenue #GN, Chicago, IL 60615
MLS# 12571775Listed by: @PROPERTIES CHRISTIE'S INTERNATIONAL REAL ESTATE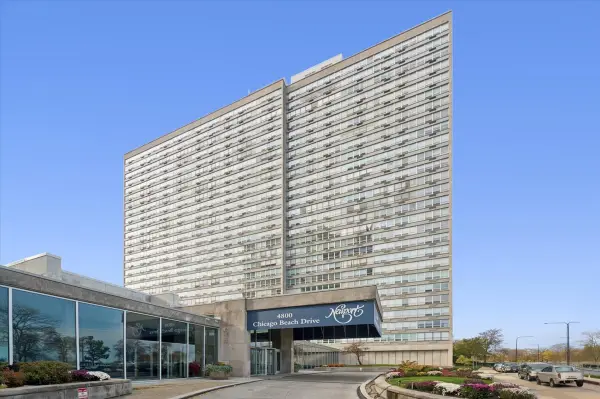 $225,000Pending2 beds 2 baths
4800 S Chicago Beach Drive #1407S, Chicago, IL 60615
MLS# 12595296Listed by: CAPTAIN REALTY LLC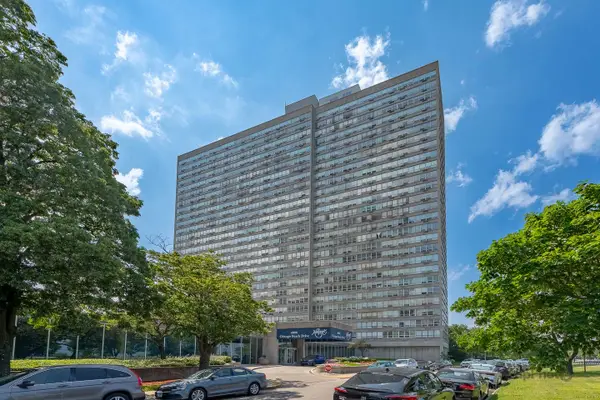 $129,000Active1 beds 1 baths800 sq. ft.
4800 S Chicago Beach Drive #2104S, Chicago, IL 60615
MLS# 12569841Listed by: CENTURY 21 S.G.R., INC.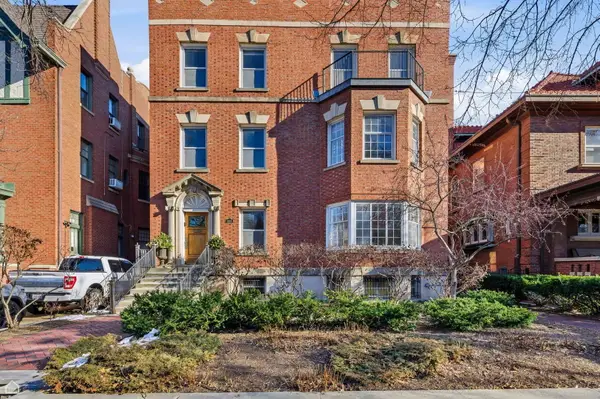 $2,900,000Active7 beds 5 baths7,500 sq. ft.
4933 S Woodlawn Avenue, Chicago, IL 60615
MLS# 12540892Listed by: BERKSHIRE HATHAWAY HOMESERVICES CHICAGO $149,900Active1 beds 1 baths
1450 E 55th Place #825S, Chicago, IL 60637
MLS# 12569357Listed by: CONCENTRIC REALTY INC. $147,500Active3 beds 2 baths1,454 sq. ft.
5050 S East End Avenue #9C, Chicago, IL 60615
MLS# 12565924Listed by: THE MARGIE SMIGEL GROUP, LLC $199,000Pending2 beds 1 baths
5400 S Harper Avenue #204, Chicago, IL 60615
MLS# 12566803Listed by: INTER PROPERTIES INC $875,000Active3 beds 3 baths1,881 sq. ft.
5114 S Kenwood Avenue #4B, Chicago, IL 60615
MLS# 12560594Listed by: @PROPERTIES CHRISTIE'S INTERNATIONAL REAL ESTATE $1,175,000Active4 beds 4 baths2,898 sq. ft.
836 E 52nd Street, Chicago, IL 60615
MLS# 12546280Listed by: RE/MAX PLAZA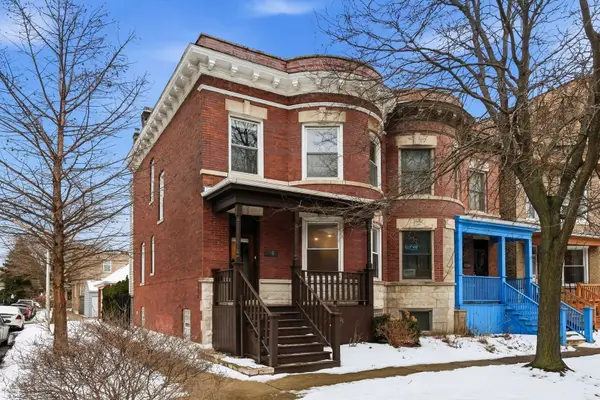 $730,000Active4 beds 3 baths2,400 sq. ft.
5401 S Maryland Avenue, Chicago, IL 60615
MLS# 12563563Listed by: BERKSHIRE HATHAWAY HOMESERVICES CHICAGO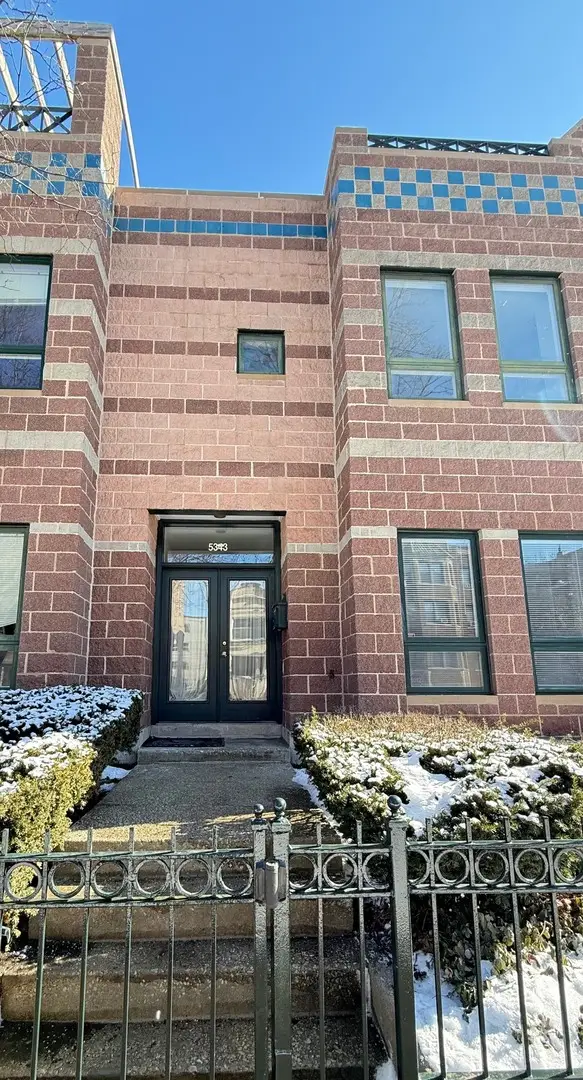 $575,000Pending3 beds 3 baths2,000 sq. ft.
5343 S Drexel Avenue, Chicago, IL 60615
MLS# 12564049Listed by: KALE REALTY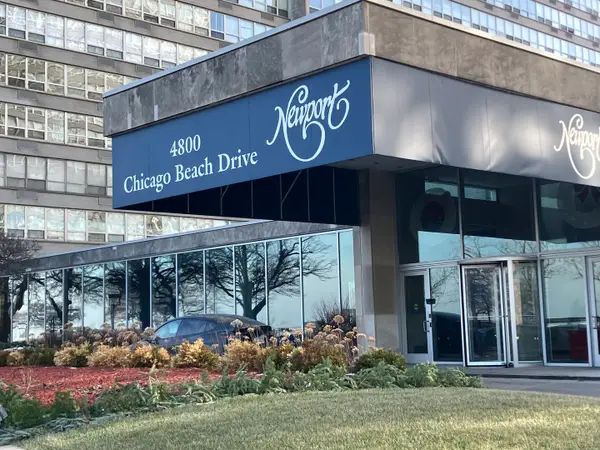 $150,000Active-- beds 1 baths550 sq. ft.
4800 S Chicago Beach Drive #908S, Chicago, IL 60615
MLS# 12561814Listed by: ENTERPRISE REALTY POWER BROKER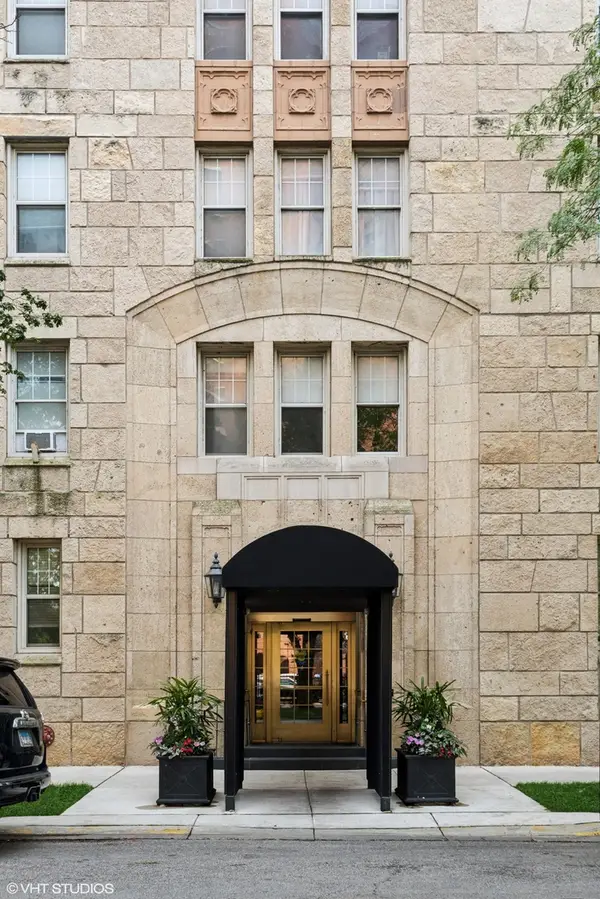 $235,500Active3 beds 3 baths1,927 sq. ft.
5000 S East End Avenue #23A, Chicago, IL 60615
MLS# 12561014Listed by: @PROPERTIES CHRISTIE'S INTERNATIONAL REAL ESTATE $139,900Active-- beds 1 baths
1401 E 55th Street #211N, Chicago, IL 60615
MLS# 12561248Listed by: GRANDVIEW REALTY, LLC $135,000Pending2 beds 1 baths1,190 sq. ft.
5050 S East End Avenue #7A, Chicago, IL 60615
MLS# 12561827Listed by: OPTION PREMIER LLC $300,000Active4 beds 4 baths4,197 sq. ft.
4950 S Chicago Beach Drive #4A, Chicago, IL 60615
MLS# 12559256Listed by: COLDWELL BANKER REALTY $550,000Active11 beds 3 baths
5134 S Indiana Avenue, Chicago, IL 60615
MLS# 12558337Listed by: GEE EXCLUSIVE REALTY GROUP $520,000Pending4 beds 4 baths2,600 sq. ft.
838 E 52nd Street #1W, Chicago, IL 60615
MLS# 12556195Listed by: BERKSHIRE HATHAWAY HOMESERVICES CHICAGO $789,000Pending2 beds 3 baths2,700 sq. ft.
4950 S Chicago Beach Drive #13B, Chicago, IL 60615
MLS# 12510146Listed by: BERKSHIRE HATHAWAY HOMESERVICES CHICAGO $200,000Active2 beds 1 baths1,450 sq. ft.
1360 E Madison Park #B, Chicago, IL 60615
MLS# 12556940Listed by: OPTION PREMIER LLC $699,900Active3 beds 3 baths1,600 sq. ft.
5401 S Hyde Park Boulevard #1502, Chicago, IL 60615
MLS# 12556043Listed by: CENTURY 21 S.G.R., INC. $180,000Pending2 beds 1 baths1,136 sq. ft.
5200 S Ellis Avenue #202, Chicago, IL 60615
MLS# 12553680Listed by: OLIVEROS REALTY COMPANY $550,000Active4 beds 3 baths2,500 sq. ft.
5121 S Kimbark Avenue #1E, Chicago, IL 60615
MLS# 12533298Listed by: @PROPERTIES CHRISTIE'S INTERNATIONAL REAL ESTATE $233,000Active2 beds 2 baths1,200 sq. ft.
5014 S King Drive #2E, Chicago, IL 60615
MLS# 12553046Listed by: FUQUA REAL ESTATE SERVICES LLC $265,000Pending2 beds 2 baths1,500 sq. ft.
4518 S Woodlawn Avenue, Chicago, IL 60615
MLS# 12551618Listed by: EXP REALTY $345,000Pending3 beds 2 baths1,600 sq. ft.
4800 S Chicago Beach Drive #2612S, Chicago, IL 60615
MLS# 12547458Listed by: RE/MAX PREMIER $245,000Pending2 beds 1 baths
5342 S Greenwood Avenue #3, Chicago, IL 60615
MLS# 12577054Listed by: ALLURE REAL ESTATE $199,000Active2 beds 2 baths1,200 sq. ft.
4800 S Chicago Beach Drive #2206S, Chicago, IL 60615
MLS# 12548657Listed by: PURVEY PROPERTIES, INC. $614,990Active5 beds 4 baths3,400 sq. ft.
5032 S Michigan Avenue, Chicago, IL 60615
MLS# 12548115Listed by: BLUE DOOR DAVE INC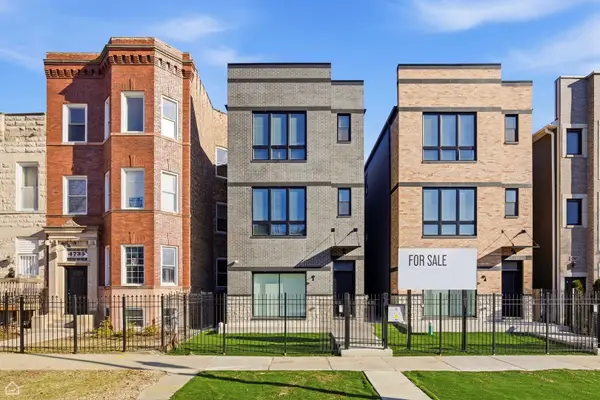 $1,199,000Active9 beds 6 baths
4739 S Indiana Avenue, Chicago, IL 60615
MLS# 12595635Listed by: NORTH CLYBOURN GROUP, INC.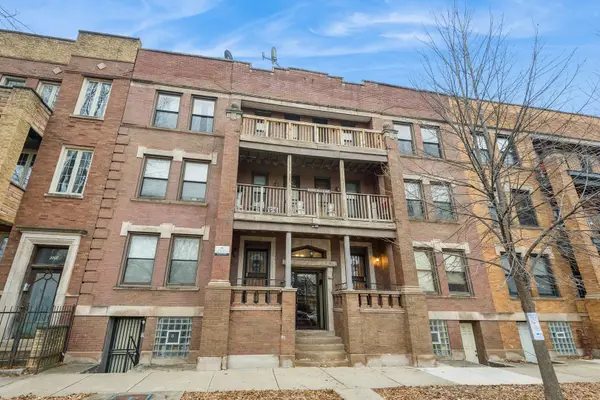 $175,000Active3 beds 2 baths2,200 sq. ft.
5014 S Prairie Avenue #1, Chicago, IL 60615
MLS# 12540481Listed by: JAMESON SOTHEBY'S INTL REALTY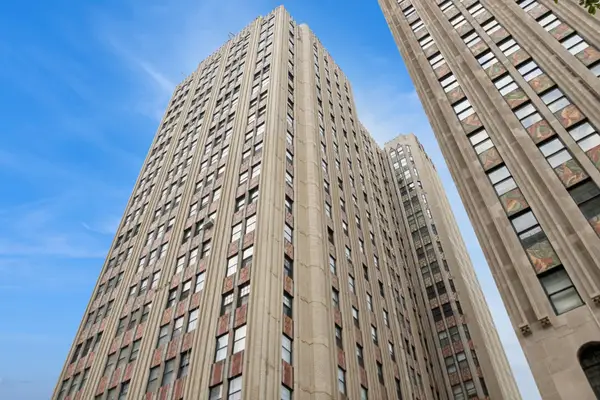 $301,000Active3 beds 3 baths2,200 sq. ft.
1640 E 50th Street #13B, Chicago, IL 60615
MLS# 12546060Listed by: BERKSHIRE HATHAWAY HOMESERVICES CHICAGO $99,000Pending2 beds 1 baths1,037 sq. ft.
829 E 48th Street #D, Chicago, IL 60615
MLS# 12544837Listed by: MCCOLLY REAL ESTATE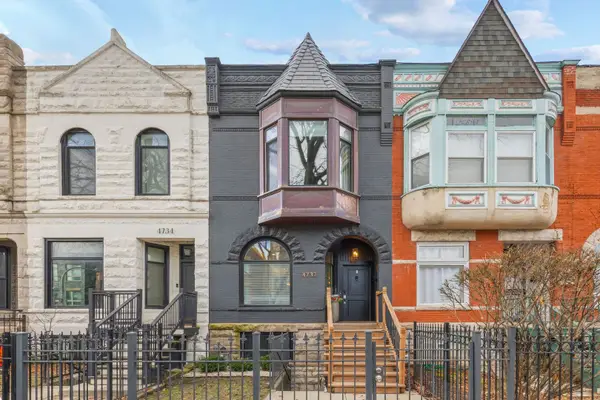 $663,900Pending4 beds 4 baths1,854 sq. ft.
4732 S Evans Avenue, Chicago, IL 60615
MLS# 12542359Listed by: REAL BROKER LLC $339,999Active4 beds 2 baths2,200 sq. ft.
5052 S Drexel Boulevard #3C, Chicago, IL 60615
MLS# 12543992Listed by: NORTHERN ILLINOIS REALTY GROUP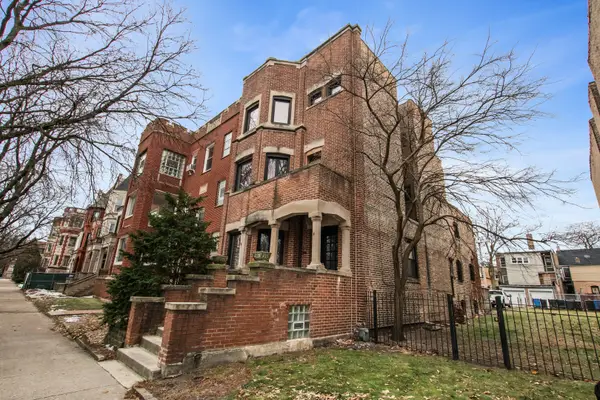 $1,200,000Active7 beds 5 baths6,000 sq. ft.
823 E Drexel Square, Chicago, IL 60615
MLS# 12444820Listed by: ENGEL & VOELKERS CHICAGO $144,900Active1 beds 1 baths850 sq. ft.
4800 S Chicago Beach Drive #804N, Chicago, IL 60615
MLS# 12541173Listed by: RE/MAX 10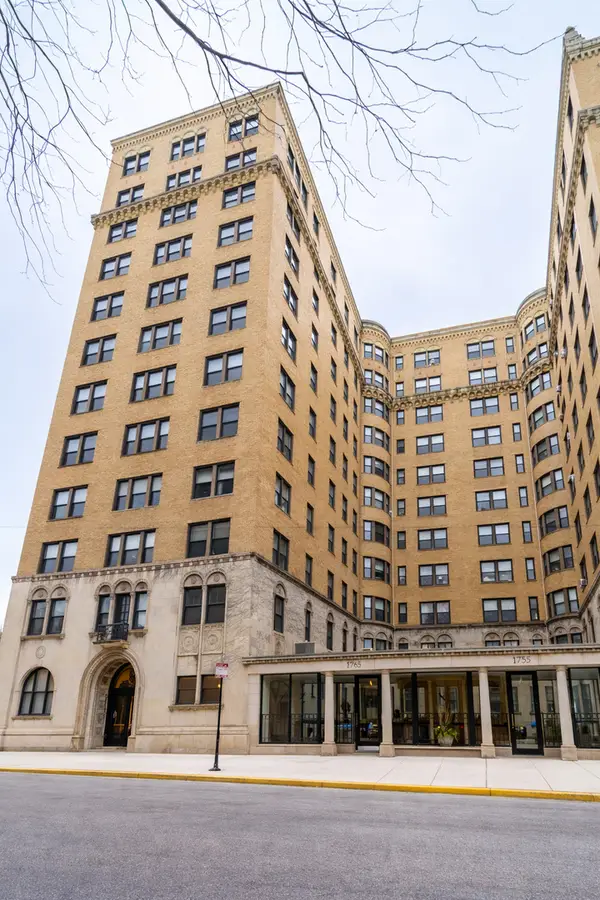 $109,000Active1 beds 1 baths1,050 sq. ft.
1765 E 55th Street #E1, Chicago, IL 60615
MLS# 12539512Listed by: INTER PROPERTIES INC $125,000Pending1 beds 1 baths800 sq. ft.
4800 S Chicago Beach Drive #1606N, Chicago, IL 60615
MLS# 12534689Listed by: PURVEY PROPERTIES, INC. $229,900Active3 beds 2 baths1,550 sq. ft.
5201 S Cornell Avenue #4B, Chicago, IL 60615
MLS# 12543525Listed by: GRANDVIEW REALTY, LLC $726,000Active6 beds 5 baths
5027 S Indiana Avenue, Chicago, IL 60615
MLS# 12535032Listed by: PEDESTAL REALTY LLC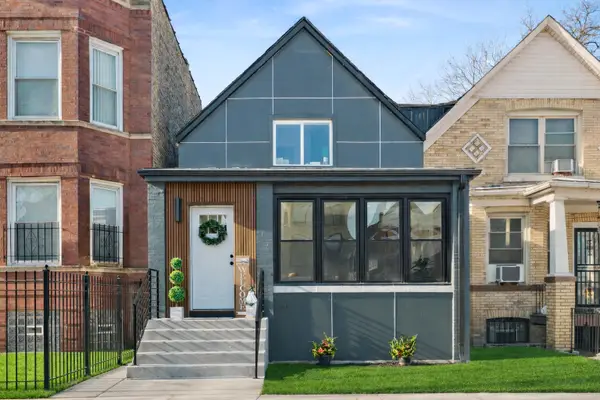 $434,900Active4 beds 3 baths2,094 sq. ft.
5168 S Wabash Avenue, Chicago, IL 60615
MLS# 12577905Listed by: BAIRD & WARNER $255,000Active2 beds 2 baths1,400 sq. ft.
4925 S Forrestville Avenue #3S, Chicago, IL 60615
MLS# 12533926Listed by: INFINITI PROPERTIES, INC. $110,000Pending1 beds 1 baths801 sq. ft.
4800 S Chicago Beach Drive #412N, Chicago, IL 60615
MLS# 12530366Listed by: @PROPERTIES CHRISTIE'S INTERNATIONAL REAL ESTATE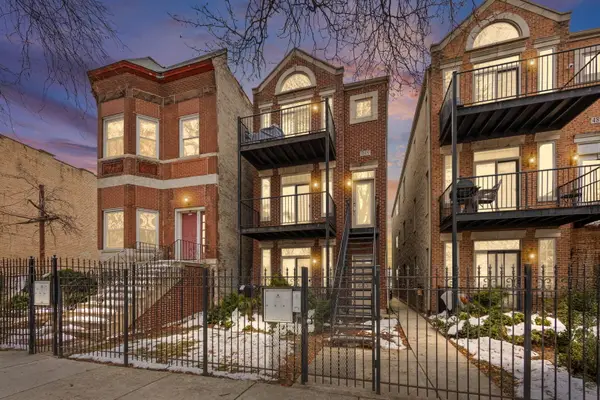 $269,000Active3 beds 2 baths1,300 sq. ft.
4809 S Wabash Avenue #1, Chicago, IL 60615
MLS# 12524994Listed by: EXP REALTY $270,000Pending3 beds 2 baths1,820 sq. ft.
4828 S Indiana Avenue #201, Chicago, IL 60615
MLS# 12531780Listed by: CENTURY 21 CIRCLE $207,500Active2 beds 2 baths1,000 sq. ft.
843 E 52nd Street #1, Chicago, IL 60615
MLS# 12587952Listed by: FROG CITY REALTY LLC $145,000Active1 beds 1 baths750 sq. ft.
1450 E 55th Street #923S, Chicago, IL 60615
MLS# 12592081Listed by: FROG CITY REALTY LLC $175,000Pending1 beds 1 baths773 sq. ft.
4800 S Chicago Beach Drive #503N, Chicago, IL 60615
MLS# 12552878Listed by: COMPASS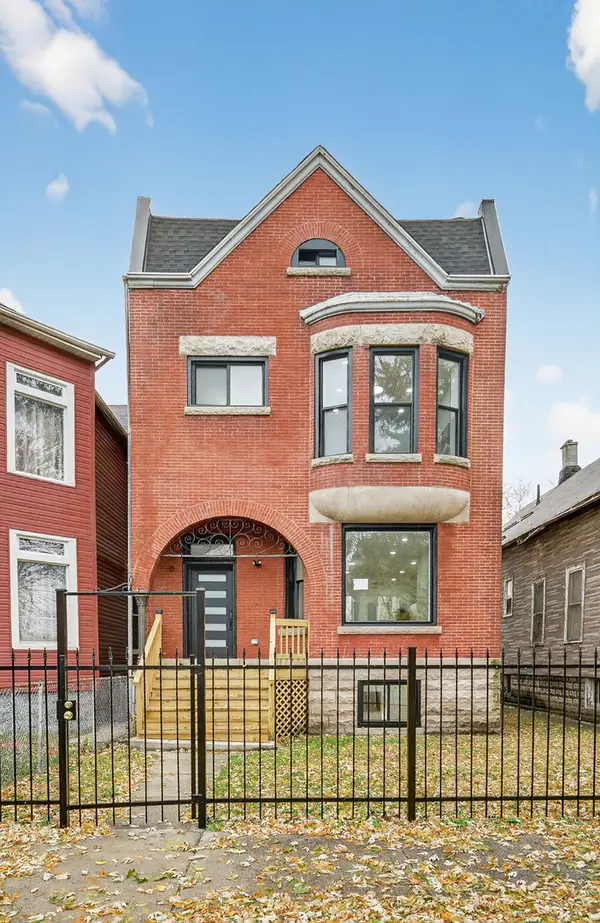 $605,000Pending4 beds 4 baths3,100 sq. ft.
5141 S Wabash Avenue, Chicago, IL 60615
MLS# 12399632Listed by: COLDWELL BANKER REALTY $420,000Pending6 beds 3 baths2,500 sq. ft.
4754 S Langley Avenue, Chicago, IL 60615
MLS# 12585962Listed by: FORTE PROPERTIES, INC.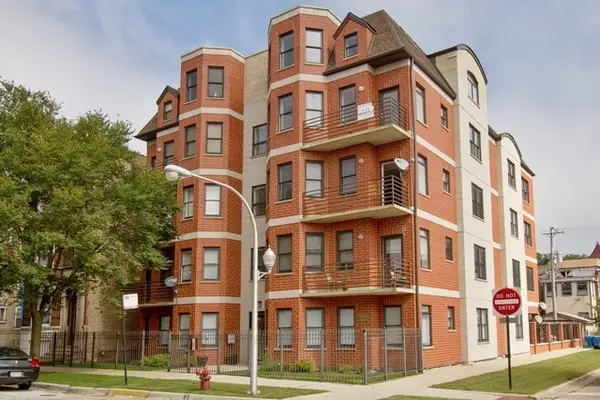 $245,000Active2 beds 2 baths
4755 S St Lawrence Avenue #B3, Chicago, IL 60615
MLS# 12582538Listed by: COLDWELL BANKER REALTY $770,000Pending12 beds 5 baths
5330 S Wabash Avenue, Chicago, IL 60615
MLS# 12520924Listed by: COMPASS $219,000Active3 beds 2 baths1,521 sq. ft.
5201 S Cornell Avenue #3E, Chicago, IL 60615
MLS# 12503035Listed by: BAIRD & WARNER $375,000Active4 beds 2 baths1,700 sq. ft.
1327 E 52nd Street #202, Chicago, IL 60615
MLS# 12517675Listed by: FOSTER & WILLIAMS REAL ESTATE $530,000Pending4 beds 3 baths2,700 sq. ft.
5400 S Hyde Park Boulevard #2C, Chicago, IL 60615
MLS# 12585169Listed by: JAMESON SOTHEBY'S INTL REALTY $595,000Pending6 beds 3 baths3,300 sq. ft.
Address Withheld By Seller, Chicago, IL 60615
MLS# 12510208Listed by: BERKSHIRE HATHAWAY HOMESERVICES CHICAGO $599,000Pending5 beds 3 baths
618 E 50th Place, Chicago, IL 60615
MLS# 12513345Listed by: CURRENT PROPERTIES LLC $1,395,000Pending9 beds 7 baths
4827 S Saint Lawrence Avenue, Chicago, IL 60615
MLS# 12484774Listed by: VILLAGE REALTY, INC. $37,500Pending2 beds 1 baths1,200 sq. ft.
4800 S Lake Park Avenue #1612, Chicago, IL 60615
MLS# 12509615Listed by: @PROPERTIES CHRISTIE'S INTERNATIONAL REAL ESTATE $1,250,000Pending10 beds 7 baths
4800 S Michigan Avenue, Chicago, IL 60615
MLS# 12509780Listed by: RE/MAX PREMIER LUXURY COLLECTION $119,000Active3 beds 3 baths1,710 sq. ft.
5140 S King Drive #A1, Chicago, IL 60615
MLS# 12498625Listed by: ARDAIN REAL ESTATE INC. $415,000Active5 beds 3 baths3,000 sq. ft.
4953 S Michigan Avenue #7, Chicago, IL 60615
MLS# 12504049Listed by: SIANA REALTY LLC $709,000Active3 beds 3 baths2,100 sq. ft.
5230 S University Avenue #D, Chicago, IL 60615
MLS# 12502223Listed by: @PROPERTIES CHRISTIE'S INTERNATIONAL REAL ESTATE $59,900Pending3 beds 2 baths1,400 sq. ft.
4850 S Lake Park Avenue #702B, Chicago, IL 60615
MLS# 12488616Listed by: UNITED REAL ESTATE-CHICAGO $325,000Active2 beds 1 baths1,315 sq. ft.
1424 E Hyde Park Boulevard #2, Chicago, IL 60615
MLS# 12494692Listed by: MELIORA REAL ESTATE GROUP LLC $625,000Pending4 beds 2 baths
1412 E Rochdale Place, Chicago, IL 60615
MLS# 12539091Listed by: ULTIMATE REALTY GROUP LLC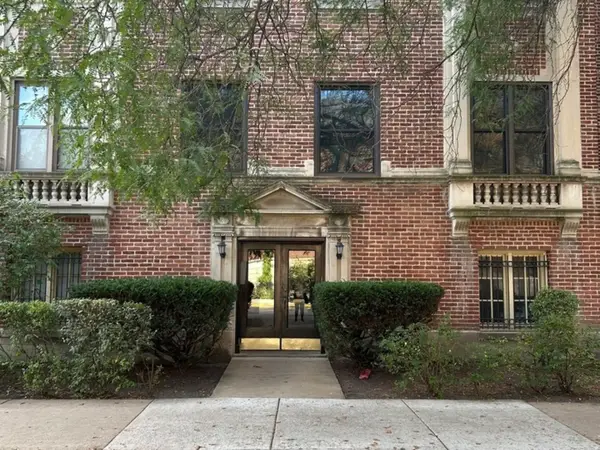 $230,000Active2 beds 1 baths1,200 sq. ft.
1155 E Hyde Park Boulevard #2F, Chicago, IL 60615
MLS# 12486034Listed by: BERKSHIRE HATHAWAY HOMESERVICES CHICAGO $125,000Pending2 beds 1 baths1,110 sq. ft.
5050 S East End Avenue #4B, Chicago, IL 60615
MLS# 12566699Listed by: THE MARGIE SMIGEL GROUP, LLC $99,900Pending1 beds 1 baths801 sq. ft.
4800 S Chicago Beach Drive #1202S, Chicago, IL 60615
MLS# 12480073Listed by: REDEFINED REAL ESTATE LLC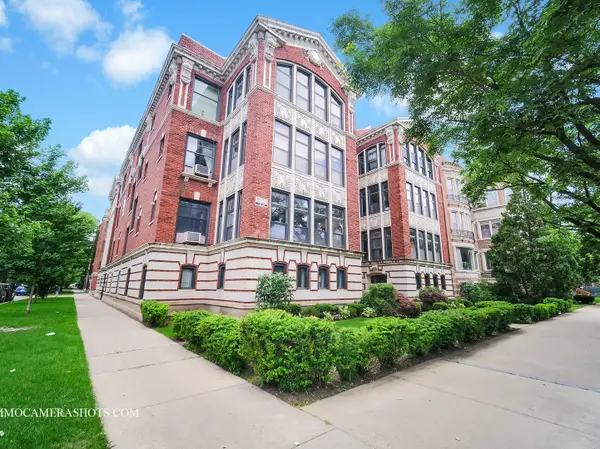 $319,000Active3 beds 2 baths1,500 sq. ft.
5132 S Drexel Avenue #2D, Chicago, IL 60615
MLS# 12474984Listed by: MARK ALLEN REALTY ERA POWERED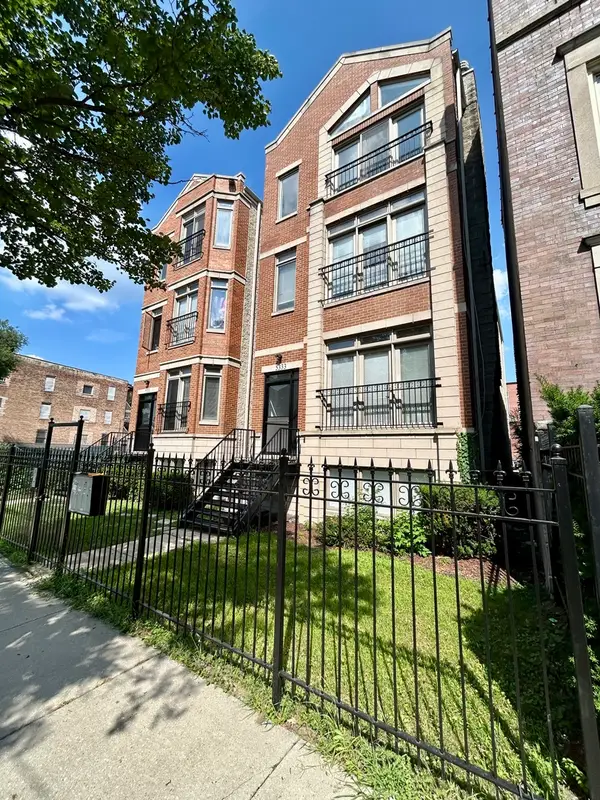 $1,025,000Active12 beds 8 baths
5333 S Calumet Avenue, Chicago, IL 60615
MLS# 12474522Listed by: 33 REALTY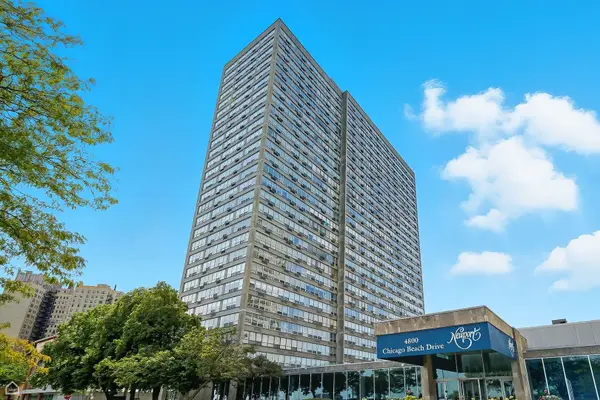 $112,000Pending-- beds 1 baths514 sq. ft.
4800 S Chicago Beach Drive #408S, Chicago, IL 60615
MLS# 12471364Listed by: BERKSHIRE HATHAWAY HOMESERVICES CHICAGO $149,999Active2 beds 1 baths800 sq. ft.
5004 S Champlain Avenue #1, Chicago, IL 60615
MLS# 12455146Listed by: DUARTE REALTY COMPANY $159,900Active2 beds 2 baths1,800 sq. ft.
1755 E 55th Street #301, Chicago, IL 60615
MLS# 12471114Listed by: BETTER HOMES FOR AMERICA, LLC $699,500Active9 beds 3 baths
5169 S Michigan Avenue, Chicago, IL 60615
MLS# 12547040Listed by: COMPASS $285,000Active3 beds 2 baths2,425 sq. ft.
1059 E Hyde Park Boulevard #1, Chicago, IL 60615
MLS# 12462762Listed by: @PROPERTIES CHRISTIE'S INTERNATIONAL REAL ESTATE $2,400,000Pending6 beds 6 baths4,200 sq. ft.
4730 S Greenwood Avenue, Chicago, IL 60615
MLS# 12541443Listed by: BERKSHIRE HATHAWAY HOMESERVICES CHICAGO $299,000Active3 beds 2 baths1,865 sq. ft.
5000 S East End Avenue #24A, Chicago, IL 60615
MLS# 12464413Listed by: CORE REALTY & INVESTMENTS INC. $166,000Active2 beds 1 baths1,037 sq. ft.
Address Withheld By Seller, Chicago, IL 60615
MLS# 12527926Listed by: CAROL A. HOLLAND $285,000Active4 beds 3 baths2,350 sq. ft.
5300 S Shore Drive #111, Chicago, IL 60615
MLS# 12459697Listed by: FULTON GRACE REALTY $220,000Pending2 beds 1 baths
5110 S Woodlawn Avenue #3H, Chicago, IL 60615
MLS# 12452295Listed by: @PROPERTIES CHRISTIE'S INTERNATIONAL REAL ESTATE $369,000Active4 beds 3 baths2,600 sq. ft.
4759 S Forrestville Avenue #1W, Chicago, IL 60615
MLS# 12575889Listed by: @PROPERTIES CHRISTIE'S INTERNATIONAL REAL ESTATE $525,000Pending4 beds 3 baths2,500 sq. ft.
4721 S Woodlawn Avenue #E, Chicago, IL 60615
MLS# 12412632Listed by: KM REALTY GROUP, LLC $228,000Active3 beds 2 baths1,280 sq. ft.
1451 E 55th Street #1030N, Chicago, IL 60615
MLS# 12402529Listed by: YOUMU VENTURES LLC $109,500Active2 beds 2 baths1,750 sq. ft.
1755 E 55th Street #503, Chicago, IL 60615
MLS# 12593117Listed by: COMPASS $445,000Active3 beds 2 baths1,600 sq. ft.
4730 S Champlain Avenue #3, Chicago, IL 60615
MLS# 12540527Listed by: CENTURY 21 IMPACT $200,000Active3 beds 3 baths1,850 sq. ft.
5000 S Cornell Avenue #3A, Chicago, IL 60615
MLS# 12444593Listed by: NEX-GEN REAL ESTATE & PROPERTY MANAGMENT CO. $265,000Pending3 beds 2 baths
4740 S Ingleside Avenue #2N, Chicago, IL 60615
MLS# 12369797Listed by: RE/MAX PREMIER $305,000Active3 beds 2 baths1,600 sq. ft.
Address Withheld By Seller, Chicago, IL 60615
MLS# 12568245Listed by: COMPASS $1,020,000Active12 beds 8 baths
5331 S Calumet Avenue, Chicago, IL 60615
MLS# 12277868Listed by: 33 REALTY $179,000Active1 beds 1 baths990 sq. ft.
4800 S Chicago Beach Drive #2611S, Chicago, IL 60615
MLS# 12319530Listed by: BERKSHIRE HATHAWAY HOMESERVICES CHICAGO $160,000Pending2 beds 1 baths800 sq. ft.
4939 S Dorchester Avenue #3H, Chicago, IL 60615
MLS# 12210116Listed by: KALE REALTY $298,000Active0 Acres
5424 S Ingleside Avenue, Chicago, IL 60615
MLS# 12543601Listed by: BERKSHIRE HATHAWAY HOMESERVICES CHICAGO $250,000Pending6 beds 3 baths3,600 sq. ft.
1356 E Hyde Park Boulevard #2, Chicago, IL 60615
MLS# 12120674Listed by: EXIT STRATEGY REALTY / EMA MANAGEMENT $230,000Active2 beds 1 baths1,100 sq. ft.
5455 S Ingleside Avenue #2W, Chicago, IL 60615
MLS# 12466740Listed by: BERKSHIRE HATHAWAY HOMESERVICES CHICAGO $15,000Active0 Acres
4832 S Indiana Avenue #G-28, Chicago, IL 60615
MLS# 11222831Listed by: LIFESTYLE PROPERTIES $650,000Active0.4 Acres
121 E 47th Street, Chicago, IL 60653
MLS# 11409973Listed by: PETER DROSSOS REAL ESTATE
Local realty services provided by:CENTURY 21 Broughton Team
Copyright 2026 Midwest Real Estate Data LLC. All rights reserved. The data relating to real estate for sale on this web site comes in part from the Broker Reciprocity Program of the Midwest Real Estate Data LLC. Listing information is deemed reliable but not guaranteed.
Popular searches near 60615
Popular neighborhoods near 60615
- Armour Square, Chicago homes for sale
- Bridgeport, Chicago homes for sale
- Bronzeville, Chicago homes for sale
- Canaryville, Chicago homes for sale
- Chinatown, Chicago homes for sale
- Douglas, Chicago homes for sale
- Englewood, Chicago homes for sale
- Fuller Park, Chicago homes for sale
- Grand Boulevard, Chicago homes for sale
- Grand Crossing, Chicago homes for sale
- Hyde Park, Chicago homes for sale
- Kenwood, Chicago homes for sale
- New City, Chicago homes for sale
- North Kenwood, Chicago homes for sale
- Oakland, Chicago homes for sale
- South Commons, Chicago homes for sale
- South Shore, Chicago homes for sale
- South Side, Chicago homes for sale
- Washington Park, Chicago homes for sale
- Woodlawn, Chicago homes for sale
Counties near Chicago, 60615
- Berrien County homes for sale
- Cook County homes for sale
- DeKalb County homes for sale
- DuPage County homes for sale
- Grundy County homes for sale
- Jasper County homes for sale
- Kane County homes for sale
- Kankakee County homes for sale
- Kendall County homes for sale
- Kenosha County homes for sale
- Lake County homes for sale
- Lake County homes for sale
- LaPorte County homes for sale
- McHenry County homes for sale
- Newton County homes for sale
- Porter County homes for sale
- Racine County homes for sale
- Starke County homes for sale
- Van Buren County homes for sale
- Will County homes for sale
Protect your home and budget from life's surprises with an Assurant Home Warranty, backed by a partner that supports you through every step of homeownership. Explore Plans.
©2026 Century 21 Real Estate LLC. All rights reserved. CENTURY 21®, the CENTURY 21 Logo and C21® are service marks owned by Century 21 Real Estate LLC. Century 21 Real Estate LLC fully supports the principles of the Fair Housing Act and the Equal Opportunity Act. Each office is independently owned and operated. Listing information is deemed reliable but not guaranteed accurate.