- Blue Island homes for sale
- Burnham homes for sale
- Calumet homes for sale
- Calumet City homes for sale
- Calumet Park homes for sale
- Dixmoor homes for sale
- Dolton homes for sale
- East Chicago homes for sale
- Evergreen Park homes for sale
- Hammond homes for sale
- Harvey homes for sale
- Merrionette Park homes for sale
- North homes for sale
- Phoenix homes for sale
- Posen homes for sale
- Riverdale homes for sale
- Robbins homes for sale
- South Holland homes for sale
- Thornton Township homes for sale
- Whiting homes for sale
60617, IL - homes for sale
262 of 262 results displayed
- New
 $319,000Active2 beds 3 baths
2711 E 93rd Street, Chicago, IL 60617
MLS# 12673343Listed by: EXIT STRATEGY REALTY / EMA MANAGEMENT
- New
 $300,000Active4 beds 3 baths1,668 sq. ft.
8218 S Yates Boulevard, Chicago, IL 60617
MLS# 12672103Listed by: COLDWELL BANKER REALTY - New
 $499,900Active4 beds 4 baths2,239 sq. ft.
8645 S Bennett Avenue, Chicago, IL 60617
MLS# 12577748Listed by: HOMESMART REALTY GROUP - New
 $99,900Active3 beds 1 baths1,070 sq. ft.
7955 S Ridgeland Avenue, Chicago, IL 60617
MLS# 12671699Listed by: RE/MAX PREMIER - New
 $329,000Active5 beds 3 baths1,400 sq. ft.
1651 E 91st Street, Chicago, IL 60617
MLS# 12669132Listed by: SAFE HARBOR REALTY LLC  $260,000Pending6 beds 2 baths
8739 S Colfax Avenue, Chicago, IL 60617
MLS# 12656876Listed by: A&O DREAM KEY REAL ESTATE- New
 $399,900Active12 beds 5 baths
8239 S Colfax Avenue, Chicago, IL 60617
MLS# 12669970Listed by: RE/MAX MI CASA - Open Sat, 11am to 1pmNew
 $318,800Active5 beds 2 baths2,284 sq. ft.
8014 S Yates Boulevard, Chicago, IL 60617
MLS# 12668964Listed by: REALTY EXECUTIVES NEW IMAGE - New
 $328,000Active3 beds 3 baths2,000 sq. ft.
8848 S Jeffery Boulevard, Chicago, IL 60617
MLS# 12665053Listed by: RE/MAX PREMIER - New
 $15,000Active0 Acres
10200 S Torrence Avenue, Chicago, IL 60617
MLS# 12650367Listed by: KELLER WILLIAMS PREFERRED REALTY - New

 $224,900Active3 beds 2 baths1,334 sq. ft.
7949 S Manistee Avenue, Chicago, IL 60617
MLS# 12666824Listed by: CENTURY 21 S.G.R., INC. - New
 $397,700Active10 beds 3 baths2,064 sq. ft.
8030 S Constance Avenue, Chicago, IL 60617
MLS# 12661122Listed by: KELLER WILLIAMS THRIVE - New
 $79,000Active2 beds 1 baths973 sq. ft.
9846 S Calhoun Avenue, Chicago, IL 60617
MLS# 12667895Listed by: CIRCLE ONE REALTY  $130,000Pending3 beds 1 baths550 sq. ft.
8721 S Constance Avenue, Chicago, IL 60617
MLS# 12663597Listed by: REAL PEOPLE REALTY- New
 $150,000Active5 beds 2 baths1,080 sq. ft.
8106 S Burnham Avenue, Chicago, IL 60617
MLS# 12609762Listed by: FORD DESIRED REAL ESTATE LLC - New
 $249,999Active5 beds 2 baths3,062 sq. ft.
8136 S Luella Avenue, Chicago, IL 60617
MLS# 12667496Listed by: DELTA REALTY, CORP. 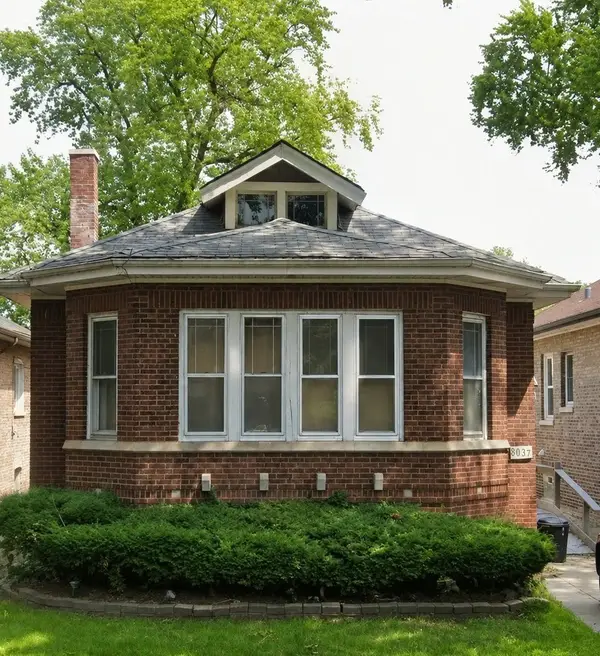 $123,000Pending3 beds 1 baths1,442 sq. ft.
8037 S Paxton Avenue, Chicago, IL 60617
MLS# 12657970Listed by: KELLER WILLIAMS PREFERRED RLTY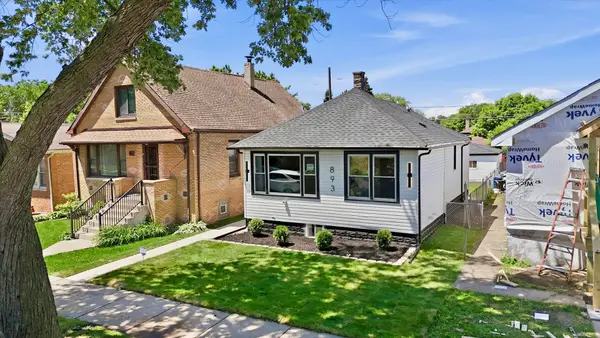 $259,900Pending3 beds 2 baths1,200 sq. ft.
8934 S Euclid Avenue, Chicago, IL 60617
MLS# 12667043Listed by: FINISH LINE REALTY , INC.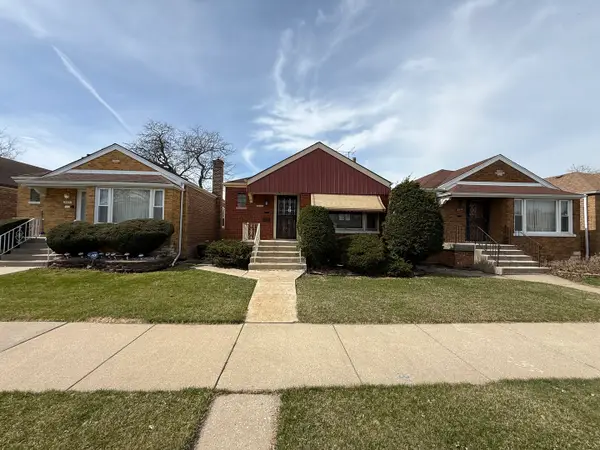 $140,000Pending2 beds 1 baths979 sq. ft.
8842 S Cregier Avenue, Chicago, IL 60617
MLS# 12667168Listed by: PREMIER MIDWEST REALTY, INC- New
 $0Active4 beds 2 baths1,158 sq. ft.
8349 S Essex Avenue, Chicago, IL 60617
MLS# 12667171Listed by: AREA WIDE REALTY - New
 $0Active3 beds 1 baths1,134 sq. ft.
8528 S Escanaba Avenue, Chicago, IL 60617
MLS# 12667379Listed by: PARKVUE REALTY CORPORATION 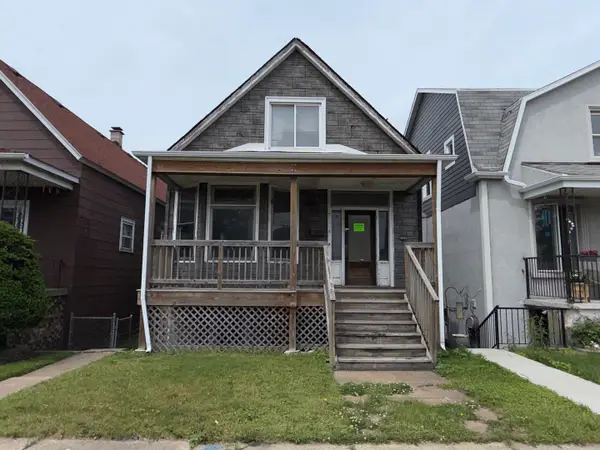 $89,000Pending3 beds 1 baths1,122 sq. ft.
10606 S Avenue G, Chicago, IL 60617
MLS# 12665963Listed by: MCSULLY PROPERTIES LLC- New
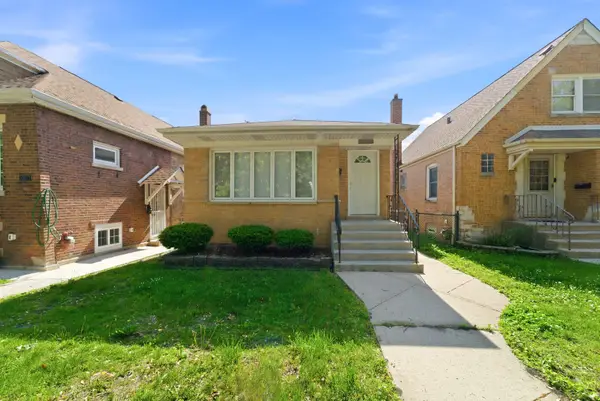 $294,900Active3 beds 2 baths1,400 sq. ft.
10817 S Avenue G, Chicago, IL 60617
MLS# 12666829Listed by: BLOOM/SANCHEZ REALTY, INC. - New
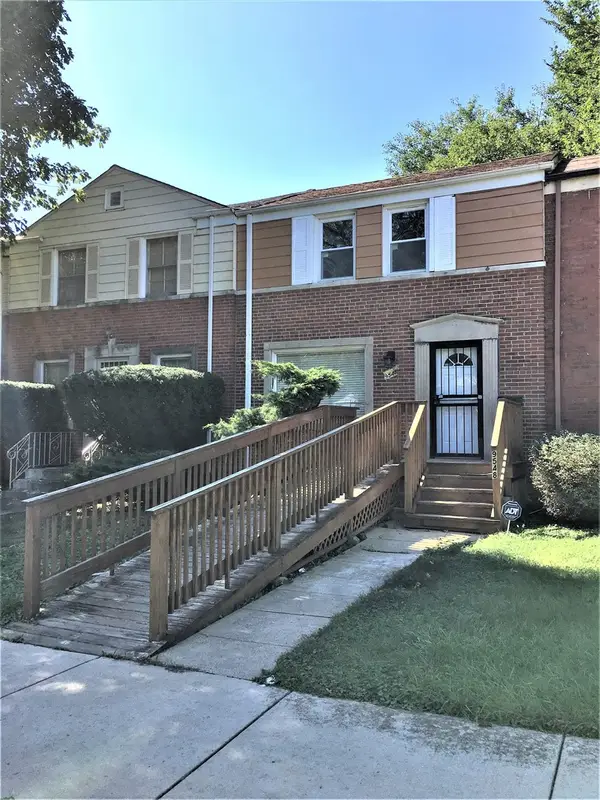 $110,000Active2 beds 2 baths946 sq. ft.
9548 S Euclid Avenue, Chicago, IL 60617
MLS# 12666224Listed by: EXP REALTY - New
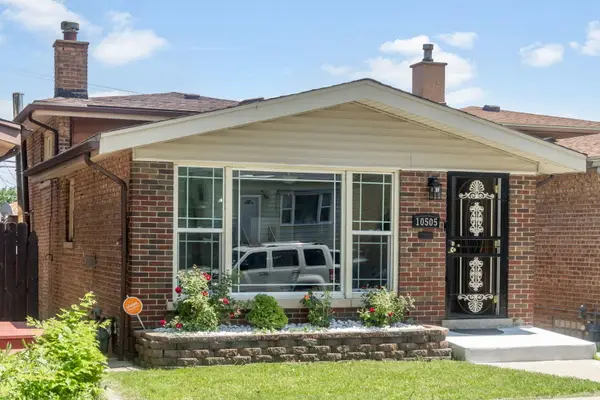 $307,500Active4 beds 2 baths1,200 sq. ft.
10505 S Avenue F, Chicago, IL 60617
MLS# 12661305Listed by: BERKSHIRE HATHAWAY HOMESERVICES STARCK REAL ESTATE - New
 $319,000Active11 beds 3 baths
8942 S Baltimore Avenue, Chicago, IL 60617
MLS# 12665697Listed by: REALTY OF AMERICA, LLC - New
 $249,900Active3 beds 2 baths1,248 sq. ft.
8745 S Euclid Avenue, Chicago, IL 60617
MLS# 12662038Listed by: ADEL PROPERTIES INC - New
 $460,000Active10 beds 3 baths
3056 E 87th Street, Chicago, IL 60617
MLS# 12664875Listed by: YUB REALTY INC - New
 $280,000Active6 beds 2 baths1,310 sq. ft.
10134 S Bensley Avenue, Chicago, IL 60617
MLS# 12664904Listed by: INTER-CITY REALTY, INC. - New
 $289,900Active4 beds 2 baths1,186 sq. ft.
3506 E 114th Street, Chicago, IL 60617
MLS# 12664006Listed by: TABS REALTY GROUP LLC - New
 $290,000Active4 beds 3 baths1,700 sq. ft.
8434 S Yates Boulevard, Chicago, IL 60617
MLS# 12654605Listed by: ONE STOP REAL ESTATE SERVICES - New
 $110,000Active2 beds 1 baths956 sq. ft.
9815 S Clyde Avenue, Chicago, IL 60617
MLS# 12663219Listed by: EXIT STRATEGY REALTY  $225,000Active3 beds 2 baths1,870 sq. ft.
10939 S Avenue F, Chicago, IL 60617
MLS# 12660041Listed by: EXP REALTY $64,900Active4 beds 3 baths
10029 S Exchange Avenue, Chicago, IL 60617
MLS# 12626866Listed by: SR REALTY GROUP INC. $125,000Active5 beds 2 baths
8549 S Kingston Avenue, Chicago, IL 60617
MLS# 12660752Listed by: TADD REALTY $225,000Pending3 beds 2 baths1,450 sq. ft.
11035 S Avenue E, Chicago, IL 60617
MLS# 12659124Listed by: REAL BROKER LLC $199,900Active3 beds 2 baths1,024 sq. ft.
8319 S Crandon Avenue, Chicago, IL 60617
MLS# 12660337Listed by: EXP REALTY $275,000Active8 beds 3 baths
8112 S Exchange Avenue, Chicago, IL 60617
MLS# 12631803Listed by: TOP CARE REALTY LLC $599,900Active8 beds 4 baths
8153 S South Shore Drive, Chicago, IL 60617
MLS# 12659952Listed by: CONSUMER REALTY GROUP, INC. $277,900Active5 beds 2 baths1,808 sq. ft.
8613 S Colfax Avenue, Chicago, IL 60617
MLS# 12660274Listed by: PROSALES REALTY $175,000Active4 beds 2 baths1,414 sq. ft.
10066 S Van Vlissingen Road, Chicago, IL 60617
MLS# 12657088Listed by: KELLER WILLIAMS ONECHICAGO $269,900Active3 beds 2 baths1,066 sq. ft.
10933 S Avenue F, Chicago, IL 60617
MLS# 12655310Listed by: TRADEMARKS & ASSOCIATES $275,000Pending4 beds 2 baths
9023 S Oglesby Avenue, Chicago, IL 60617
MLS# 12658068Listed by: KELLER WILLIAMS ONECHICAGO $259,900Active3 beds 2 baths1,152 sq. ft.
10055 S Oglesby Avenue, Chicago, IL 60617
MLS# 12618735Listed by: CONCENTRIC REALTY, INC $419,900Pending6 beds 3 baths4,868 sq. ft.
8015 S Paxton Avenue, Chicago, IL 60617
MLS# 12633150Listed by: ENTERPRISE REALTY POWER BROKER $314,900Pending9 beds 3 baths
3221 E 91st Street, Chicago, IL 60617
MLS# 12655128Listed by: LOOP REALTY FIRM $599,000Active0 Acres
8249 S Stony Island Avenue, Chicago, IL 60617
MLS# 12655741Listed by: LUXE GROUP REAL ESTATE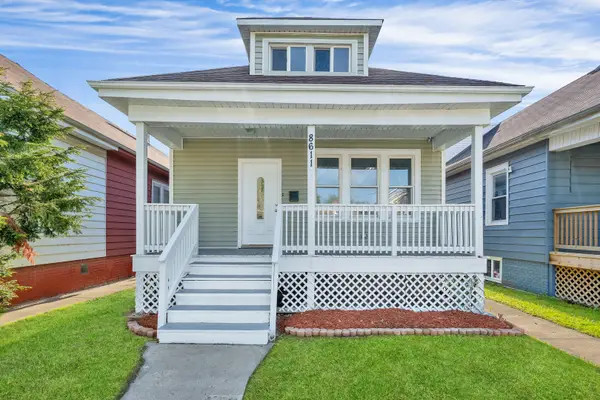 $249,900Pending5 beds 3 baths1,800 sq. ft.
8611 S Kingston Avenue, Chicago, IL 60617
MLS# 12656374Listed by: RE/MAX MI CASA $395,000Active6 beds 3 baths2,016 sq. ft.
7948 S Colfax Avenue, Chicago, IL 60649
MLS# 12630283Listed by: HOMESMART CONNECT LLC $299,900Active3 beds 3 baths1,500 sq. ft.
11003 S Avenue E, Chicago, IL 60617
MLS# 12655922Listed by: HOMESMART REALTY GROUP $205,500Pending3 beds 2 baths1,000 sq. ft.
9720 S Yates Avenue #1, Chicago, IL 60617
MLS# 12642162Listed by: CHICAGOLAND BROKERS INC. $275,000Active4 beds 2 baths2,260 sq. ft.
10240 S Torrence Avenue, Chicago, IL 60617
MLS# 12655481Listed by: GUTMAN REAL ESTATE $249,000Active3 beds 2 baths1,849 sq. ft.
8023 S Yates Boulevard, Chicago, IL 60617
MLS# 12654970Listed by: PEARSON REALTY GROUP $349,000Pending9 beds 3 baths
7952 S Marquette Avenue, Chicago, IL 60617
MLS# 12653026Listed by: SU FAMILIA REAL ESTATE INC $194,000Pending3 beds 2 baths1,313 sq. ft.
8917 S Ridgeland Avenue, Chicago, IL 60617
MLS# 12652551Listed by: KELLER WILLIAMS PREFERRED RLTY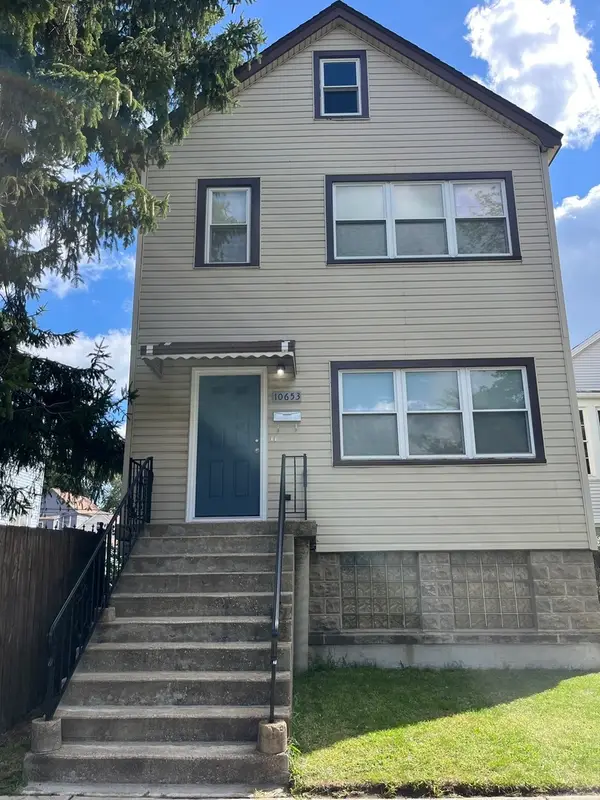 $379,000Active4 beds 2 baths
10653 S Mackinaw Avenue, Chicago, IL 60617
MLS# 12653492Listed by: CHICAGOLAND BROKERS, INC. $0Active6 beds 2 baths
8047 S Houston Avenue, Chicago, IL 60617
MLS# 12255961Listed by: PARKVUE REALTY CORPORATION $0Active3 beds 2 baths851 sq. ft.
8548 S Colfax Avenue, Chicago, IL 60617
MLS# 12346035Listed by: PARKVUE REALTY CORPORATION $0Active3 beds 2 baths1,300 sq. ft.
9035 S Oglesby Avenue, Chicago, IL 60617
MLS# 12613641Listed by: PARKVUE REALTY CORPORATION $0Active5 beds 2 baths864 sq. ft.
9141 S Colfax Avenue, Chicago, IL 60617
MLS# 12640601Listed by: PARKVUE REALTY CORPORATION $0Active4 beds 2 baths1,296 sq. ft.
8035 S Oglesby Avenue, Chicago, IL 60617
MLS# 12642138Listed by: PARKVUE REALTY CORPORATION $389,900Pending9 beds 3 baths
9637 S Avenue M, Chicago, IL 60617
MLS# 12652211Listed by: BLOOM/SANCHEZ REALTY, INC. $124,900Pending3 beds 2 baths1,268 sq. ft.
9058 S Jeffery Boulevard, Chicago, IL 60617
MLS# 12651149Listed by: CITYWIDE REALTY LLC $411,000Active4 beds 2 baths2,317 sq. ft.
9055 S Luella Avenue, Chicago, IL 60617
MLS# 12651737Listed by: CENTURY 21 UNIVERSAL $195,000Active5 beds 2 baths
9014 S Escanaba Avenue, Chicago, IL 60617
MLS# 12650231Listed by: NEW CHAPTER REAL ESTATE $284,900Active5 beds 2 baths1,040 sq. ft.
8051 S Escanaba Avenue, Chicago, IL 60617
MLS# 12643731Listed by: REALTY OF AMERICA, LLC $319,900Pending5 beds 3 baths2,680 sq. ft.
8042 S Bennett Avenue, Chicago, IL 60617
MLS# 12649720Listed by: KALE REALTY $174,900Active5 beds 3 baths1,800 sq. ft.
8443 S Manistee Avenue, Chicago, IL 60617
MLS# 12649255Listed by: EXIT STRATEGY REALTY $229,900Pending5 beds 2 baths2,600 sq. ft.
10441 S Avenue H Avenue, Chicago, IL 60617
MLS# 12639187Listed by: EQUITY REALTY $139,000Pending2 beds 1 baths1,008 sq. ft.
8129 S Cornell Avenue, Chicago, IL 60617
MLS# 12648716Listed by: RE/MAX IN THE VILLAGE $99,700Pending5 beds 2 baths2,132 sq. ft.
8906 S Mackinaw Street, Chicago, IL 60617
MLS# 12646233Listed by: KELLER WILLIAMS THRIVE $19,900Pending0.07 Acres
8323 S Buffalo Avenue, Chicago, IL 60617
MLS# 12647118Listed by: EXIT REALTY REDEFINED $130,000Active3 beds 2 baths1,441 sq. ft.
8008 S Ridgeland Avenue #2A, Chicago, IL 60617
MLS# 12645103Listed by: CENTURY 21 UNIVERSAL $19,900Pending0.07 Acres
8547 S Mackinaw Avenue, Chicago, IL 60617
MLS# 12647031Listed by: EXIT REALTY REDEFINED $309,000Pending7 beds 4 baths
10440 S Torrence Avenue, Chicago, IL 60617
MLS# 12646517Listed by: COLDWELL BANKER REALTY $49,900Pending4 beds 2 baths1,440 sq. ft.
7939 S Escanaba Avenue, Chicago, IL 60617
MLS# 12622566Listed by: HOMES REALTY OF CHICAGO INC $275,000Pending6 beds 3 baths
10633 S Avenue M, Chicago, IL 60617
MLS# 12644554Listed by: SENTENO REAL ESTATE LLC $249,900Active3 beds 2 baths1,110 sq. ft.
8435 S Cregier Avenue, Chicago, IL 60617
MLS# 12645739Listed by: PARKVUE REALTY CORPORATION $249,000Active3 beds 2 baths1,985 sq. ft.
9111 S Kingston Avenue, Chicago, IL 60617
MLS# 12645829Listed by: STRAIGHT-A REALTY, LLC $275,000Active3 beds 2 baths1,219 sq. ft.
10118 S Luella Avenue, Chicago, IL 60617
MLS# 12638438Listed by: COLDWELL BANKER REALTY $225,000Active6 beds 3 baths
8919 S Escanaba Avenue, Chicago, IL 60617
MLS# 12644912Listed by: GRANDVIEW REALTY, LLC $184,000Active0.16 Acres
2135 E 87th Street, Chicago, IL 60617
MLS# 12644232Listed by: BAIRD & WARNER $320,000Active5 beds 3 baths
3017 E 83rd Street, Chicago, IL 60617
MLS# 12636845Listed by: EXP REALTY $290,000Pending6 beds 3 baths
8534 S Bennett Avenue, Chicago, IL 60617
MLS# 12643298Listed by: PURVEY PROPERTIES, INC. $499,900Active7 beds 5 baths
9655 S Commercial Avenue, Chicago, IL 60617
MLS# 12642883Listed by: BLOOM/SANCHEZ REALTY, INC. $225,000Active3 beds 2 baths1,251 sq. ft.
9018 S Brandon Avenue, Chicago, IL 60617
MLS# 12631192Listed by: EXP REALTY $388,000Pending9 beds 3 baths
9020 S Burley Avenue, Chicago, IL 60617
MLS# 12623193Listed by: COLDWELL BANKER REALTY $50,000Active4 beds 2 baths
8417 S Escanaba Avenue, Chicago, IL 60617
MLS# 12642609Listed by: KELLER WILLIAMS ONECHICAGO $337,000Active5 beds 3 baths2,500 sq. ft.
1708 E 84th Place, Chicago, IL 60617
MLS# 12628362Listed by: COLDWELL BANKER REALTY $339,900Active5 beds 3 baths
8641 S Kingston Avenue, Chicago, IL 60617
MLS# 12640613Listed by: CROSS STREET REAL ESTATE $149,900Pending3 beds 1 baths
8111 S Manistee Avenue, Chicago, IL 60617
MLS# 12641480Listed by: NORTH CLYBOURN GROUP, INC.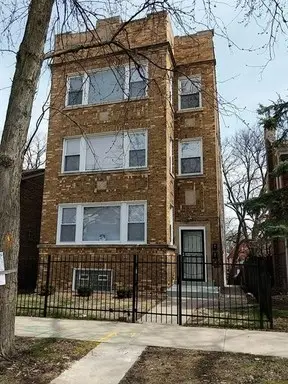 $475,000Active9 beds 3 baths
9133 S Essex Avenue, Chicago, IL 60617
MLS# 12627808Listed by: GC REALTY AND DEVELOPMENT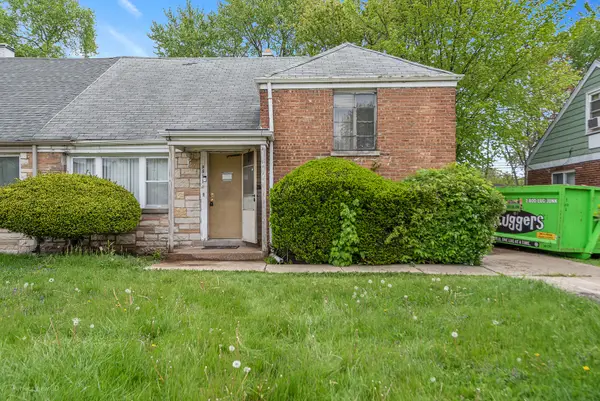 $99,900Pending3 beds 1 baths1,300 sq. ft.
9611 S Oglesby Avenue, Chicago, IL 60617
MLS# 12638722Listed by: RE/MAX ALL PRO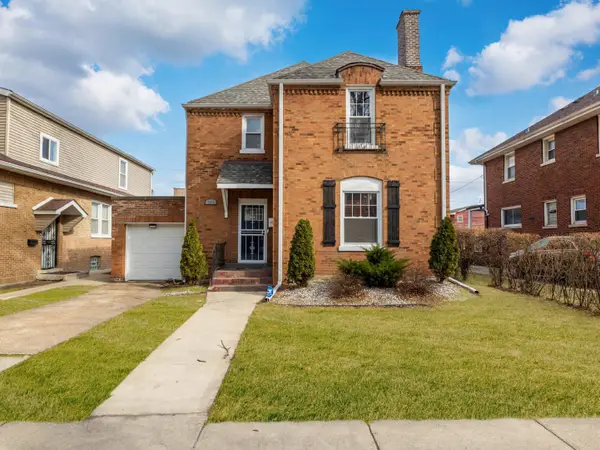 $389,000Pending4 beds 3 baths1,917 sq. ft.
7931 S Paxton Avenue, Chicago, IL 60617
MLS# 12632387Listed by: COLDWELL BANKER REALTY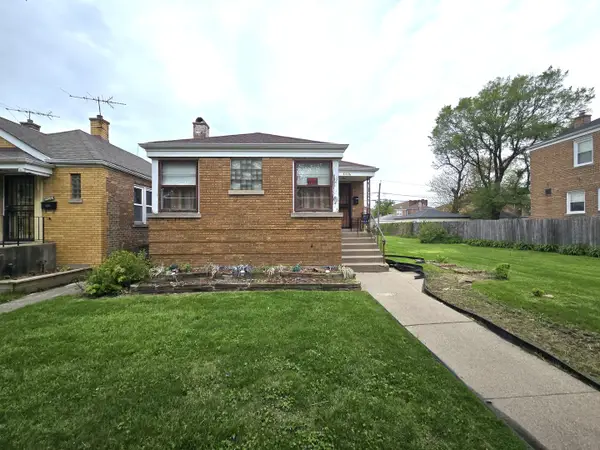 $199,000Active2 beds 2 baths1,080 sq. ft.
8226 S Colfax Avenue, Chicago, IL 60617
MLS# 12633636Listed by: COLDWELL BANKER REALTY $215,000Pending3 beds 1 baths1,134 sq. ft.
9540 S Bennett Avenue, Chicago, IL 60617
MLS# 12636732Listed by: CLASSIC REALTY GROUP PRESTIGE $245,000Pending3 beds 2 baths1,159 sq. ft.
8906 S Crandon Avenue, Chicago, IL 60617
MLS# 12636843Listed by: COMPASS $235,000Pending3 beds 2 baths2,000 sq. ft.
9206 S Anthony Avenue, Chicago, IL 60617
MLS# 12636824Listed by: COMPASS $254,900Active3 beds 2 baths1,800 sq. ft.
1633 E 93rd Street, Chicago, IL 60617
MLS# 12635911Listed by: COLDWELL BANKER REALTY $130,000Active5 beds 2 baths1,816 sq. ft.
7930 S Muskegon Avenue, Chicago, IL 60617
MLS# 12633827Listed by: BAIRD & WARNER $249,000Pending4 beds 2 baths2,368 sq. ft.
7923 S Luella Avenue, Chicago, IL 60617
MLS# 12634327Listed by: SENTENO REAL ESTATE LLC $249,000Active5 beds 3 baths
10305 S Avenue J, Chicago, IL 60617
MLS# 12636006Listed by: CENTRAL REALTY-KRALJ & SANCHEZ $235,000Pending3 beds 1 baths900 sq. ft.
11322 S Avenue G, Chicago, IL 60617
MLS# 12627726Listed by: G & R REALTY, INC. $199,900Active10 beds 4 baths
8119 S Escanaba Avenue, Chicago, IL 60617
MLS# 12636036Listed by: REALTY OF AMERICA, LLC $190,000Pending3 beds 1 baths1,158 sq. ft.
8139 S Exchange Avenue, Chicago, IL 60617
MLS# 12608953Listed by: REALTY OF AMERICA, LLC $179,900Pending4 beds 2 baths1,200 sq. ft.
10700 S Avenue G, Chicago, IL 60617
MLS# 12632128Listed by: @PROPERTIES CHRISTIE'S INTERNATIONAL REAL ESTATE $319,900Active4 beds 3 baths1,388 sq. ft.
11056 S State Line Road, Chicago, IL 60617
MLS# 12635010Listed by: BETTER HOMES & GARDENS REAL ESTATE $80,000Pending2 beds 1 baths937 sq. ft.
2556 E 97th Place, Chicago, IL 60617
MLS# 12634724Listed by: PARKVUE REALTY CORPORATION $299,000Pending8 beds 4 baths
8756 S Exchange Avenue, Chicago, IL 60617
MLS# 12620969Listed by: REDFIN CORPORATION $330,000Active3 beds 2 baths1,680 sq. ft.
9238 S Constance Avenue, Chicago, IL 60617
MLS# 12610446Listed by: KELLER WILLIAMS PREFERRED RLTY $265,000Active3 beds 2 baths1,255 sq. ft.
8338 S Yates Boulevard, Chicago, IL 60617
MLS# 12628543Listed by: F.J. WILLIAMS REALTY LLC $189,999Pending4 beds 2 baths
Address Withheld By Seller, Chicago, IL 60617
MLS# 12602497Listed by: REALTY OF AMERICA, LLC $280,000Active6 beds 2 baths
8329 S Burnham Avenue, Chicago, IL 60617
MLS# 12627917Listed by: EXP REALTY $125,000Pending3 beds 1 baths912 sq. ft.
9131 S Merrill Avenue, Chicago, IL 60617
MLS# 12621421Listed by: HOMESMART CONNECT LLC $364,900Pending4 beds 2 baths
11101 S Ewing Avenue, Chicago, IL 60617
MLS# 12625763Listed by: FOUR SEASONS REALTY, INC. $199,900Pending3 beds 2 baths1,840 sq. ft.
2846 E 101st Street, Chicago, IL 60617
MLS# 12618045Listed by: GRINKER & GARCIA REAL ESTATE $369,900Active5 beds 2 baths1,272 sq. ft.
8801 S Clyde Avenue, Chicago, IL 60617
MLS# 12623924Listed by: PREMIER MIDWEST REALTY, INC $199,900Pending6 beds 2 baths
8328 S Baker Avenue, Chicago, IL 60617
MLS# 12615030Listed by: GRINKER & GARCIA REAL ESTATE $265,000Pending4 beds 2 baths1,790 sq. ft.
10921 S Avenue H, Chicago, IL 60617
MLS# 12617013Listed by: EXP REALTY $209,999Pending8 beds 4 baths
8610 S Burnham Avenue, Chicago, IL 60617
MLS# 12622403Listed by: CLOUD GATE REALTY LLC $55,000Active4 beds 2 baths
8207 S South Shore Drive, Chicago, IL 60617
MLS# 12623045Listed by: KELLER WILLIAMS ONECHICAGO $65,000Active5 beds 3 baths
8405 S Baltimore Avenue, Chicago, IL 60617
MLS# 12623050Listed by: HOMESMART CONNECT LLC $299,900Active4 beds 2 baths1,400 sq. ft.
8958 S Oglesby Avenue, Chicago, IL 60617
MLS# 12621798Listed by: VILLAGE REALTY, INC. $150,000Pending3 beds 1 baths800 sq. ft.
10004 S Torrence Avenue, Chicago, IL 60617
MLS# 12622472Listed by: CORE REALTY & INVESTMENTS INC. $190,000Active3 beds 2 baths1,068 sq. ft.
8653 S Saginaw Avenue, Chicago, IL 60617
MLS# 12616307Listed by: COMPASS $438,000Active8 beds 4 baths
8643 S Exchange Avenue, Chicago, IL 60617
MLS# 12621553Listed by: NORTH CLYBOURN GROUP, INC. $168,000Pending3 beds 2 baths
8104 S Euclid Avenue, Chicago, IL 60617
MLS# 12621203Listed by: CHICAGO REALTY PARTNERS, LTD $170,000Active5 beds 2 baths2,400 sq. ft.
8128 S Coles Avenue, Chicago, IL 60617
MLS# 12620693Listed by: USA REALTY GROUP INC $153,000Active5 beds 2 baths
2913 E 97th Street, Chicago, IL 60617
MLS# 12614040Listed by: EXP REALTY $184,900Active6 beds 3 baths
3025 E 80th Place, Chicago, IL 60617
MLS# 12619008Listed by: CITYWIDE REALTY LLC $289,000Pending5 beds 2 baths
9328 S Paxton Avenue, Chicago, IL 60617
MLS# 12631753Listed by: COMPASS $339,999Pending3 beds 3 baths1,928 sq. ft.
11055 S Avenue C, Chicago, IL 60617
MLS# 12617866Listed by: HOMESMART CONNECT LLC $254,900Pending3 beds 1 baths1,056 sq. ft.
10955 S Mackinaw Avenue, Chicago, IL 60617
MLS# 12611698Listed by: GRINKER & GARCIA REAL ESTATE $399,000Pending8 beds 3 baths
8204 S Exchange Avenue, Chicago, IL 60617
MLS# 12614912Listed by: KALE REALTY $129,000Pending3 beds 2 baths1,398 sq. ft.
8028 S Bennett Avenue, Chicago, IL 60617
MLS# 12615903Listed by: KELLER WILLIAMS PREFERRED RLTY $335,000Pending5 beds 3 baths2,418 sq. ft.
7955 S Colfax Avenue, Chicago, IL 60617
MLS# 12615771Listed by: LUXE GROUP REAL ESTATE $315,000Active8 beds 3 baths
8601 S Kingston Avenue, Chicago, IL 60617
MLS# 12615145Listed by: TOP CARE REALTY LLC $264,900Pending5 beds 2 baths1,840 sq. ft.
2900 E 101st Street, Chicago, IL 60617
MLS# 12609684Listed by: GRINKER & GARCIA REAL ESTATE $194,000Active2 beds 1 baths1,300 sq. ft.
10439 S Avenue M, Chicago, IL 60617
MLS# 12615044Listed by: BLOOM/SANCHEZ REALTY, INC. $550,000Pending9 beds 3 baths
7953 S Essex Avenue, Chicago, IL 60617
MLS# 12612779Listed by: EXP REALTY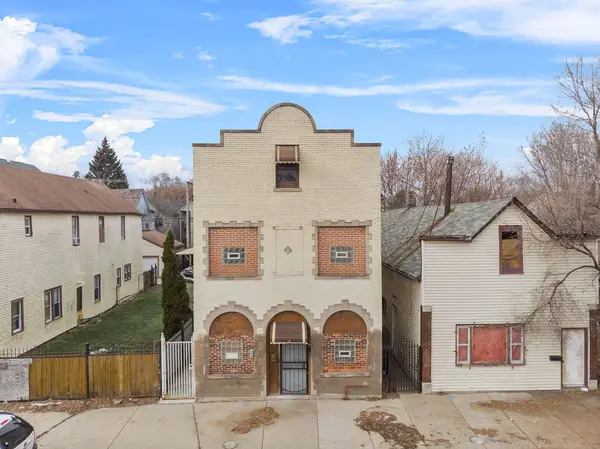 $175,000Active8 beds 4 baths
8420 S Burley Avenue, Chicago, IL 60617
MLS# 12614504Listed by: BLOOM/SANCHEZ REALTY, INC. $370,000Pending4 beds 3 baths1,800 sq. ft.
11548 S Avenue G, Chicago, IL 60617
MLS# 12614540Listed by: BLOOM/SANCHEZ REALTY, INC.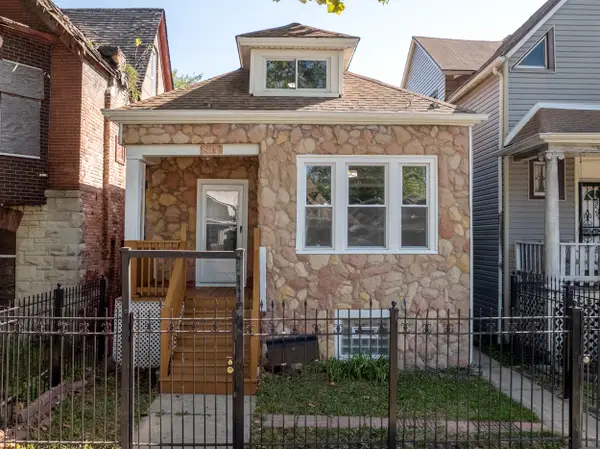 $265,000Pending7 beds 3 baths1,615 sq. ft.
8117 S Burnham Avenue, Chicago, IL 60617
MLS# 12585995Listed by: LUNA REALTY GROUP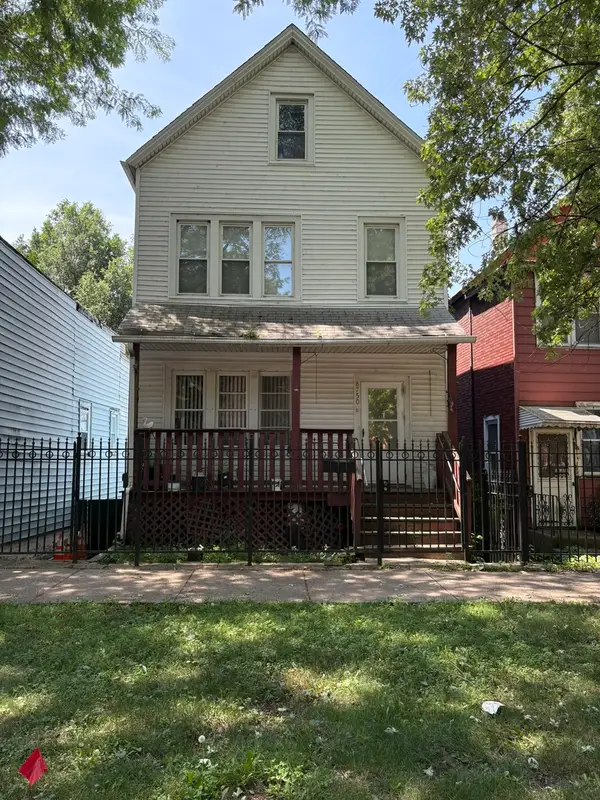 $109,000Active4 beds 2 baths
8750 S Exchange Avenue, Chicago, IL 60617
MLS# 12614137Listed by: CORE REALTY & INVESTMENTS INC.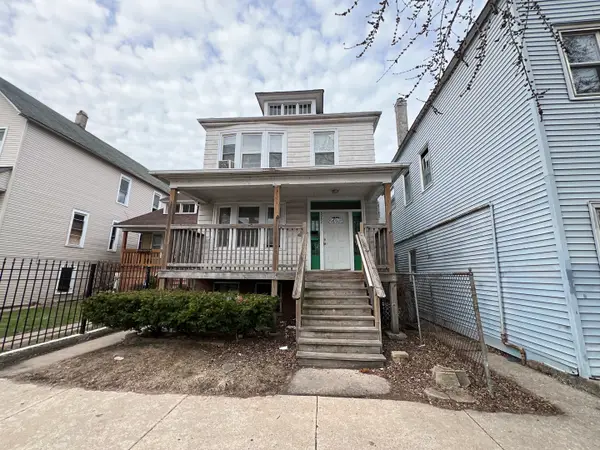 $190,000Pending6 beds 2 baths
8242 S Houston Avenue, Chicago, IL 60617
MLS# 12610800Listed by: REAL PROPERTY MANAGEMENT GROUP CHICAGO $180,000Pending4 beds 2 baths
8209 S Coles Avenue, Chicago, IL 60617
MLS# 12614009Listed by: TOP CARE REALTY LLC $364,900Pending3 beds 2 baths1,200 sq. ft.
11046 S Ewing Avenue, Chicago, IL 60617
MLS# 12613802Listed by: GRINKER & GARCIA REAL ESTATE $375,000Active7 beds 3 baths
8039 S Marquette Avenue, Chicago, IL 60617
MLS# 12613291Listed by: KM REALTY GROUP, LLC $450,000Active8 beds 3 baths
8841 S Muskegon Avenue, Chicago, IL 60617
MLS# 12611815Listed by: HOMESMART REALTY GROUP $299,900Active4 beds 2 baths1,500 sq. ft.
8312 S Phillips Avenue, Chicago, IL 60617
MLS# 12611353Listed by: PEARSON REALTY GROUP $49,900Pending5 beds 2 baths1,750 sq. ft.
10511 S Yates Avenue, Chicago, IL 60617
MLS# 12611778Listed by: CHOICE REALTY GROUP INC. $140,000Pending4 beds 2 baths1,035 sq. ft.
8718 S Euclid Avenue, Chicago, IL 60617
MLS# 12609291Listed by: KBM REALTY $295,000Active4 beds 2 baths2,000 sq. ft.
1629 E 92nd Street, Chicago, IL 60617
MLS# 12605701Listed by: COLDWELL BANKER REALTY $250,000Pending4 beds 3 baths1,156 sq. ft.
8423 S Colfax Avenue, Chicago, IL 60617
MLS# 12570170Listed by: JMRI CORP $41,000Pending4 beds 2 baths1,635 sq. ft.
7919 S Escanaba Avenue, Chicago, IL 60617
MLS# 12609906Listed by: PREMIER MIDWEST REALTY, INC $269,000Active4 beds 2 baths3,125 sq. ft.
10426 S Calhoun Avenue, Chicago, IL 60617
MLS# 12605478Listed by: KALE REALTY $139,999Active3 beds 1 baths1,500 sq. ft.
9230 S Saginaw Avenue, Chicago, IL 60617
MLS# 12608916Listed by: REAL PEOPLE REALTY $165,000Pending4 beds 1 baths1,432 sq. ft.
9748 S Van Vlissingen Road, Chicago, IL 60617
MLS# 12551324Listed by: COLDWELL BANKER REALTY $104,900Pending8 beds 4 baths
8747 S Escanaba Avenue, Chicago, IL 60617
MLS# 12606317Listed by: RE/MAX PREMIER $180,000Active4 beds 2 baths1,100 sq. ft.
7939 S Kingston Avenue, Chicago, IL 60617
MLS# 12608070Listed by: CLARK REALTY GROUP OF CHGO LLC $170,000Pending4 beds 2 baths1,872 sq. ft.
8320 S Phillips Avenue, Chicago, IL 60617
MLS# 12607921Listed by: COLDWELL BANKER REALTY $279,000Active3 beds 2 baths
Address Withheld By Seller, Chicago, IL 60617
MLS# 12601916Listed by: REAL PROPERTY MANAGEMENT GROUP CHICAGO $449,000Active4 beds 4 baths3,230 sq. ft.
Address Withheld By Seller, Chicago, IL 60617
MLS# 12602610Listed by: GRINKER & GARCIA REAL ESTATE $24,900Active2 beds 1 baths700 sq. ft.
3258 E 91st Street #2D, Chicago, IL 60617
MLS# 12607846Listed by: ROYAL CREST REALTY, INC. $299,999Active4 beds 2 baths1,800 sq. ft.
8406 S Oglesby Avenue, Chicago, IL 60617
MLS# 12606057Listed by: UNITED REALTY AND DEVELOPMENT $65,000Active0 Acres
8507 S Brandon Avenue, Chicago, IL 60617
MLS# 12605689Listed by: SU FAMILIA REAL ESTATE INC $155,000Pending3 beds 2 baths996 sq. ft.
8010 S Ridgeland Avenue #1D, Chicago, IL 60617
MLS# 12604586Listed by: CHICAGOLAND BROKERS INC. $139,000Active3 beds 1 baths946 sq. ft.
2247 E 96th Street, Chicago, IL 60617
MLS# 12598075Listed by: BLUE DOOR DAVE INC $120,000Active2 beds 1 baths954 sq. ft.
9960 S Van Vlissingen Road, Chicago, IL 60617
MLS# 12603668Listed by: DNV SOLUTIONS LLC $324,900Pending4 beds 2 baths1,851 sq. ft.
10833 S Avenue M, Chicago, IL 60617
MLS# 12583345Listed by: CHARLES RUTENBERG REALTY OF IL $14,900Active0 Acres
10013 S Hoxie Avenue, Chicago, IL 60617
MLS# 12603025Listed by: COLDWELL BANKER REALTY $379,900Active6 beds 3 baths2,000 sq. ft.
8839 S Colfax Avenue, Chicago, IL 60617
MLS# 12599736Listed by: KALE REALTY $269,000Pending6 beds 6 baths
7960 S Phillips Avenue, Chicago, IL 60617
MLS# 12599401Listed by: DEI REALTY LLC $360,000Pending6 beds 2 baths
8722 S Kingston Avenue, Chicago, IL 60617
MLS# 12592761Listed by: KELLER WILLIAMS PREFERRED RLTY $135,000Active3 beds 2 baths937 sq. ft.
9640 S Hoxie Avenue, Chicago, IL 60617
MLS# 12598019Listed by: LUX LIFE REALTY LLC $160,000Active3 beds 1 baths1,379 sq. ft.
8640 S Bennett Avenue, Chicago, IL 60617
MLS# 12597626Listed by: LUXE LIVING REALTY, INC $214,900Pending4 beds 3 baths1,008 sq. ft.
2850 E 94th Street, Chicago, IL 60617
MLS# 12593502Listed by: REDFIN CORPORATION $115,000Pending4 beds 1 baths1,298 sq. ft.
9021 S Exchange Avenue, Chicago, IL 60617
MLS# 12593243Listed by: MANAGE CHICAGO, INC. $215,000Pending3 beds 2 baths1,587 sq. ft.
Address Withheld By Seller, Chicago, IL 60617
MLS# 12590920Listed by: EXP REALTY $310,000Active4 beds 2 baths
8548 S Manistee Avenue, Chicago, IL 60617
MLS# 12579664Listed by: REDFIN CORPORATION $150,000Active4 beds 2 baths
8444 S Escanaba Avenue, Chicago, IL 60617
MLS# 12590275Listed by: TOP CARE REALTY LLC $0Active3 beds 1 baths1,098 sq. ft.
9315 S East End Avenue, Chicago, IL 60617
MLS# 12524522Listed by: PARKVUE REALTY CORPORATION $439,000Active4 beds 2 baths2,780 sq. ft.
11605 S Avenue N, Chicago, IL 60617
MLS# 12577398Listed by: GRINKER & GARCIA REAL ESTATE $530,000Active13 beds 5 baths
8705 S Saginaw Avenue, Chicago, IL 60617
MLS# 12586423Listed by: YUB REALTY INC $324,400Pending6 beds 2 baths2,500 sq. ft.
9137 S Chappel Avenue, Chicago, IL 60617
MLS# 12585803Listed by: CHICAGOLAND BROKERS, INC. $255,000Pending5 beds 2 baths1,434 sq. ft.
8367 S Baltimore Avenue, Chicago, IL 60617
MLS# 12582968Listed by: EXIT STRATEGY REALTY / EMA MANAGEMENT $249,000Pending5 beds 2 baths
8220 S South Shore Drive, Chicago, IL 60617
MLS# 12579872Listed by: GRINKER & GARCIA REAL ESTATE $12,000Active0 Acres
8356 S Paxton Avenue, Chicago, IL 60617
MLS# 12579808Listed by: SERENE REALTY, INC. $68,990Active4 beds 2 baths1,707 sq. ft.
8122 S Escanaba Avenue, Chicago, IL 60617
MLS# 12579766Listed by: EXAREALTY LLC $79,500Pending4 beds 2 baths
8623 S Manistee Avenue, Chicago, IL 60617
MLS# 12578960Listed by: KALE REALTY $92,500Pending3 beds 1 baths1,201 sq. ft.
9926 S Luella Avenue, Chicago, IL 60617
MLS# 12528412Listed by: PARKVUE REALTY CORPORATION $300,000Active3 beds 2 baths
9211 S Clyde Avenue, Chicago, IL 60617
MLS# 12546234Listed by: REALTY OF AMERICA, LLC $339,000Active4 beds 3 baths2,500 sq. ft.
Address Withheld By Seller, Chicago, IL 60617
MLS# 12575474Listed by: HUNTER'S REALTY, INC. $245,000Active4 beds 2 baths1,728 sq. ft.
Address Withheld By Seller, Chicago, IL 60617
MLS# 12574707Listed by: @PROPERTIES CHRISTIE'S INTERNATIONAL REAL ESTATE $135,900Pending4 beds 2 baths1,440 sq. ft.
8211 S Saginaw Avenue, Chicago, IL 60617
MLS# 12574362Listed by: INFINITI PROPERTIES, INC. $385,000Active0.37 Acres
1955 E 87th Street, Chicago, IL 60617
MLS# 12574031Listed by: NETWORK PROPERTY MANAGMENT LLC $240,000Pending3 beds 2 baths640 sq. ft.
10726 S Mackinaw Avenue, Chicago, IL 60617
MLS# 12573023Listed by: CERTIFIED REALTY GROUP LLC $90,000Active3 beds 2 baths1,200 sq. ft.
8103 S Muskegon Avenue, Chicago, IL 60617
MLS# 12572962Listed by: MANAGE CHICAGO, INC.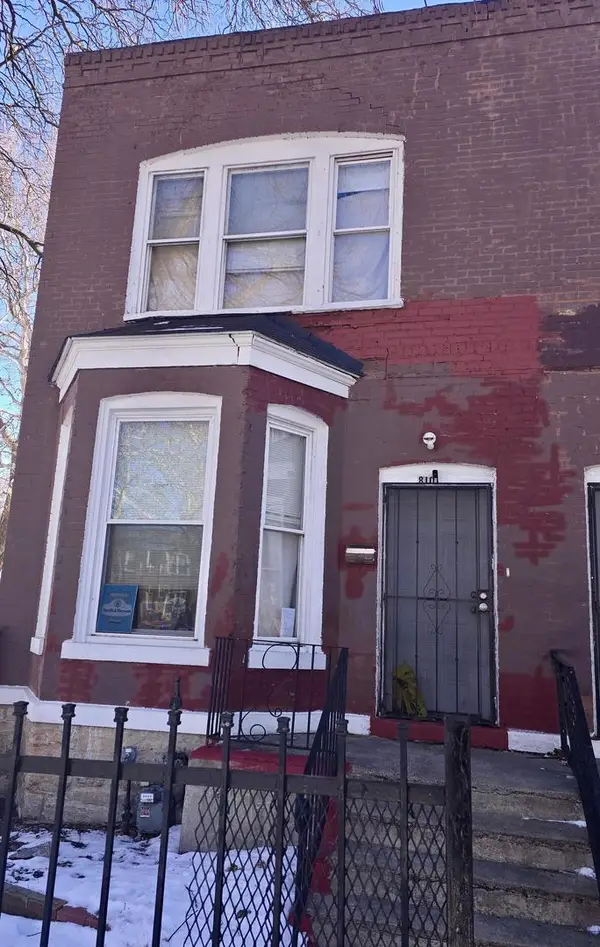 $90,000Active3 beds 2 baths1,200 sq. ft.
8101 S Muskegon Avenue, Chicago, IL 60617
MLS# 12572570Listed by: MANAGE CHICAGO, INC. $115,000Pending5 beds 2 baths1,619 sq. ft.
8626 S Kingston Avenue, Chicago, IL 60617
MLS# 12572099Listed by: KELLER WILLIAMS PREFERRED RLTY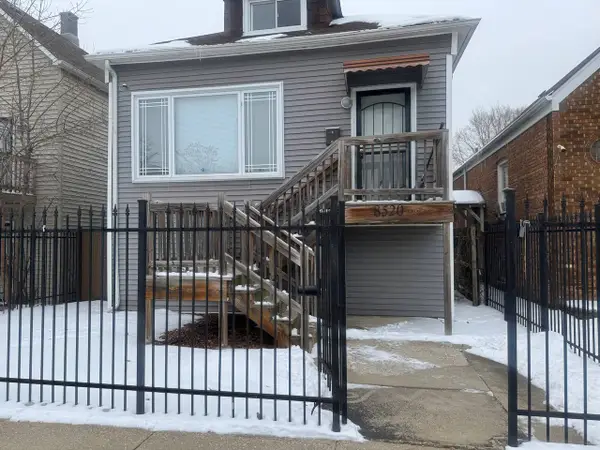 $96,000Pending2 beds 1 baths1,100 sq. ft.
8520 S Kingston Avenue, Chicago, IL 60617
MLS# 12571071Listed by: EJC REAL ESTATE SERVICES $180,000Pending3 beds 2 baths1,326 sq. ft.
8623 S Cregier Avenue, Chicago, IL 60617
MLS# 12568960Listed by: @PROPERTIES CHRISTIE'S INTERNATIONAL REAL ESTATE $90,000Active3 beds 2 baths2,044 sq. ft.
8012 S Essex Avenue #3S, Chicago, IL 60617
MLS# 12567053Listed by: EXP REALTY $137,800Active2 beds 2 baths1,003 sq. ft.
7915 S Saginaw Avenue, Chicago, IL 60617
MLS# 12566505Listed by: REALHOME SERVICES & SOLUTIONS, INC. $150,000Pending2 beds 1 baths981 sq. ft.
10946 S Avenue D, Chicago, IL 60617
MLS# 12561818Listed by: REALTY OF AMERICA, LLC $38,000Active4 beds 2 baths
8847 S Burley Avenue, Chicago, IL 60617
MLS# 12563838Listed by: CHOICE REALTY GROUP INC. $199,000Active0 Acres
8314 S Stony Island Avenue, Chicago, IL 60617
MLS# 12590150Listed by: INFINITI PROPERTIES, INC. $35,000Pending0.08 Acres
9318 S Cregier Avenue, Chicago, IL 60617
MLS# 12560877Listed by: TRADEMARKS & ASSOCIATES $399,999Active9 beds 4 baths
8330 S Buffalo Avenue, Chicago, IL 60617
MLS# 12560124Listed by: CORE REALTY & INVESTMENTS INC. $369,000Active8 beds 4 baths
8143 S Colfax Avenue, Chicago, IL 60617
MLS# 12560052Listed by: KELLER WILLIAMS ONECHICAGO $209,900Active5 beds 2 baths
8256 S South Shore Drive, Chicago, IL 60617
MLS# 12560080Listed by: CORE REALTY & INVESTMENTS INC. $444,900Active10 beds 4 baths
8400 S Burley Avenue, Chicago, IL 60617
MLS# 12560091Listed by: CORE REALTY & INVESTMENTS INC. $100,000Active3 beds 1 baths3,720 sq. ft.
7927 S Colfax Avenue, Chicago, IL 60617
MLS# 12548324Listed by: KM REALTY GROUP, LLC $25,000Active0 Acres
8415 S Mackinaw Avenue, Chicago, IL 60617
MLS# 12543004Listed by: O'SHEA REALTY, LLC $80,000Active2 beds 2 baths608 sq. ft.
8148 S Brandon Avenue, Chicago, IL 60617
MLS# 12540998Listed by: PARKVUE REALTY CORPORATION $124,900Active0 Acres
8001 S Burnham Avenue, Chicago, IL 60617
MLS# 12544102Listed by: OIKOS REALTY LLC $159,900Pending2 beds 2 baths1,136 sq. ft.
9134 S Paxton Avenue, Chicago, IL 60617
MLS# 12538427Listed by: SU FAMILIA REAL ESTATE INC- Open Sat, 12 to 2pm
 $225,000Active2 beds 2 baths937 sq. ft.
Address Withheld By Seller, Chicago, IL 60617
MLS# 12533707Listed by: ARD REAL ESTATE PLLC  $145,000Active5 beds 2 baths
8533 S Manistee Avenue, Chicago, IL 60617
MLS# 12532341Listed by: @PROPERTIES CHRISTIE'S INTERNATIONAL REAL ESTATE $150,000Pending3 beds 3 baths2,496 sq. ft.
Address Withheld By Seller, Chicago, IL 60617
MLS# 12528932Listed by: JMAR REALTY GROUP $40,000Pending2 beds 1 baths
8118 S Muskegon Avenue, Chicago, IL 60617
MLS# 12528021Listed by: ALL CIRCLES INC. $24,900Pending2 beds 1 baths700 sq. ft.
3258 E 91st Street #2D, Chicago, IL 60617
MLS# 12521981Listed by: ROYAL CREST REALTY, INC. $200,000Active7 beds 3 baths
9338 S Marquette Avenue, Chicago, IL 60617
MLS# 12510303Listed by: EXP REALTY $235,000Pending5 beds 3 baths1,800 sq. ft.
10749 S Avenue J, Chicago, IL 60617
MLS# 12589647Listed by: CENTRAL REALTY-KRALJ & SANCHEZ $85,000Pending3 beds 1 baths4,409 sq. ft.
9834 S Oglesby Street, Chicago, IL 60617
MLS# 12459734Listed by: LISTING LEADERS NORTHWEST, INC $297,000Active4 beds 2 baths1,200 sq. ft.
2151 E 90th Street, Chicago, IL 60617
MLS# 12514278Listed by: EXP REALTY $274,999Pending5 beds 2 baths
2836 E 84th Street, Chicago, IL 60617
MLS# 12570688Listed by: CROSS STREET REAL ESTATE $239,900Pending3 beds 3 baths
8225 S Manistee Avenue, Chicago, IL 60617
MLS# 12510821Listed by: EXIT STRATEGY REALTY $95,000Pending2 beds 1 baths900 sq. ft.
9918 S Hoxie Avenue, Chicago, IL 60617
MLS# 12510569Listed by: MANAGE CHICAGO, INC. $209,999Pending5 beds 1 baths1,524 sq. ft.
2016 E 93rd Street, Chicago, IL 60617
MLS# 12496469Listed by: SHOPPING CASAS CHICAGO LLC $240,000Active3 beds 2 baths1,360 sq. ft.
9351 S Manistee Avenue, Chicago, IL 60617
MLS# 12494036Listed by: ONE STOP REAL ESTATE SERVICES $105,000Active4 beds 2 baths1,584 sq. ft.
8112 S Escanaba Avenue, Chicago, IL 60617
MLS# 12483957Listed by: MANAGE CHICAGO, INC. $159,000Pending8 beds 2 baths
2861 E 93rd Street, Chicago, IL 60617
MLS# 12479936Listed by: GRINKER & GARCIA REAL ESTATE $159,000Pending7 beds 2 baths
8322 S Baker Avenue, Chicago, IL 60617
MLS# 12479940Listed by: GRINKER & GARCIA REAL ESTATE $55,000Pending2 beds 1 baths956 sq. ft.
2154 E 97th Place, Chicago, IL 60617
MLS# 12469830Listed by: ELLISON PARKER REALTY $175,000Pending5 beds 2 baths
7930 S Luella Avenue, Chicago, IL 60617
MLS# 12467012Listed by: O W AUCTION GROUP LLC $40,000Pending7 beds 3 baths
8453 S Muskegon Avenue, Chicago, IL 60617
MLS# 12459253Listed by: REALTY OF AMERICA, LLC $320,000Active4 beds 2 baths
8647 S Kingston Avenue, Chicago, IL 60617
MLS# 12447384Listed by: PARKVUE REALTY CORPORATION $74,000Pending4 beds 2 baths1,400 sq. ft.
8613 S Houston Avenue, Chicago, IL 60617
MLS# 12552549Listed by: KELLER WILLIAMS ONECHICAGO $59,000Pending4 beds 2 baths
8527 S Colfax Avenue, Chicago, IL 60617
MLS# 12552552Listed by: KELLER WILLIAMS ONECHICAGO $275,000Active0 Acres
9375 S Ewing Avenue, Chicago, IL 60617
MLS# 12436209Listed by: LISTING LEADERS NORTHWEST, INC $420,000Active8 beds 4 baths
9116 S South Chicago Avenue, Chicago, IL 60617
MLS# 12435624Listed by: HOMETOWN REAL ESTATE GROUP LLC $339,000Pending5 beds 2 baths2,670 sq. ft.
11315 S Avenue G, Chicago, IL 60617
MLS# 12553935Listed by: TRP REALTY LLC $106,000Active4 beds 2 baths948 sq. ft.
8371 S Baltimore Avenue, Chicago, IL 60617
MLS# 12393130Listed by: PARKVUE REALTY CORPORATION $8,000Active0.09 Acres
8017 S Marquette Avenue, Chicago, IL 60617
MLS# 12388765Listed by: COLDWELL BANKER REALTY $150,000Pending6 beds 2 baths
10002 S Torrence Avenue, Chicago, IL 60617
MLS# 12542730Listed by: CORE REALTY & INVESTMENTS INC. $439,900Active9 beds 7 baths
7965 S Phillips Avenue, Chicago, IL 60617
MLS# 12373233Listed by: CENTURY 21 S.G.R., INC. $30,000Active0 Acres
9231 S Merrill Avenue, Chicago, IL 60617
MLS# 12356735Listed by: REAL PEOPLE REALTY $9,900Pending0 Acres
8647 S Colfax Avenue, Chicago, IL 60617
MLS# 12345100Listed by: AVENUE 1 REALTY GROUP $185,000Pending3 beds 2 baths792 sq. ft.
10005 S Calhoun Avenue, Chicago, IL 60617
MLS# 12560305Listed by: PRIME TIME REALTY GROUP LLC $235,000Active4 beds 2 baths
8231 S Coles Avenue, Chicago, IL 60617
MLS# 12509442Listed by: COLDWELL BANKER REALTY $260,000Pending6 beds 2 baths
2922 E 97th Street, Chicago, IL 60617
MLS# 12306338Listed by: NEW CHAPTER REAL ESTATE $215,000Pending4 beds 2 baths1,035 sq. ft.
10408 S Avenue J, Chicago, IL 60617
MLS# 12295718Listed by: MIDWEST SIGNATUREPROPERTIES CO $69,900Pending3 beds 2 baths640 sq. ft.
8545 S Saginaw Avenue, Chicago, IL 60617
MLS# 12570721Listed by: RE/MAX PREMIER $25,000Active0 Acres
3038-3040 E 79th Place, Chicago, IL 60617
MLS# 12164154Listed by: EGP REALTY GROUP LLC $159,000Active11 beds 4 baths
10801 S Hoxie Avenue, Chicago, IL 60617
MLS# 12506709Listed by: GRINKER & GARCIA REAL ESTATE $130,000Active4 beds 2 baths1,240 sq. ft.
8127 S Coles Avenue, Chicago, IL 60617
MLS# 12059657Listed by: MANAGE CHICAGO, INC.- $80,000Active0 Acres
8344 S Stony Island Avenue, Chicago, IL 60617
MLS# 11969756Listed by: F.J. WILLIAMS REALTY LLC - $37,500Active0 Acres
8300 S Mackinaw Avenue, Chicago, IL 60617
MLS# 06784515Listed by: LIFESTYLE PROPERTIES - $24,800Active0 Acres
8329 S Brandon Avenue, Chicago, IL 60617
MLS# 06810995Listed by: LIFESTYLE PROPERTIES  $22,800Active0 Acres
8459 S Manistee Avenue, Chicago, IL 60617
MLS# 11362573Listed by: CIRCLE ONE REALTY $34,808Active0 Acres
2907 E 79th Street, Chicago, IL 60649
MLS# 12556524Listed by: 808 REALTY
Local realty services provided by:CENTURY 21 Broughton Team
Copyright 2026 Midwest Real Estate Data LLC. All rights reserved. The data relating to real estate for sale on this web site comes in part from the Broker Reciprocity Program of the Midwest Real Estate Data LLC. Listing information is deemed reliable but not guaranteed. MLSNI Member Broker: Barbara K. Broughton
Popular searches near 60617
Popular neighborhoods near 60617
- Avalon Park, Chicago homes for sale
- Burnside, Chicago homes for sale
- Calumet Heights, Chicago homes for sale
- Chatham, Chicago homes for sale
- East Side, Chicago homes for sale
- Far Southeast Side, Chicago homes for sale
- Fernwood, Chicago homes for sale
- Hegewisch, Chicago homes for sale
- Jackson Park Highlands, Chicago homes for sale
- Marynook, Chicago homes for sale
- Pill Hill, Chicago homes for sale
- Princeton Park, Chicago homes for sale
- Pullman, Chicago homes for sale
- Riverdale, Chicago homes for sale
- Roseland, Chicago homes for sale
- South Chicago, Chicago homes for sale
- South Deering, Chicago homes for sale
- South Shore, Chicago homes for sale
- Stony Island Park, Chicago homes for sale
- West Chesterfield, Chicago homes for sale
Counties near Chicago, 60617
- Berrien County homes for sale
- Cook County homes for sale
- DeKalb County homes for sale
- DuPage County homes for sale
- Grundy County homes for sale
- Jasper County homes for sale
- Kane County homes for sale
- Kankakee County homes for sale
- Kendall County homes for sale
- Kenosha County homes for sale
- Lake County homes for sale
- Lake County homes for sale
- LaPorte County homes for sale
- McHenry County homes for sale
- Newton County homes for sale
- Porter County homes for sale
- Pulaski County homes for sale
- St. Joseph County homes for sale
- Starke County homes for sale
- Will County homes for sale
Protect your home and budget from life's surprises with an Assurant Home Warranty, backed by a partner that supports you through every step of homeownership. Explore Plans.
©2026 Century 21 Real Estate LLC. All rights reserved. CENTURY 21®, the CENTURY 21 Logo and C21® are service marks owned by Century 21 Real Estate LLC. Century 21 Real Estate LLC fully supports the principles of the Fair Housing Act and the Equal Opportunity Act. Each office is independently owned and operated. Listing information is deemed reliable but not guaranteed accurate.