- Alsip homes for sale
- Bedford Park homes for sale
- Berwyn homes for sale
- Blue Island homes for sale
- Bridgeview homes for sale
- Burbank homes for sale
- Calumet homes for sale
- Calumet Park homes for sale
- Chicago homes for sale
- Chicago Ridge homes for sale
- Cicero homes for sale
- Evergreen Park homes for sale
- Hometown homes for sale
- Oak Lawn homes for sale
- Riverdale homes for sale
- Stickney homes for sale
- Stickney Township homes for sale
- Summit homes for sale
- Summit Argo homes for sale
- Worth township homes for sale
60621, IL - homes for sale
191 of 191 results displayed
- New
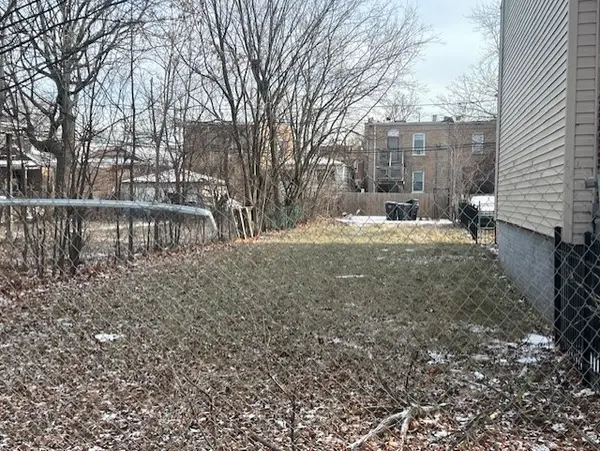 $14,500Active0.25 Acres
7041 S Aberdeen Street, Chicago, IL 60621
MLS# 12605777Listed by: COLDWELL BANKER REALTY
- New
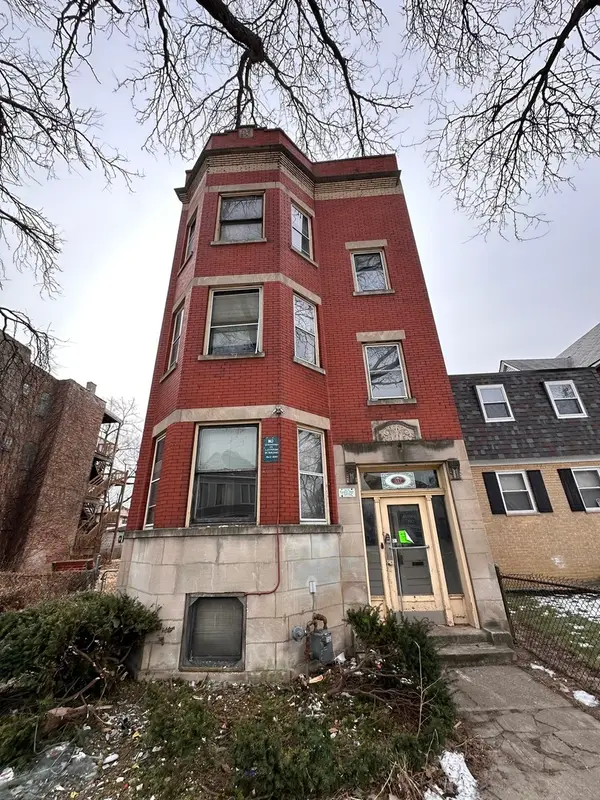 $199,950Active6 beds 3 baths
517 W Englewood Avenue, Chicago, IL 60621
MLS# 12599381Listed by: HOME ONE REALTY - New
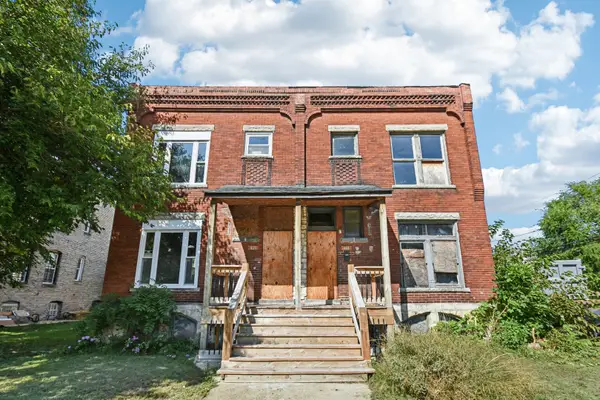 $149,000Active4 beds 2 baths
420 W 65th Place, Chicago, IL 60621
MLS# 12605025Listed by: HOMESMART REALTY GROUP - New
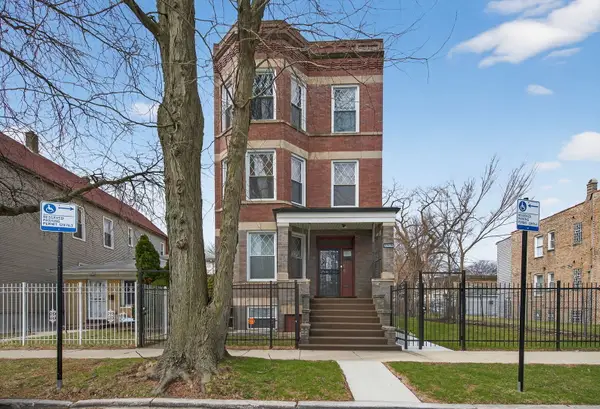
 $169,900Active9 beds 3 baths
6120 S Green Street, Chicago, IL 60621
MLS# 12603460Listed by: BLUE DOOR DAVE INC - Open Sat, 12 to 2pmNew
 $410,000Active8 beds 3 baths
5526 S Aberdeen Street, Chicago, IL 60621
MLS# 12603048Listed by: EXP REALTY - New
 $299,900Active5 beds 2 baths
5932 S Parnell Avenue, Chicago, IL 60621
MLS# 12599972Listed by: KENWOOD REALTY GROUP - New
 $299,900Active6 beds 2 baths
524 W 60th Street, Chicago, IL 60621
MLS# 12603168Listed by: KENWOOD REALTY GROUP - New
 $109,000Active4 beds 2 baths1,692 sq. ft.
6756 S Lafayette Avenue, Chicago, IL 60621
MLS# 12603054Listed by: LEVERAGE INVESTMENTS, LLC - New
 $239,900Active4 beds 3 baths
6853 S Perry Avenue, Chicago, IL 60621
MLS# 12602192Listed by: @PROPERTIES CHRISTIE'S INTERNATIONAL REAL ESTATE - New
 $249,900Active6 beds 3 baths
6045 S Peoria Street, Chicago, IL 60621
MLS# 12587235Listed by: KELLER WILLIAMS PREFERRED RLTY - New
 $124,900Active4 beds 4 baths
7241 S Yale Avenue, Chicago, IL 60621
MLS# 12600193Listed by: PARKVUE REALTY CORPORATION - New
 $295,000Active6 beds 2 baths2,100 sq. ft.
7307 S Peoria Street, Chicago, IL 60621
MLS# 12598560Listed by: EXP REALTY  $390,000Active5 beds 2 baths
7337 S Green Street, Chicago, IL 60621
MLS# 12596546Listed by: WHITNEY REALTY COLLECTIVE $79,000Active4 beds 2 baths
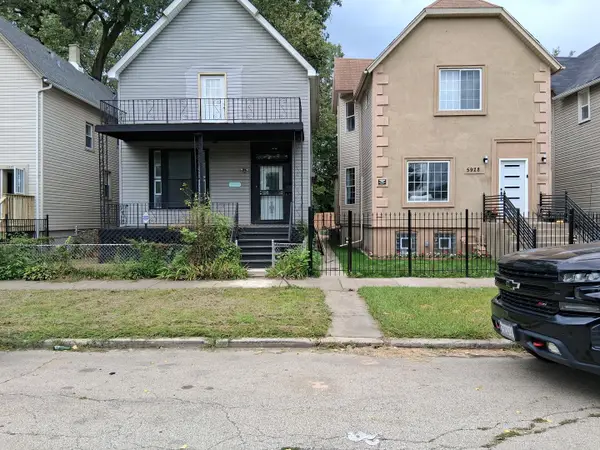
5917 S Green Street, Chicago, IL 60621
MLS# 12595901Listed by: MCSULLY PROPERTIES LLC $289,000Active3 beds 2 baths2,207 sq. ft.
6418 S May Street, Chicago, IL 60621
MLS# 12595933Listed by: PROSALES REALTY $330,000Active4 beds 2 baths
1117 W 57th Street, Chicago, IL 60621
MLS# 12595496Listed by: BLUE DOOR DAVE INC $119,900Active5 beds 2 baths
5607 S Emerald Avenue, Chicago, IL 60621
MLS# 12595145Listed by: ANTHONY J.TROTTO REAL ESTATE $84,900Pending4 beds 3 baths2,182 sq. ft.
6927 S Perry Avenue, Chicago, IL 60621
MLS# 12595125Listed by: SR REALTY GROUP INC.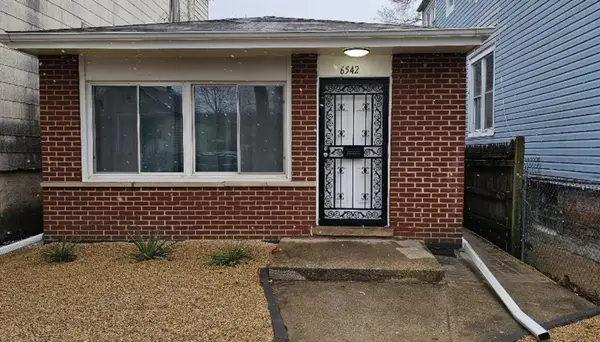 $254,900Active4 beds 2 baths950 sq. ft.
6542 S Carpenter Street, Chicago, IL 60621
MLS# 12594779Listed by: CHICAGOLAND BROKERS, INC. $336,000Pending5 beds 2 baths
7418 S Normal Avenue, Chicago, IL 60621
MLS# 12593944Listed by: GNP REALTY PARTNERS, LLC $225,000Active3 beds 2 baths1,260 sq. ft.
7128 S May Street, Chicago, IL 60621
MLS# 12593396Listed by: REALTY OF AMERICA, LLC
 $185,000Pending8 beds 3 baths
1044 W Marquette Road, Chicago, IL 60621
MLS# 12592272Listed by: CENTURY 21 S.G.R., INC. $339,000Active5 beds 3 baths1,950 sq. ft.
7409 S Eggleston Avenue, Chicago, IL 60621
MLS# 12592132Listed by: STANDARD PROPERTIES GROUP LLC $16,000Active0 Acres
5943 S May Street, Chicago, IL 60621
MLS# 12592119Listed by: KELLER WILLIAMS PREFERRED REALTY $249,900Pending6 beds 2 baths1,687 sq. ft.
5809 S Sangamon Street, Chicago, IL 60621
MLS# 12589786Listed by: RE/MAX MI CASA- Open Sat, 3:30 to 5:30pm
 $254,000Active8 beds 3 baths
5756 S Princeton Avenue, Chicago, IL 60621
MLS# 12590750Listed by: REDFIN CORPORATION  $450,000Pending8 beds 3 baths
7339 S Harvard Avenue, Chicago, IL 60621
MLS# 12590221Listed by: ANAIA HOWELL $399,900Active9 beds 3 baths
6640 S Union Avenue, Chicago, IL 60621
MLS# 12590192Listed by: BLUE DOOR DAVE INC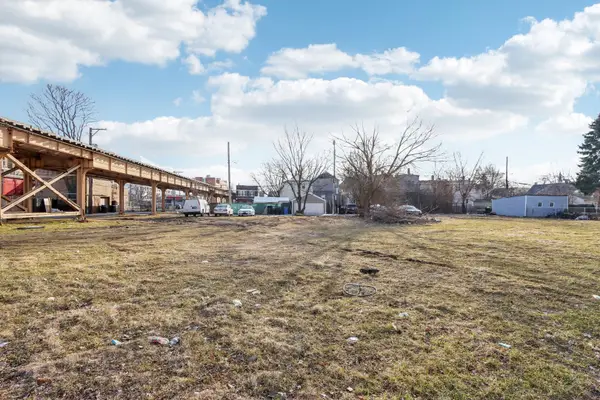 $17,500Active0 Acres
6321 S Carpenter Street, Chicago, IL 60621
MLS# 12588930Listed by: REDFIN CORPORATION $244,999Active4 beds 2 baths1,634 sq. ft.
6528 S Sangamon Street, Chicago, IL 60621
MLS# 12586488Listed by: AMERICAN LAND REALTY, LTD.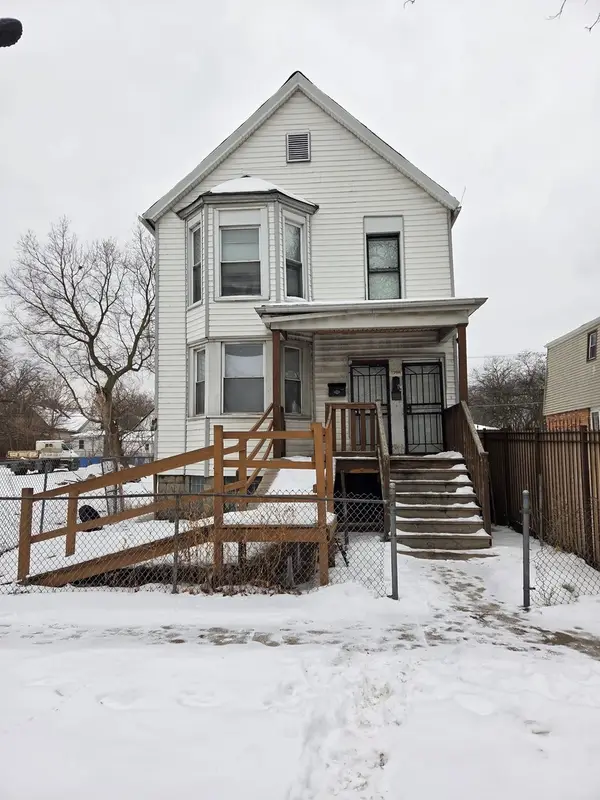 $84,900Active4 beds 2 baths
5708 S Lowe Avenue, Chicago, IL 60621
MLS# 12587410Listed by: COLDWELL BANKER REALTY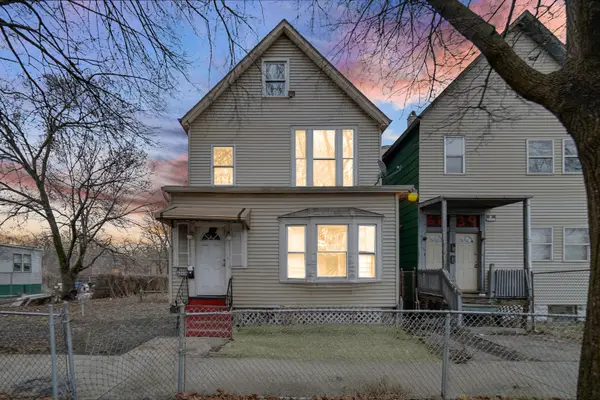 $125,000Active5 beds 3 baths
6237 S May Street, Chicago, IL 60621
MLS# 12586982Listed by: POWER REALTY CHICAGOLAND,PLLC $69,900Active3 beds 2 baths1,152 sq. ft.
6939 S Wentworth Avenue, Chicago, IL 60621
MLS# 12586736Listed by: VYLLA HOME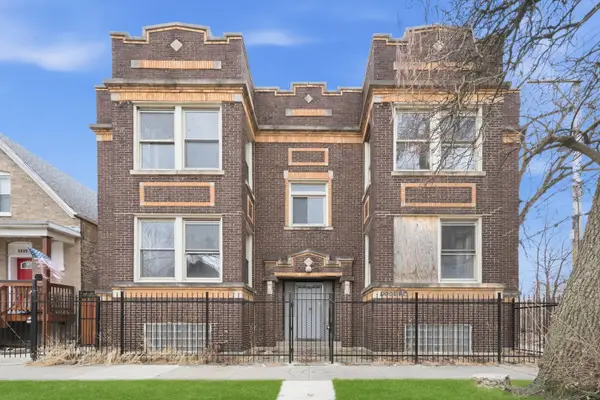 $250,000Pending12 beds 4 baths
5843 S Peoria Street, Chicago, IL 60621
MLS# 12582383Listed by: ICANDY REALTY LLC $180,000Pending5 beds 3 baths
7428 S Princeton Avenue, Chicago, IL 60621
MLS# 12584207Listed by: EXP REALTY $495,000Active12 beds 6 baths
5718 S Green Street, Chicago, IL 60621
MLS# 12584877Listed by: MILLS REALTY INC $269,900Pending6 beds 4 baths
354 W Normal Parkway, Chicago, IL 60621
MLS# 12585071Listed by: BETTER HOMES & GARDENS REAL ESTATE $374,900Pending4 beds 3 baths2,000 sq. ft.
148 W 59th Street, Chicago, IL 60621
MLS# 12584978Listed by: CONSUMER REALTY GROUP, INC. $419,900Pending10 beds 4 baths
Address Withheld By Seller, Chicago, IL 60621
MLS# 12577370Listed by: KELLER WILLIAMS ONECHICAGO $219,300Pending4 beds 2 baths
6749 S Peoria Street, Chicago, IL 60621
MLS# 12582121Listed by: KALE REALTY $69,000Pending5 beds 2 baths1,450 sq. ft.
7329 S Carpenter Street, Chicago, IL 60621
MLS# 12582808Listed by: REAL BROKER, LLC $129,900Active0.52 Acres
6600 S Union Avenue, Chicago, IL 60621
MLS# 12582138Listed by: REAL PEOPLE REALTY $120,000Pending6 beds 2 baths
159 W 74th Street, Chicago, IL 60621
MLS# 12582146Listed by: JH GRAIL REALTY INC. $410,000Active4 beds 2 baths
111 W 74th Street, Chicago, IL 60621
MLS# 12569175Listed by: KALE REALTY $75,000Pending4 beds 2 baths909 sq. ft.
7248 S Green Street, Chicago, IL 60621
MLS# 12576610Listed by: REALTY OF AMERICA, LLC $365,000Pending6 beds 2 baths2,655 sq. ft.
7121 S Yale Avenue, Chicago, IL 60621
MLS# 12576549Listed by: HOMESMART REALTY GROUP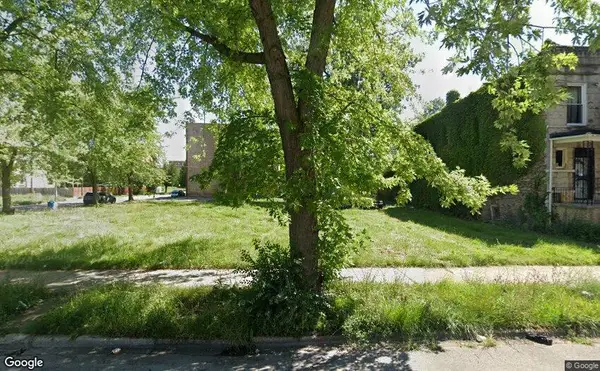 $55,000Active0 Acres
6407 S Morgan Street, Chicago, IL 60621
MLS# 12579793Listed by: SERENE REALTY, INC. $55,000Active0 Acres
6606 S Morgan Street, Chicago, IL 60621
MLS# 12579799Listed by: SERENE REALTY, INC.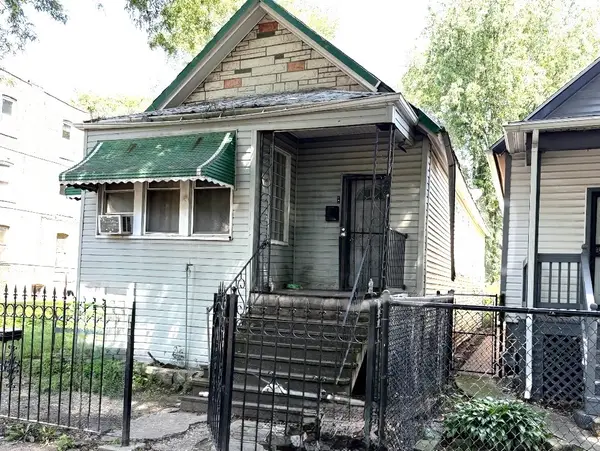 $150,000Active3 beds 2 baths1,050 sq. ft.
Address Withheld By Seller, Chicago, IL 60621
MLS# 12452238Listed by: EXP REALTY $250,000Active0 Acres
352 W 59th Street, Chicago, IL 60621
MLS# 12577957Listed by: EXP REALTY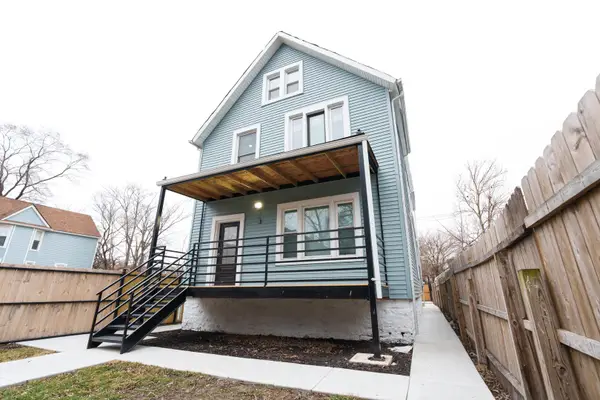 $304,900Active5 beds 2 baths
Address Withheld By Seller, Chicago, IL 60621
MLS# 12575285Listed by: KELLER WILLIAMS ONECHICAGO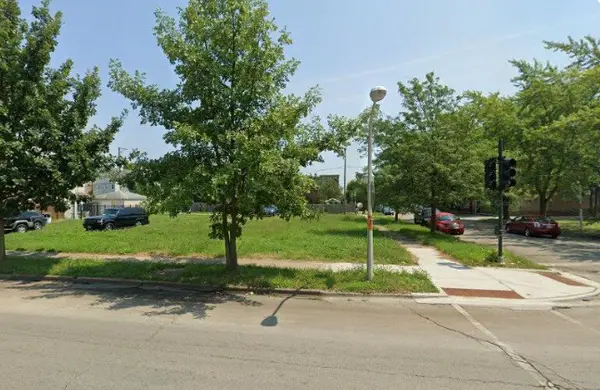 $55,000Active0 Acres
6359 S Morgan Street, Chicago, IL 60621
MLS# 12576688Listed by: SERENE REALTY, INC. $40,000Active0 Acres
5647 S Peoria Street, Chicago, IL 60621
MLS# 12576652Listed by: SERENE REALTY, INC.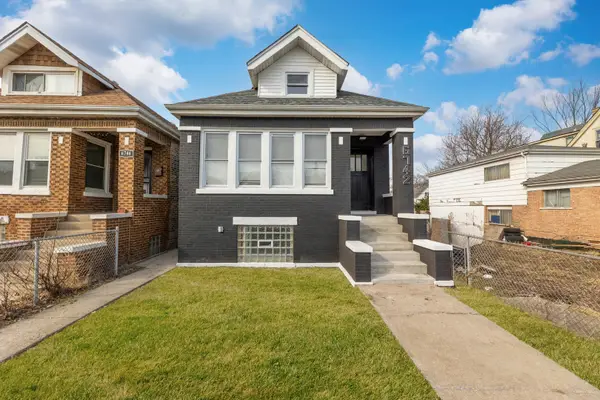 $344,999Active7 beds 3 baths1,600 sq. ft.
6742 S Carpenter Street, Chicago, IL 60621
MLS# 12575598Listed by: KELLER WILLIAMS ONECHICAGO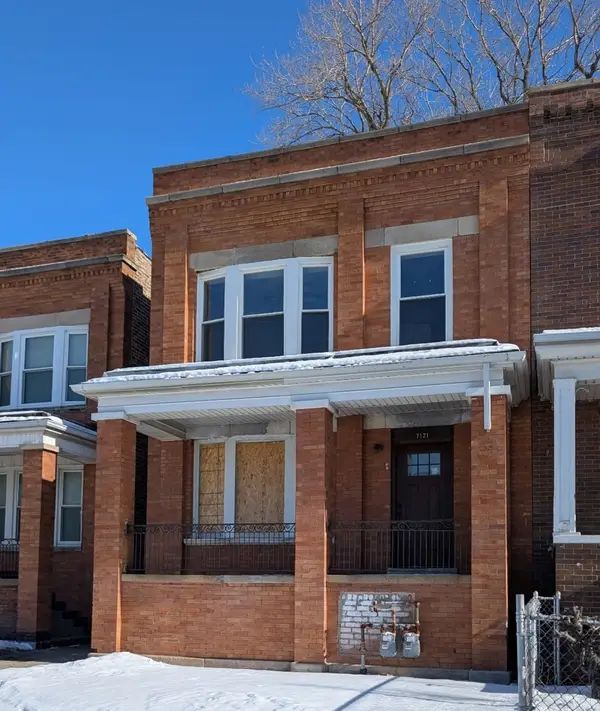 $315,000Active5 beds 2 baths
7121 S Perry Avenue, Chicago, IL 60621
MLS# 12574719Listed by: KELLER WILLIAMS ONECHICAGO $54,750Active6 beds 2 baths
636 W 62nd Street, Chicago, IL 60621
MLS# 12575407Listed by: CHOICE REALTY GROUP INC. $225,000Pending5 beds 2 baths1,896 sq. ft.
6042 S May Street, Chicago, IL 60621
MLS# 12574534Listed by: YUB REALTY INC $22,000Active0 Acres
6610 S Carpenter Street, Chicago, IL 60621
MLS# 12572766Listed by: LADEANA HILLEY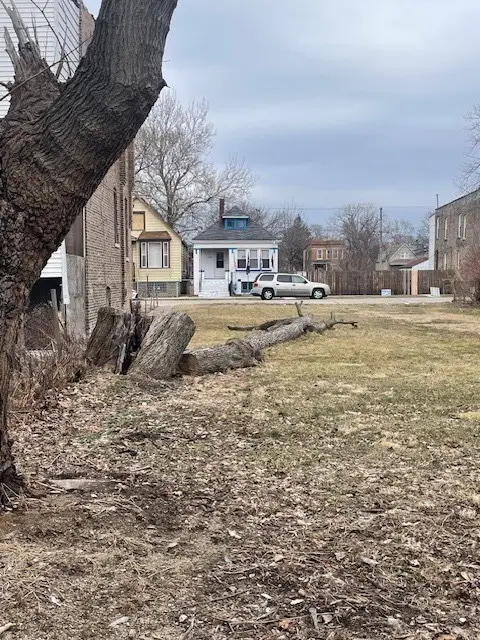 $22,000Active0 Acres
6608 S Carpenter Street, Chicago, IL 60621
MLS# 12574191Listed by: LADEANA HILLEY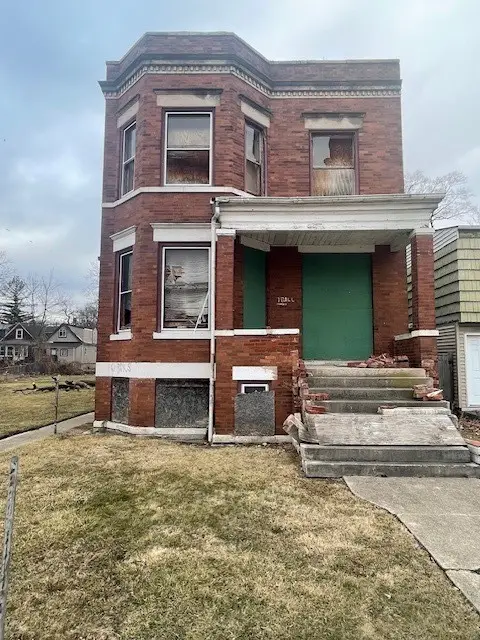 $86,000Active5 beds 2 baths
6606 S Carpenter Street, Chicago, IL 60621
MLS# 12574222Listed by: LADEANA HILLEY $189,900Active5 beds 3 baths
6833 S May Street, Chicago, IL 60621
MLS# 12573976Listed by: GOLDEN ENTERPRISE REALTY INC $399,999Pending9 beds 3 baths
5744 S Green Street, Chicago, IL 60621
MLS# 12567546Listed by: BAIRD & WARNER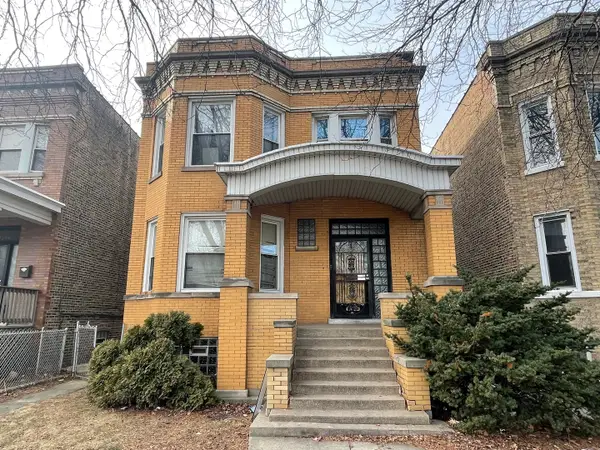 $449,999Active5 beds 2 baths
7254 S Lafayette Avenue, Chicago, IL 60621
MLS# 12573007Listed by: PEARSON REALTY GROUP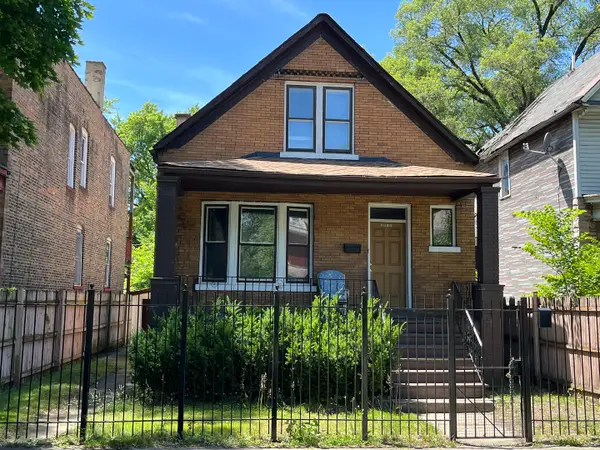 $235,000Pending7 beds 3 baths2,600 sq. ft.
6916 S Lowe Avenue, Chicago, IL 60621
MLS# 12567569Listed by: ARHOME REALTY $469,000Active6 beds 5 baths
7305 S Sangamon Street, Chicago, IL 60621
MLS# 12567490Listed by: RE/MAX 10 $133,000Active4 beds 2 baths
5538 S Perry Avenue, Chicago, IL 60621
MLS# 12566728Listed by: TRADEMARKS & ASSOCIATES $184,900Pending5 beds 2 baths1,254 sq. ft.
7157 S Sangamon Street, Chicago, IL 60621
MLS# 12566888Listed by: CENTURY 21 NEW BEGINNINGS $45,000Active0 Acres
7417 S Racine Avenue, Chicago, IL 60620
MLS# 12593636Listed by: REALTY OF AMERICA, LLC $99,900Pending6 beds 2 baths
5914 S Princeton Avenue, Chicago, IL 60621
MLS# 12561174Listed by: CHOICE REALTY GROUP INC.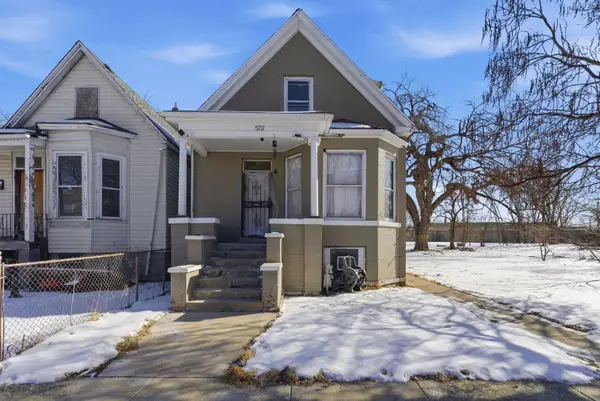 $170,000Pending5 beds 3 baths2,000 sq. ft.
5711 S Lowe Avenue, Chicago, IL 60621
MLS# 12564640Listed by: LUNA REALTY GROUP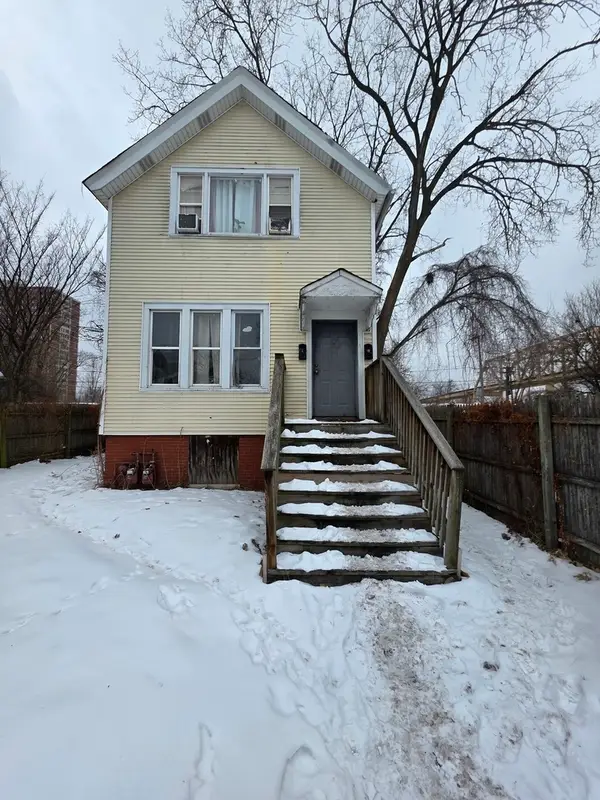 $135,000Active6 beds 2 baths
6342 S Parnell Avenue, Chicago, IL 60621
MLS# 12563778Listed by: VISIONS MANIFESTED REALTY LLC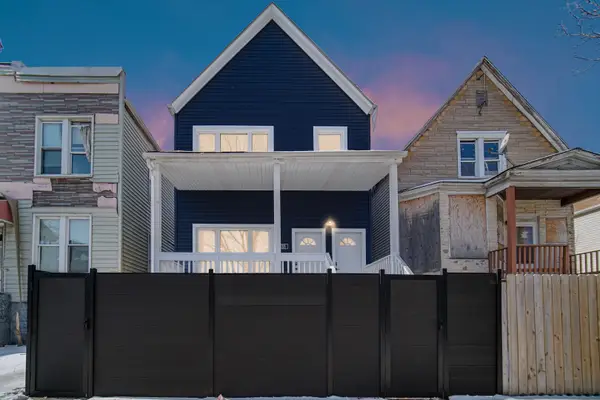 $414,999Pending7 beds 3 baths
7346 S Peoria Street, Chicago, IL 60621
MLS# 12562623Listed by: BLUE DOOR DAVE INC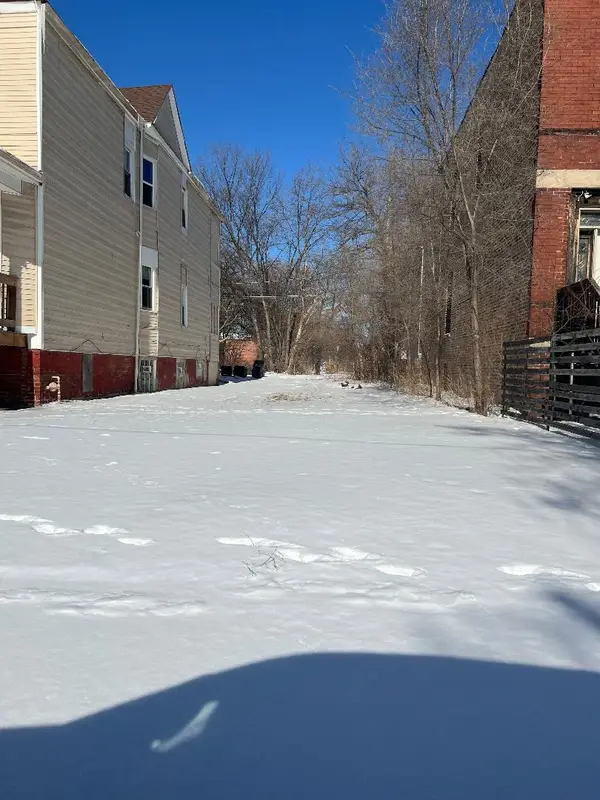 $45,000Active0 Acres
428 W 65th Place, Chicago, IL 60621
MLS# 12560764Listed by: RAMONA TURNER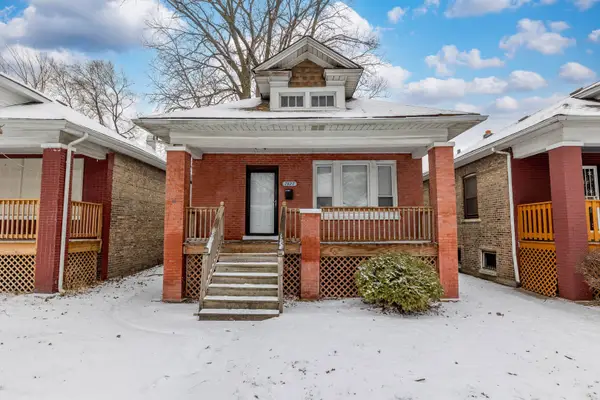 $189,000Active4 beds 2 baths1,081 sq. ft.
7427 S Perry Avenue, Chicago, IL 60621
MLS# 12552295Listed by: MCSULLY PROPERTIES LLC $379,900Active4 beds 3 baths1,260 sq. ft.
5552 S Shields Avenue, Chicago, IL 60621
MLS# 12559537Listed by: KELLER WILLIAMS ONECHICAGO $249,999Pending6 beds 2 baths
5624 S Lowe Avenue, Chicago, IL 60621
MLS# 12556621Listed by: FULTON GRACE REALTY $85,500Active3 beds 2 baths
6942 S Eggleston Avenue, Chicago, IL 60621
MLS# 12558113Listed by: RE/MAX PREMIER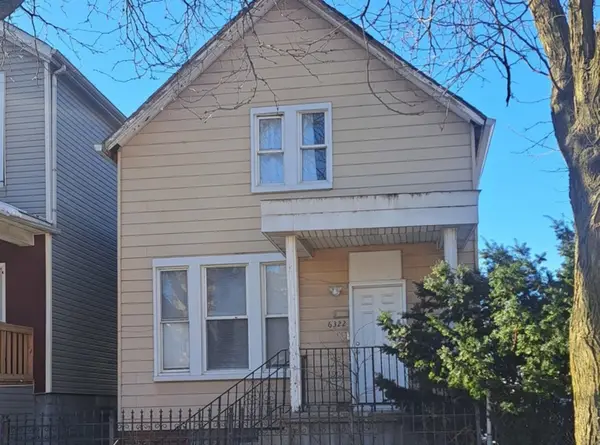 $265,000Pending8 beds 3 baths
6322 S Morgan Street, Chicago, IL 60621
MLS# 12542015Listed by: ALL NATIONS REALTY CHICAGO $250,000Pending3 beds 2 baths3,125 sq. ft.
6715 S Sangamon Street, Chicago, IL 60621
MLS# 12549759Listed by: CRUZ-MAGANA REALTY, LLC $24,999Active0 Acres
6107 S Sangamon Street, Chicago, IL 60621
MLS# 12522801Listed by: RE/MAX PREMIER $61,750Active5 beds 3 baths1,826 sq. ft.
6951 S Princeton Avenue, Chicago, IL 60621
MLS# 12547978Listed by: SU FAMILIA REAL ESTATE INC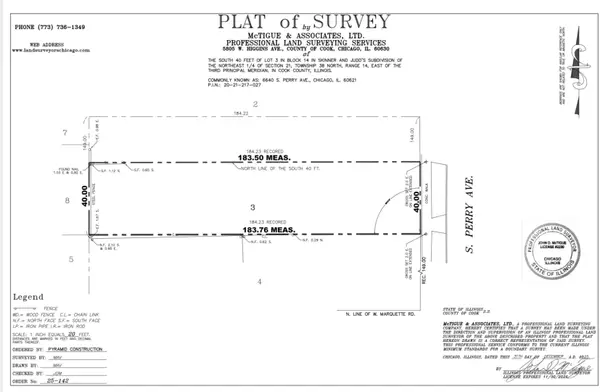 $32,500Active0 Acres
6640 S Perry Avenue, Chicago, IL 60621
MLS# 12548721Listed by: COLDWELL BANKER REALTY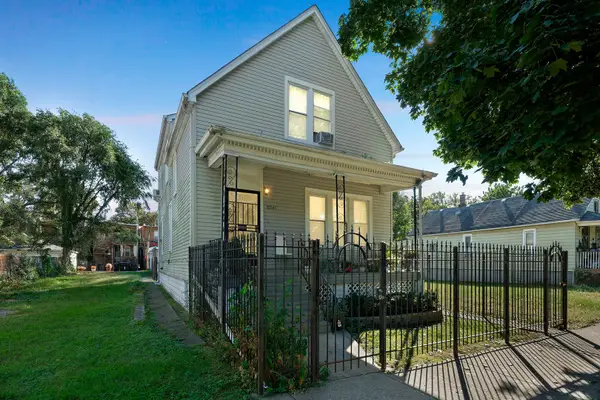 $250,000Active5 beds 3 baths3,081 sq. ft.
6541 S Carpenter Street, Chicago, IL 60621
MLS# 12520967Listed by: BERKSHIRE HATHAWAY HOMESERVICES CHICAGO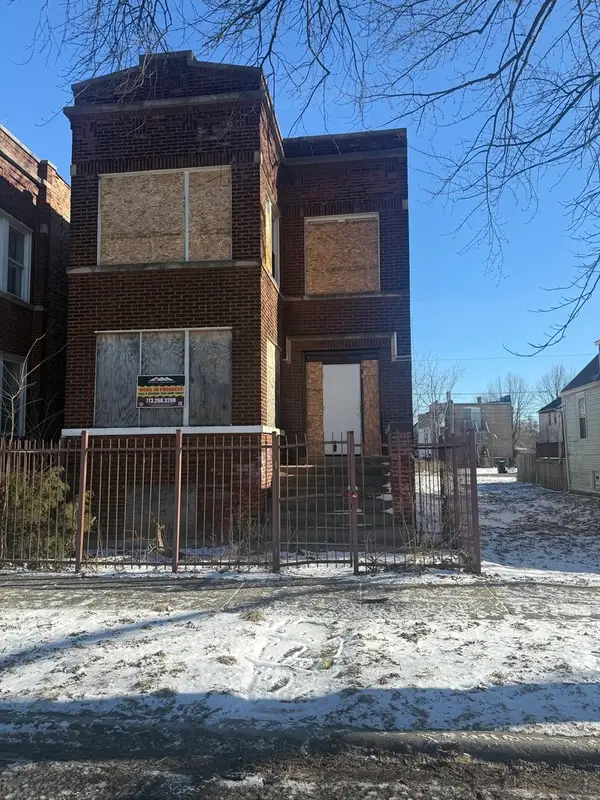 $125,000Active4 beds 2 baths
6345 S May Street, Chicago, IL 60621
MLS# 12548340Listed by: KM REALTY GROUP, LLC- Open Sat, 12 to 2pm
 $269,999Active4 beds 3 baths1,635 sq. ft.
5636 S Carpenter Street, Chicago, IL 60621
MLS# 12547219Listed by: COLDWELL BANKER REAL ESTATE GROUP 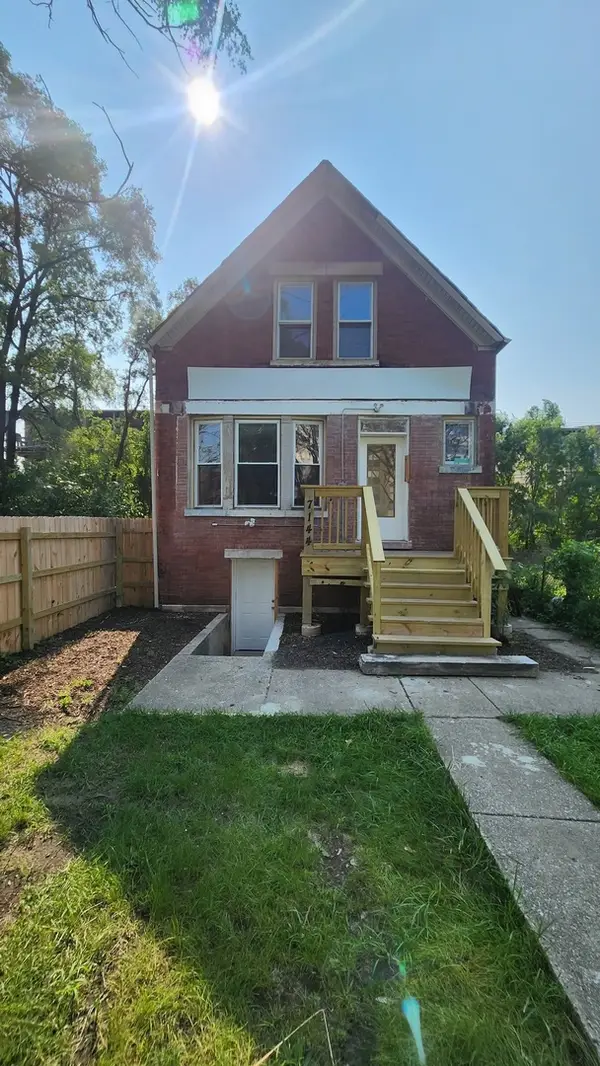 $199,000Active4 beds 2 baths
7144 S Wentworth Avenue, Chicago, IL 60621
MLS# 12546661Listed by: URBANITAS, INC.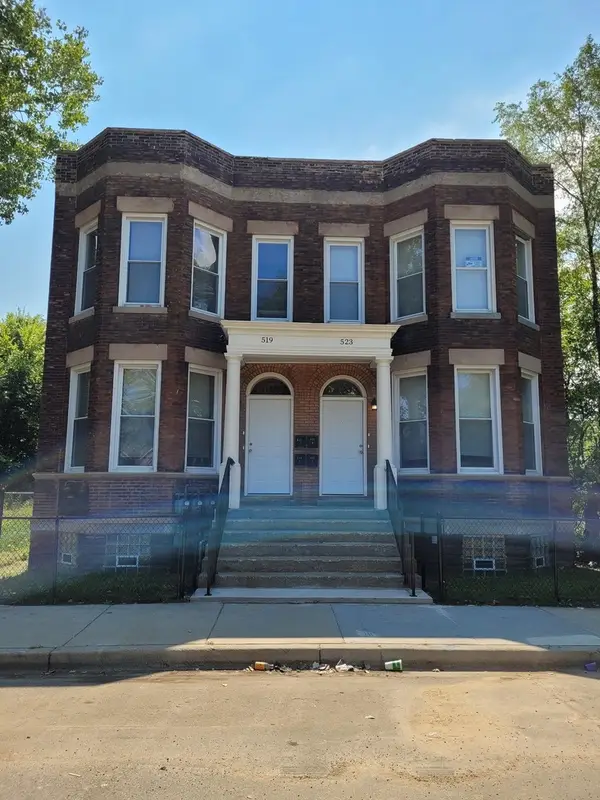 $595,000Pending8 beds 4 baths
523 W 65th Place, Chicago, IL 60621
MLS# 12546543Listed by: HALSTED TAYLOR REAL ESTATE $410,000Active11 beds 7 baths
7414 S Stewart Avenue, Chicago, IL 60621
MLS# 12530774Listed by: KELLER WILLIAMS PREFERRED RLTY $18,900Active0.07 Acres
7132 S Carpenter Street, Chicago, IL 60621
MLS# 12542277Listed by: READY PROPERTIES INC $45,000Active0 Acres
7040 S Parnell Avenue, Chicago, IL 60621
MLS# 12543019Listed by: O'SHEA REALTY, LLC $47,499Active0 Acres
6719 S Perry Avenue, Chicago, IL 60621
MLS# 12545200Listed by: COLDWELL BANKER REALTY $275,000Pending7 beds 3 baths
439 W 62nd Street, Chicago, IL 60621
MLS# 12545157Listed by: CALABASH REALTY INVESTMENT LLC $189,900Pending4 beds 2 baths1,068 sq. ft.
5944 S Princeton Avenue, Chicago, IL 60621
MLS# 12540973Listed by: REAL ESTATE GROWTH PARTNERS $29,900Active0 Acres
814 W Marquette Road, Chicago, IL 60621
MLS# 12541782Listed by: COMPASS $29,900Active0 Acres
816 W Marquette Road, Chicago, IL 60621
MLS# 12541792Listed by: COMPASS $245,000Active5 beds 3 baths954 sq. ft.
906 W 71st Street, Chicago, IL 60621
MLS# 12538948Listed by: NEW HOPE REALTY GROUP, INC. $225,000Pending5 beds 3 baths1,250 sq. ft.
7318 S Aberdeen Street, Chicago, IL 60621
MLS# 12542020Listed by: RAE LYNN REALTY LLC $15,000Active0 Acres
6231-35 S Morgan Street, Chicago, IL 60621
MLS# 12544395Listed by: AVENUE 1 REALTY GROUP $129,000Active0 Acres
1000 W Marquette Road, Chicago, IL 60621
MLS# 12544588Listed by: GUIDANCE REALTY $69,900Active6 beds 2 baths
6835 S Green Street, Chicago, IL 60621
MLS# 12541824Listed by: DIGITAL REALTY $250,000Active4 beds 2 baths1,200 sq. ft.
Address Withheld By Seller, Chicago, IL 60621
MLS# 12543462Listed by: SU FAMILIA REAL ESTATE INC $179,000Active5 beds 2 baths
531 W 61st Place, Chicago, IL 60621
MLS# 12535633Listed by: JAMES GROUP PROPERTIES LLC- $40,000Active0 Acres
5956 S Sangamon Street, Chicago, IL 60621
MLS# 12533728Listed by: CHARLES RUTENBERG REALTY  $65,000Pending2 beds 2 baths
Address Withheld By Seller, Chicago, IL 60621
MLS# 12524351Listed by: KELLER WILLIAMS ONECHICAGO $225,000Pending7 beds 2 baths
7438 S Stewart Avenue, Chicago, IL 60621
MLS# 12527592Listed by: ILLINOIS REAL ESTATE PARTNERS $209,000Active6 beds 2 baths
5757 S Carpenter Street, Chicago, IL 60621
MLS# 12530508Listed by: INTELLECTUAL REAL ESTATE SERVICES AND INVESTMENTS $180,000Pending5 beds 2 baths
6124 S Sangamon Street, Chicago, IL 60621
MLS# 12530242Listed by: RE/MAX IN THE VILLAGE $88,250Active4 beds 2 baths1,670 sq. ft.
5633 S Sangamon Street, Chicago, IL 60621
MLS# 12529023Listed by: SR REALTY GROUP INC.- $25,000Pending0.04 Acres
6649 S Parnell Avenue, Chicago, IL 60621
MLS# 12529135Listed by: EXIT STRATEGY REALTY  $95,000Active5 beds 3 baths
6554 S Stewart Avenue, Chicago, IL 60621
MLS# 12528183Listed by: EXP REALTY- $20,000Active0 Acres
523 W 60th Place, Chicago, IL 60621
MLS# 12526764Listed by: BARNES & ASSOCIATES GROUP - $20,000Active0 Acres
518 W 60th Place, Chicago, IL 60621
MLS# 12526747Listed by: BARNES & ASSOCIATES GROUP - $20,000Active0 Acres
519 W 60th Place, Chicago, IL 60621
MLS# 12526754Listed by: BARNES & ASSOCIATES GROUP  $39,000Active5 beds 3 baths
7116 S Lafayette Avenue, Chicago, IL 60621
MLS# 12524797Listed by: CHOICE REALTY GROUP INC. $110,000Active2 beds 1 baths897 sq. ft.
6731 S Aberdeen Street, Chicago, IL 60621
MLS# 12548514Listed by: BERKSHIRE HATHAWAY HOMESERVICES CHICAGO $124,900Pending4 beds 2 baths1,704 sq. ft.
7331 S Carpenter Street, Chicago, IL 60621
MLS# 12514712Listed by: BAIRD & WARNER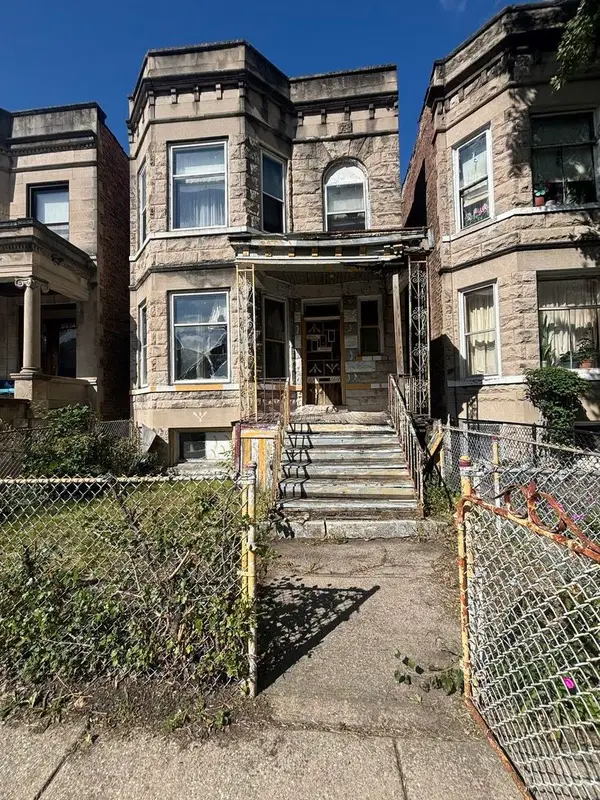 $100,000Active5 beds 2 baths
6932 S Eggleston Avenue, Chicago, IL 60621
MLS# 12536665Listed by: KALE REALTY $15,000Active0 Acres
6418 S Sangamon Street, Chicago, IL 60621
MLS# 12511869Listed by: COLDWELL BANKER REALTY $125,000Active0 Acres
6901 S Wentworth Avenue, Chicago, IL 60621
MLS# 12511362Listed by: FIRST CAPITAL REALTORS $85,000Active0 Acres
5619 S Perry Avenue, Chicago, IL 60621
MLS# 12510439Listed by: RE/MAX 10 IN THE PARK $85,000Active0 Acres
5615 S Perry Avenue, Chicago, IL 60621
MLS# 12510442Listed by: RE/MAX 10 IN THE PARK $85,000Active0 Acres
5617 S Perry Avenue, Chicago, IL 60621
MLS# 12510448Listed by: RE/MAX 10 IN THE PARK $296,999Active7 beds 3 baths1,970 sq. ft.
6843 S Carpenter Street, Chicago, IL 60621
MLS# 12500215Listed by: COMPASS $174,900Active4 beds 2 baths
7216 S Green Street, Chicago, IL 60621
MLS# 12509081Listed by: MANIFEST HOMES CORPORATION $255,000Pending5 beds 2 baths861 sq. ft.
6827 S Green Street, Chicago, IL 60621
MLS# 12507089Listed by: NEW HOPE REALTY GROUP, INC. $29,999Active0 Acres
6716 S Parnell Avenue, Chicago, IL 60621
MLS# 12506811Listed by: RE/MAX PREMIER $29,999Active0 Acres
7455 S Parnell Avenue, Chicago, IL 60621
MLS# 12506833Listed by: RE/MAX PREMIER $315,000Active3 beds 4 baths1,911 sq. ft.
7019 S Union Street, Chicago, IL 60621
MLS# 12483286Listed by: RE/MAX 10 $19,999Active0 Acres
1050 W 57th Street, Chicago, IL 60621
MLS# 12506105Listed by: RE/MAX PREMIER- $1,000Active0 Acres
6011 S La Salle Street, Chicago, IL 60621
MLS# 12502730Listed by: AMERICAN INTERNATIONAL REALTY  $160,000Pending5 beds 2 baths
7348 S Lowe Avenue, Chicago, IL 60621
MLS# 12502614Listed by: COLDWELL BANKER REALTY $199,900Pending6 beds 2 baths
7352 S Lowe Avenue, Chicago, IL 60621
MLS# 12502203Listed by: PARKVUE REALTY CORPORATION $200,000Active5 beds 2 baths
6815 S Green Street, Chicago, IL 60621
MLS# 12465337Listed by: COLDWELL BANKER REALTY $199,900Pending5 beds 2 baths1,254 sq. ft.
7157 S Sangamon Street, Chicago, IL 60621
MLS# 12495465Listed by: CENTURY 21 NEW BEGINNINGS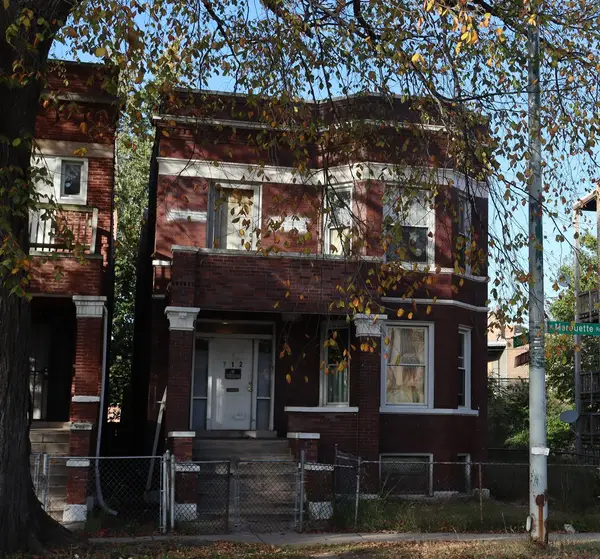 $189,900Pending5 beds 2 baths
712 W Marquette Road, Chicago, IL 60621
MLS# 12498646Listed by: RE/MAX 10 $24,999Active0 Acres
5831 S Carpenter Street, Chicago, IL 60621
MLS# 12498618Listed by: RE/MAX PREMIER $205,000Pending5 beds 2 baths
6018 S Sangamon Avenue, Chicago, IL 60621
MLS# 12497683Listed by: UPRIGHT REALTY $260,000Active6 beds 2 baths
6833 S Green Street, Chicago, IL 60621
MLS# 12493870Listed by: COLDWELL BANKER REALTY $85,000Active6 beds 2 baths
7243 S Sangamon Street, Chicago, IL 60621
MLS# 12493735Listed by: HOMESMART CONNECT LLC $212,000Active6 beds 3 baths
415 W 62nd Street, Chicago, IL 60621
MLS# 12486615Listed by: REAL PEOPLE REALTY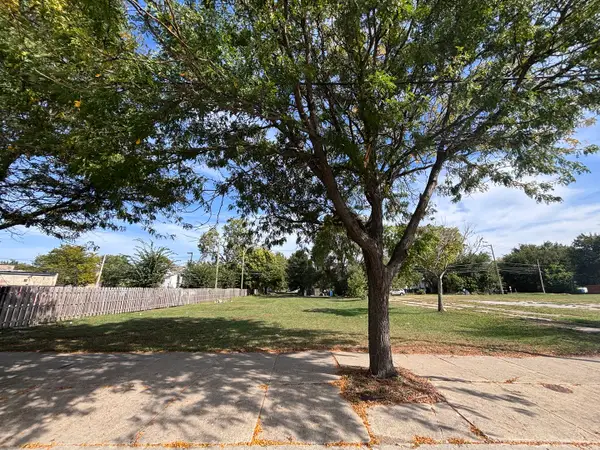 $150,000Active1.84 Acres
5713-15 S State Street, Chicago, IL 60621
MLS# 12481045Listed by: RE-CHRG INC $300,000Active0.37 Acres
5721 S State Street, Chicago, IL 60621
MLS# 12481099Listed by: RE-CHRG INC $225,000Active0 Acres
5731-41 S State Street, Chicago, IL 60621
MLS# 12481106Listed by: RE-CHRG INC $119,999Active0 Acres
6844 S May Street, Chicago, IL 60621
MLS# 12484843Listed by: RE/MAX PREMIER $100,000Pending4 beds 2 baths1,624 sq. ft.
7335 S Morgan Street, Chicago, IL 60621
MLS# 12479906Listed by: EXP REALTY $104,000Active5 beds 2 baths
6317 S Morgan Street, Chicago, IL 60621
MLS# 12479146Listed by: RE/MAX 10 $175,000Active5 beds 2 baths1,548 sq. ft.
6732 S Peoria Street, Chicago, IL 60621
MLS# 12478305Listed by: EXP REALTY - CHICAGO NORTH AVE $295,000Pending4 beds 2 baths
5514 S May Street, Chicago, IL 60621
MLS# 12565277Listed by: SUE DODGE & ASSOCIATES $99,900Pending6 beds 3 baths2,428 sq. ft.
6700 S Stewart Avenue, Chicago, IL 60621
MLS# 12529169Listed by: RE/MAX MI CASA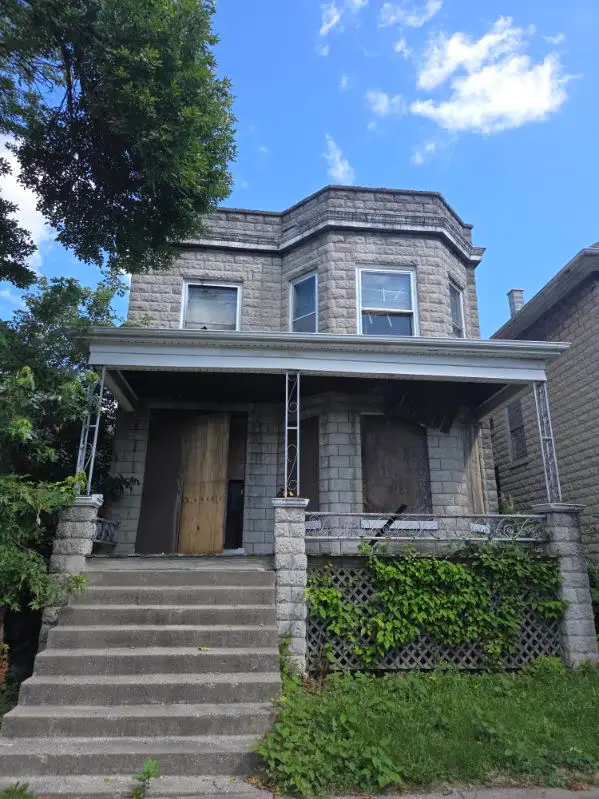 $79,900Pending7 beds 3 baths
7137 S Carpenter Street, Chicago, IL 60621
MLS# 12465268Listed by: CHOICE REALTY GROUP INC. $80,000Active0 Acres
6036 S Wallace Street, Chicago, IL 60621
MLS# 12460055Listed by: CAROL A. HOLLAND $69,500Active4 beds 2 baths
6711 S Union Avenue, Chicago, IL 60621
MLS# 12456452Listed by: CHOICE REALTY GROUP INC.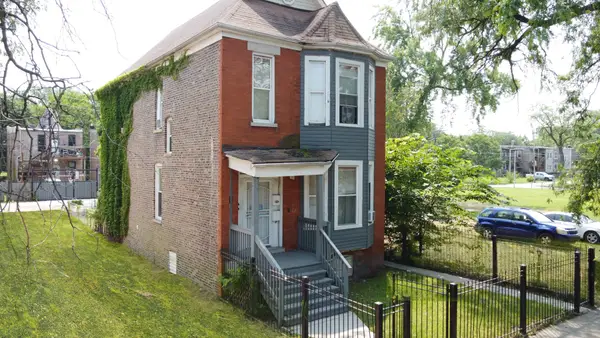 $260,000Active6 beds 2 baths
5641 S Morgan Street, Chicago, IL 60621
MLS# 12442037Listed by: TADD REALTY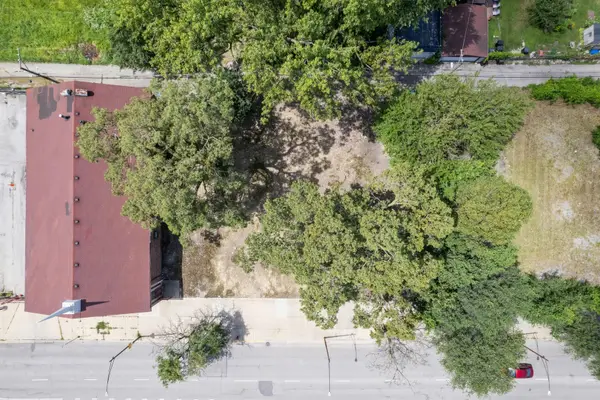 $25,000Active0 Acres
5632 S State Street, Chicago, IL 60621
MLS# 12564660Listed by: BERKSHIRE HATHAWAY HOMESERVICES CHICAGO $59,000Active0 Acres
6008 S Princeton Avenue, Chicago, IL 60621
MLS# 12433663Listed by: REALTY OF AMERICA, LLC $79,000Active0 Acres
6000 S Princeton Avenue, Chicago, IL 60621
MLS# 12433500Listed by: REALTY OF AMERICA, LLC $15,000Active0.07 Acres
5720 S Carpenter Street, Chicago, IL 60621
MLS# 12426284Listed by: RE/MAX 10 $60,000Active5 beds 2 baths
5802 S May Street, Chicago, IL 60621
MLS# 12407990Listed by: SELECT A FEE RE SYSTEM $244,900Pending9 beds 3 baths
6522 S Peoria Street, Chicago, IL 60621
MLS# 12399441Listed by: KALE REALTY $20,000Active0 Acres
7210 S Wentworth Avenue, Chicago, IL 60621
MLS# 12362865Listed by: GREENSAFE REAL ESTATE & CONSULT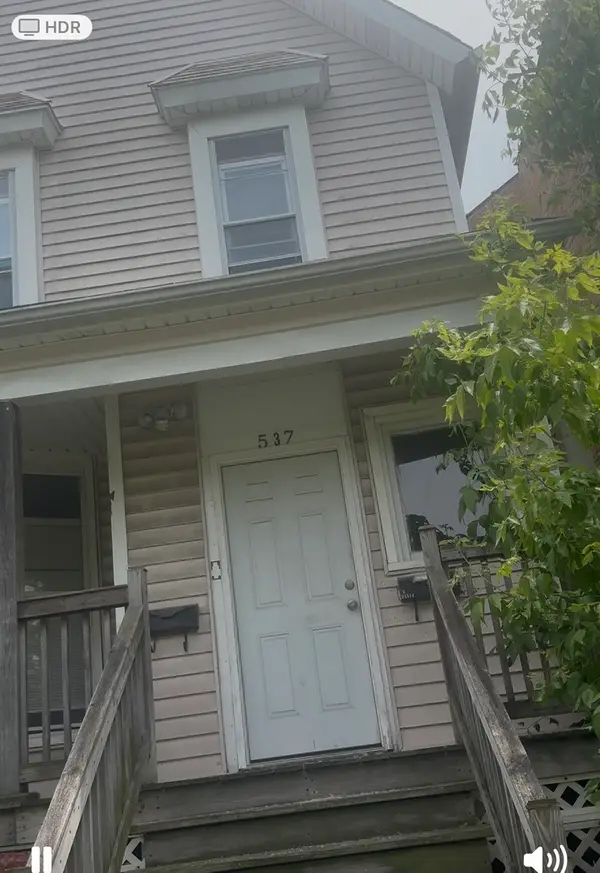 $174,000Active6 beds 2 baths
537 W 61st Place, Chicago, IL 60621
MLS# 12395242Listed by: SMART HOME REALTY $150,000Pending6 beds 2 baths
Address Withheld By Seller, Chicago, IL 60621
MLS# 12583990Listed by: COLDWELL BANKER REALTY $189,999Active5 beds 2 baths
7142 S Lowe Avenue, Chicago, IL 60621
MLS# 12390570Listed by: TURN KEY REALTY SOLUTIONS $149,900Active5 beds 2 baths1,489 sq. ft.
5604 S Morgan Street, Chicago, IL 60621
MLS# 12392175Listed by: CORE REALTY & INVESTMENTS INC. $210,000Pending6 beds 2 baths
7414 S Princeton Avenue, Chicago, IL 60621
MLS# 12384377Listed by: HOUSE 2 HOME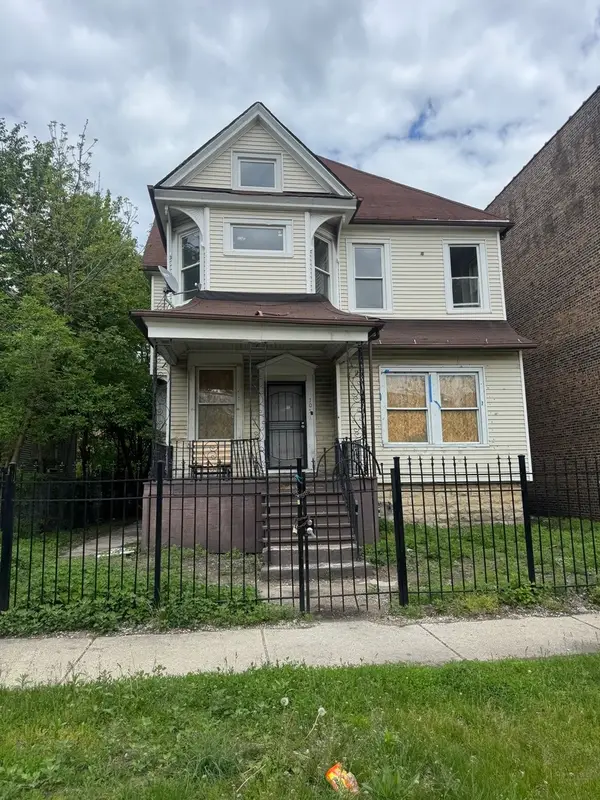 $150,000Active9 beds 2 baths2,800 sq. ft.
7051 S Princeton Avenue, Chicago, IL 60621
MLS# 12370798Listed by: SMART HOME REALTY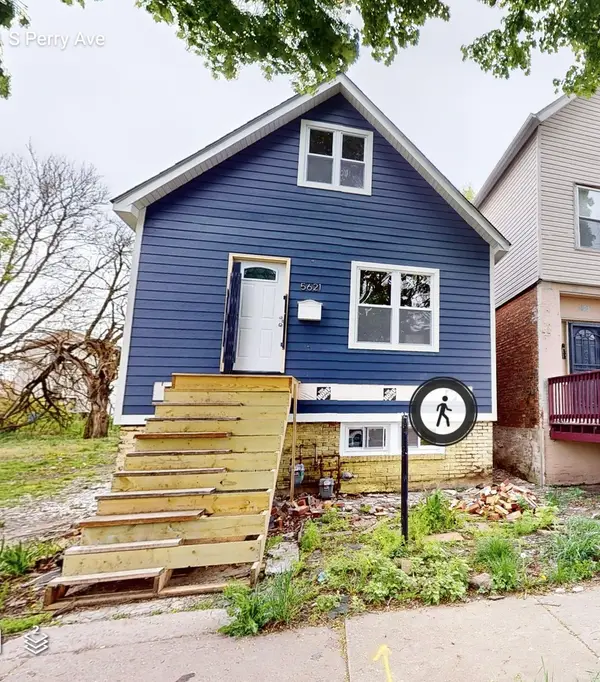 $280,000Active4 beds 2 baths2,352 sq. ft.
5621 S Perry Avenue, Chicago, IL 60621
MLS# 12361995Listed by: EXP REALTY $89,000Active0 Acres
5533-5537 S State Street, Chicago, IL 60621
MLS# 12359376Listed by: @PROPERTIES CHRISTIE'S INTERNATIONAL REAL ESTATE $10,000Active0 Acres
5918 S Peoria Street, Chicago, IL 60621
MLS# 12359234Listed by: AVENUE 1 REALTY GROUP $9,000Pending0 Acres
910 W Marquette Road, Chicago, IL 60621
MLS# 12359254Listed by: AVENUE 1 REALTY GROUP $12,000Active0 Acres
6331 S Aberdeen Street, Chicago, IL 60636
MLS# 12359315Listed by: AVENUE 1 REALTY GROUP $19,900Pending0 Acres
7012-7014 S Stewart Avenue, Chicago, IL 60621
MLS# 12359198Listed by: AVENUE 1 REALTY GROUP $19,900Pending0 Acres
533 W 62nd Street, Chicago, IL 60621
MLS# 12345096Listed by: AVENUE 1 REALTY GROUP $57,500Active3 beds 1 baths880 sq. ft.
7144 S May Street, Chicago, IL 60621
MLS# 12344502Listed by: RE/MAX PREMIER $129,000Active3 beds 2 baths851 sq. ft.
7431 S Perry Avenue, Chicago, IL 60621
MLS# 12505371Listed by: MATCHMAKER PROPERTY SOLUTIONS,LLC $49,500Active0 Acres
542 W 60th Street, Chicago, IL 60621
MLS# 12596223Listed by: KENWOOD REALTY GROUP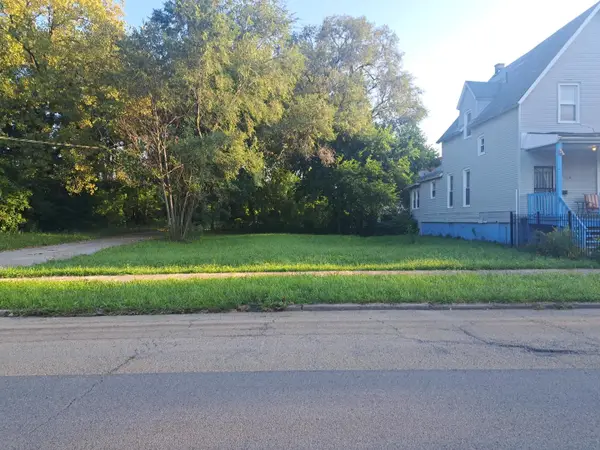 $85,000Active0 Acres
540 W 60th Street, Chicago, IL 60621
MLS# 12596225Listed by: KENWOOD REALTY GROUP $99,500Active0 Acres
439 W 60th Place, Chicago, IL 60621
MLS# 12596227Listed by: KENWOOD REALTY GROUP $99,500Active0 Acres
534 W 60th Street, Chicago, IL 60621
MLS# 12596228Listed by: KENWOOD REALTY GROUP- $79,500Active0 Acres
451 W 60th Place, Chicago, IL 60621
MLS# 12596224Listed by: KENWOOD REALTY GROUP  $99,500Active0 Acres
433 W 60th Place, Chicago, IL 60621
MLS# 12596226Listed by: KENWOOD REALTY GROUP $119,000Pending7 beds 2 baths
7233 S Sangamon Street, Chicago, IL 60621
MLS# 12305408Listed by: NORTH CLYBOURN GROUP, INC. $20,000Active0 Acres
6332 S Eggleston Avenue, Chicago, IL 60621
MLS# 12571863Listed by: KELLER WILLIAMS PREFERRED REALTY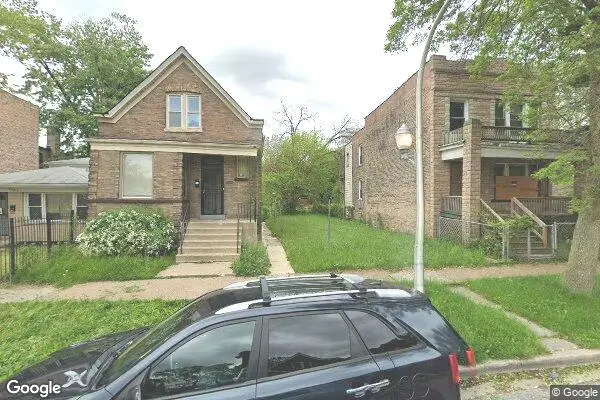 $6,000Pending0 Acres
Address Withheld By Seller, Chicago, IL 60621
MLS# 12295042Listed by: CENTURY 21 IMPACT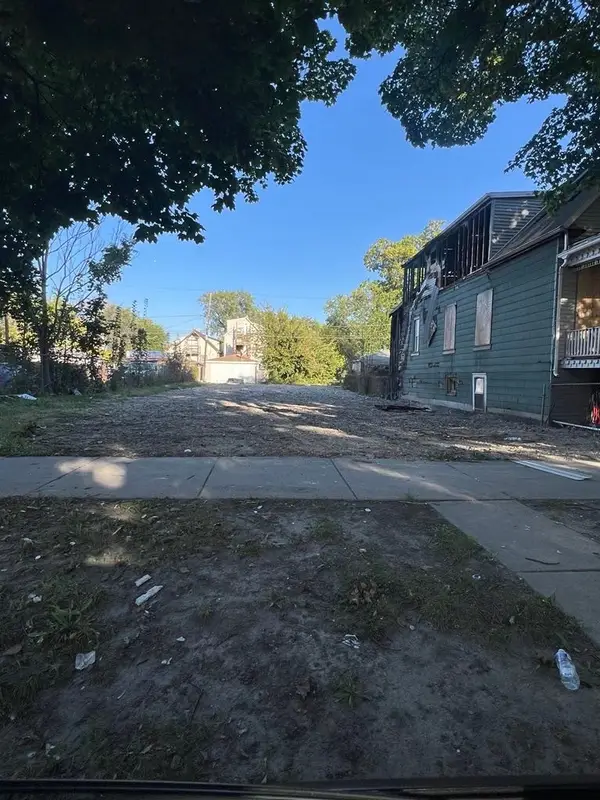 $15,000Active0.07 Acres
5935 S Carpenter Street, Chicago, IL 60621
MLS# 12569392Listed by: REALTY OF AMERICA, LLC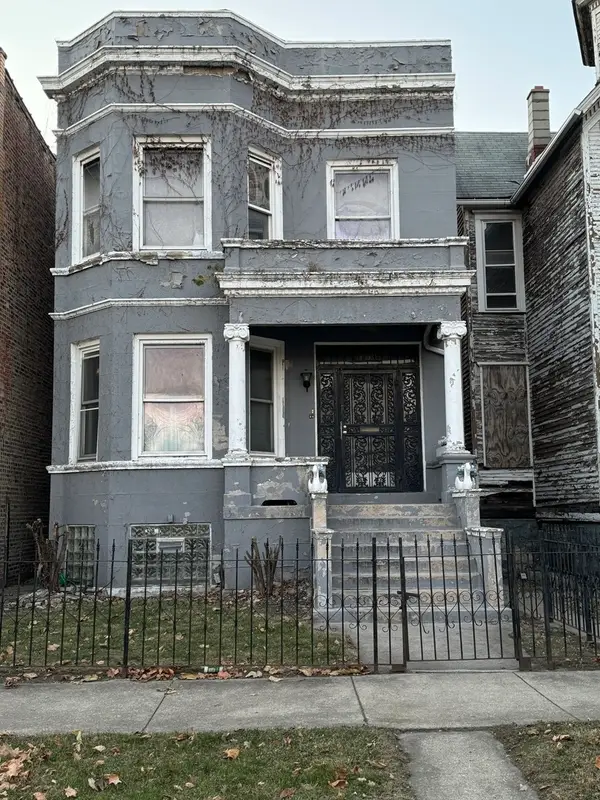 $100,000Pending5 beds 3 baths
6428 S Sangamon Street, Chicago, IL 60621
MLS# 12218526Listed by: F.J. WILLIAMS REALTY LLC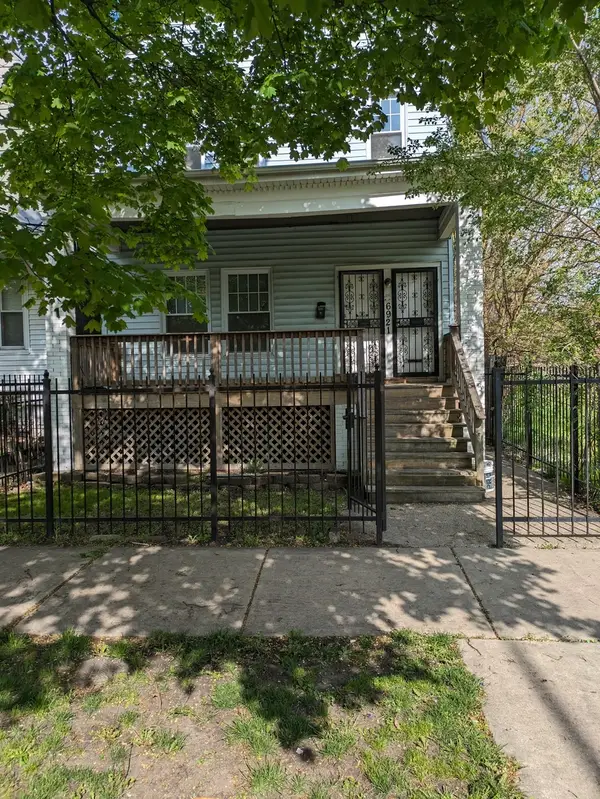 $170,000Active5 beds 2 baths
6921 S Normal Boulevard, Chicago, IL 60621
MLS# 12059572Listed by: MANAGE CHICAGO, INC. $79,900Active4 beds 1 baths1,406 sq. ft.
6706 S Parnell Avenue, Chicago, IL 60621
MLS# 12530290Listed by: VILLAGE REALTY, INC. $295,000Active1.49 Acres
7000 S Aberdeen Street, Chicago, IL 60621
MLS# 11988525Listed by: CENTURY 21 CIRCLE- $29,800Active0 Acres
5730 S May Street, Chicago, IL 60621
MLS# 06788228Listed by: LIFESTYLE PROPERTIES - $36,800Active0 Acres
538 W 61st Street, Chicago, IL 60621
MLS# 06788417Listed by: LIFESTYLE PROPERTIES
Local realty services provided by:CENTURY 21 All Pro Real Estate
Copyright 2026 Midwest Real Estate Data LLC. All rights reserved. The data relating to real estate for sale on this web site comes in part from the Broker Reciprocity Program of the Midwest Real Estate Data LLC. Listing information is deemed reliable but not guaranteed.
Popular searches near 60621
Popular neighborhoods near 60621
- Auburn Gresham, Chicago homes for sale
- Avalon Park, Chicago homes for sale
- Bronzeville, Chicago homes for sale
- Canaryville, Chicago homes for sale
- Chatham, Chicago homes for sale
- Chicago Lawn, Chicago homes for sale
- Englewood, Chicago homes for sale
- Fuller Park, Chicago homes for sale
- Garage Park, Chicago homes for sale
- Grand Boulevard, Chicago homes for sale
- Grand Crossing, Chicago homes for sale
- Hyde Park, Chicago homes for sale
- Kenwood, Chicago homes for sale
- New City, Chicago homes for sale
- North Kenwood, Chicago homes for sale
- South Shore, Chicago homes for sale
- South Side, Chicago homes for sale
- Washington Park, Chicago homes for sale
- West Chesterfield, Chicago homes for sale
- Woodlawn, Chicago homes for sale
Counties near Chicago, 60621
- Berrien County homes for sale
- Cook County homes for sale
- DeKalb County homes for sale
- DuPage County homes for sale
- Grundy County homes for sale
- Jasper County homes for sale
- Kane County homes for sale
- Kankakee County homes for sale
- Kendall County homes for sale
- Kenosha County homes for sale
- Lake County homes for sale
- Lake County homes for sale
- LaPorte County homes for sale
- McHenry County homes for sale
- Newton County homes for sale
- Porter County homes for sale
- Pulaski County homes for sale
- Racine County homes for sale
- Starke County homes for sale
- Will County homes for sale
Protect your home and budget from life's surprises with an Assurant Home Warranty, backed by a partner that supports you through every step of homeownership. Explore Plans.
©2026 Century 21 Real Estate LLC. All rights reserved. CENTURY 21®, the CENTURY 21 Logo and C21® are service marks owned by Century 21 Real Estate LLC. Century 21 Real Estate LLC fully supports the principles of the Fair Housing Act and the Equal Opportunity Act. Each office is independently owned and operated. Listing information is deemed reliable but not guaranteed accurate.