- Anaheim Hills homes for sale
- Brea homes for sale
- Chino homes for sale
- Chino Hills homes for sale
- Diamond Bar homes for sale
- East San Gabriel Valley homes for sale
- Eastvale homes for sale
- Jurupa homes for sale
- Montclair homes for sale
- Norco homes for sale
- Ontario homes for sale
- Phillips Ranch homes for sale
- Placentia homes for sale
- Pomona homes for sale
- Rowland Heights homes for sale
- South San Jose Hills homes for sale
- Villa Park homes for sale
- Walnut homes for sale
- West Covina homes for sale
- Yorba Linda homes for sale
91709, CA - homes for sale
174 of 174 results displayed
- New
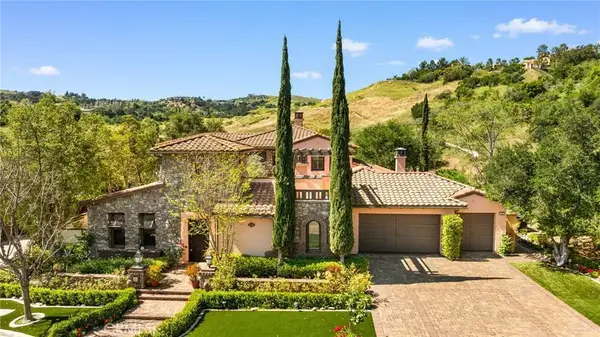
 $1,395,000Active3 beds 3 baths1,972 sq. ft.
3710 Terrace, Chino Hills, CA 91709
MLS# TR26064107Listed by: KELLER WILLIAMS RIVERSIDE - Open Sun, 12 to 3pmNew
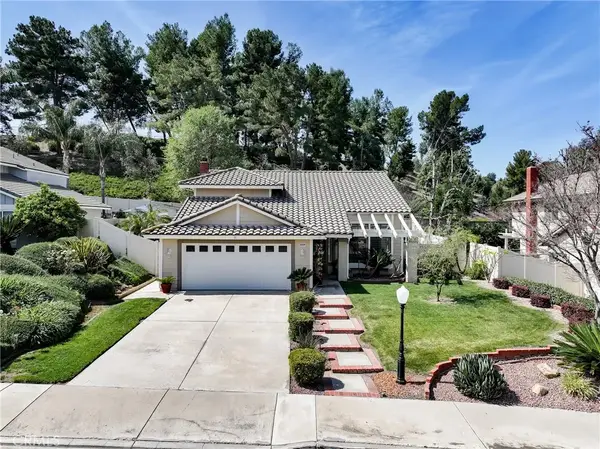
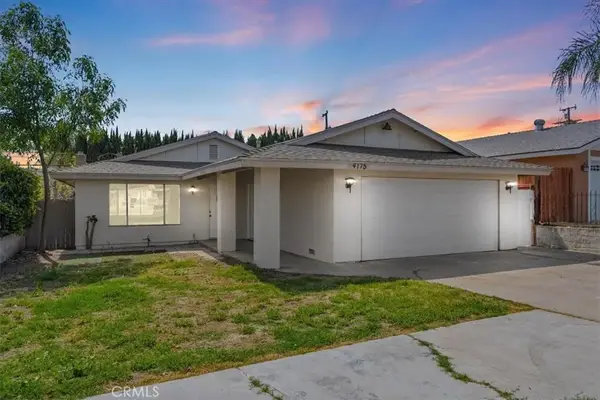 $682,000Active3 beds 2 baths1,376 sq. ft.
4175 Gird Avenue, Chino Hills, CA 91709
MLS# CV26062741Listed by: EXP REALTY OF CALIFORNIA INC - Open Sat, 3:30 to 5:30pmNew
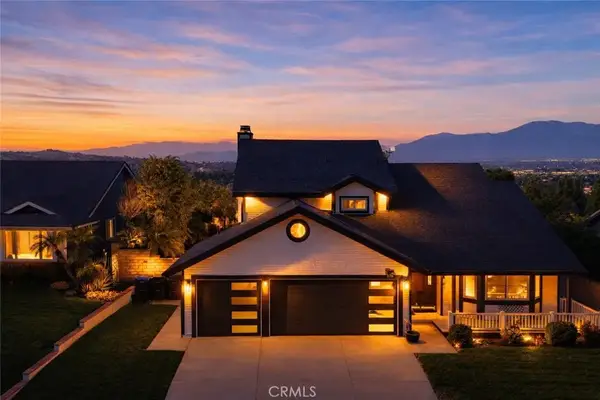
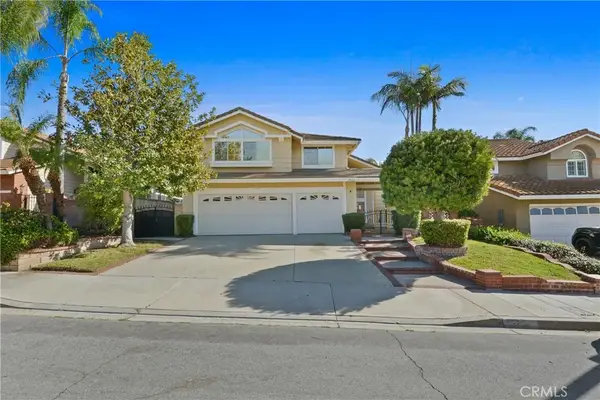
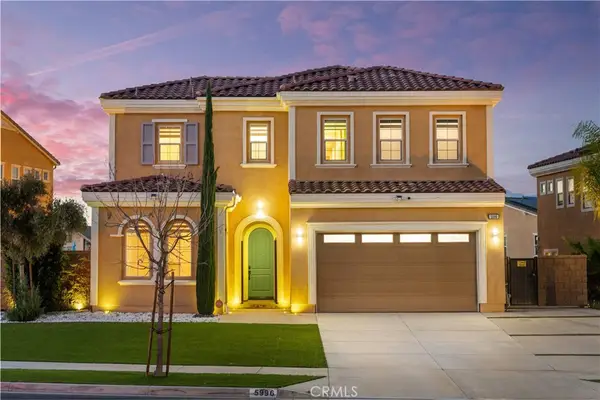 $2,058,000Active5 beds 5 baths3,791 sq. ft.
5996 Porto Street, Chino Hills, CA 91709
MLS# CV26022572Listed by: RE/MAX MASTERS REALTY - Open Fri, 3:30 to 6pmNew
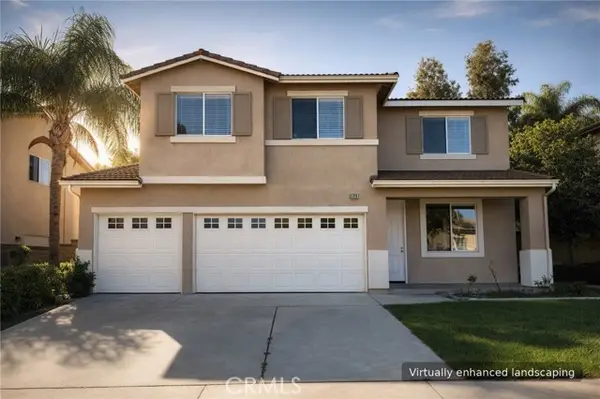
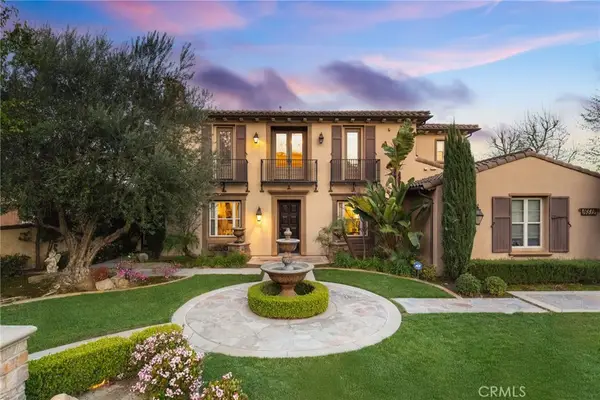 $2,880,000Active5 beds 6 baths4,937 sq. ft.
16519 Vellano Club Drive, Chino Hills, CA 91709
MLS# CV26044219Listed by: RE/MAX MASTERS REALTY - Open Fri, 3:30 to 6pmNew
 $3,388,000Active4 beds 5 baths5,432 sq. ft.
3168 Roma Court, Chino Hills, CA 91709
MLS# CV26058773Listed by: RE/MAX MASTERS REALTY - New
 $978,888Active3 beds 3 baths1,731 sq. ft.
3684 Hillsdale Ranch Road, Chino Hills, CA 91709
MLS# TR26053816Listed by: ADVANTAGE REAL ESTATE - New
 $1,199,000Active5 beds 3 baths2,631 sq. ft.
18003 Via La Cresta, Chino Hills, CA 91709
MLS# TR26062394Listed by: FURSTENBERG REALTY - New
 $1,060,000Active5 beds 3 baths2,283 sq. ft.
5661 Sagebrush, Chino Hills, CA 91709
MLS# CRTR26062666Listed by: UNIVERSAL ELITE INC. - New
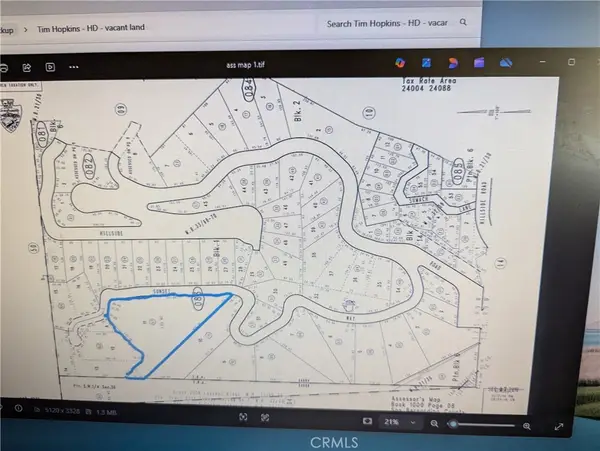 $315,000Active1.23 Acres
16766 Sunset Way, Chino Hills, CA 91709
MLS# CV26061671Listed by: HOMEQUEST REAL ESTATE - Open Sat, 2 to 4pmNew
 $1,090,000Active4 beds 4 baths1,966 sq. ft.
14006 Plum Hollow, Chino Hills, CA 91709
MLS# WS26061664Listed by: BLUE SKY REALTY & MGMT INC - New
 $1,488,000Active5 beds 3 baths3,267 sq. ft.
14396 Pleasant Hill Dr, Chino Hills, CA 91709
MLS# TR26060693Listed by: HOMEQUEST REAL ESTATE - New
 $3,190,000Active5 beds 6 baths5,310 sq. ft.
16726 Catena, Chino Hills, CA 91709
MLS# TR26060886Listed by: CC ROYAL REALTY - New
 $1,198,000Active4 beds 3 baths2,097 sq. ft.
12810 Homeridge, Chino Hills, CA 91709
MLS# TR26060789Listed by: 168 REALTY INC. - New

 $1,198,000Active5 beds 3 baths2,439 sq. ft.
2518 Paseo Del Palacio, Chino Hills, CA 91709
MLS# CV25282202Listed by: CENTURY 21 MASTERS - New
 $995,000Active4 beds 3 baths2,152 sq. ft.
6034 Natalie Road, Chino Hills, CA 91709
MLS# CROC26057937Listed by: REAL BROKER - New
 $885,000Active3 beds 3 baths1,531 sq. ft.
18036 Arroyo, Chino Hills, CA 91709
MLS# TR26059851Listed by: CUBEMAX INTERNATIONAL CORP. - New
 $499,000Active3 beds 3 baths1,346 sq. ft.
17875 Concordia Way #102, Chino Hills, CA 91709
MLS# CRPW26059052Listed by: KELLER WILLIAMS REALTY - New
 $1,175,000Active3 beds 3 baths2,075 sq. ft.
14218 Aliso Court, Chino Hills, CA 91709
MLS# CV26048627Listed by: HELP-U-SELL PRESTIGE PROP'S - New
 $899,000Active4 beds 2 baths1,585 sq. ft.
15744 Sprig, Chino Hills, CA 91709
MLS# TR26057287Listed by: KELLER WILLIAMS PREMIER PROP - Open Sat, 1 to 3pmNew
 $1,498,000Active5 beds 3 baths2,935 sq. ft.
2481 Hawkwood Drive, Chino Hills, CA 91709
MLS# CV26038831Listed by: RE/MAX MASTERS REALTY - New
 $975,000Active3 beds 2 baths1,767 sq. ft.
17866 Via La Cresta, Chino Hills, CA 91709
MLS# TR26058239Listed by: PARK GROUP REAL ESTATE - New
 $1,288,000Active4 beds 3 baths2,250 sq. ft.
4406 Mission Hills Drive, Chino Hills, CA 91709
MLS# CRTR26047366Listed by: PINNACLE REAL ESTATE GROUP - New
 $975,000Active3 beds 3 baths1,973 sq. ft.
4997 Agate, Chino Hills, CA 91709
MLS# PW26057235Listed by: CIRCA PROPERTIES, INC. - Open Sat, 1 to 4pmNew
 $1,188,000Active4 beds 3 baths1,934 sq. ft.
12918 Glendon, Chino Hills, CA 91709
MLS# TR26055232Listed by: RE/MAX GALAXY - New
 $929,000Active3 beds 3 baths1,448 sq. ft.
15423 Ficus, Chino Hills, CA 91709
MLS# CRPW26055866Listed by: SUSANA FURLONG, BROKER - New
 $1,400,000Active5 beds 3 baths2,733 sq. ft.
16441 Cyan Court, Chino Hills, CA 91709
MLS# HD26054274Listed by: KELLER WILLIAMS VICTOR VALLEY  $1,100,000Active4 beds 3 baths2,094 sq. ft.
5020 Agate Road, Chino Hills, CA 91709
MLS# TR25275868Listed by: KING REALTY GROUP INC $1,068,000Active4 beds 3 baths2,066 sq. ft.
5470 Amethyst, Chino Hills, CA 91709
MLS# TR26055775Listed by: KING REALTY GROUP INC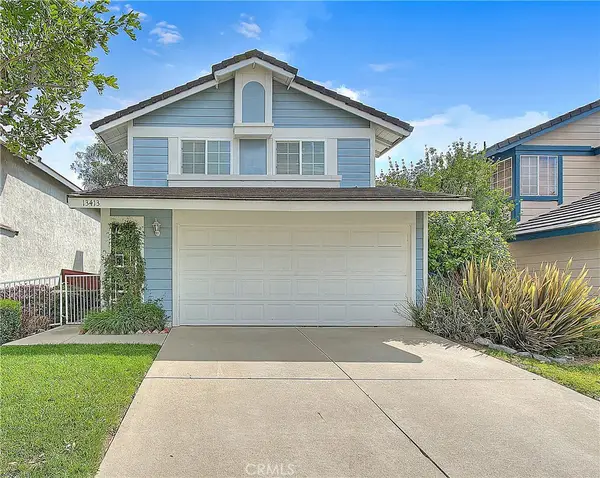 $850,000Pending3 beds 3 baths1,382 sq. ft.
13413 Prospector, Chino Hills, CA 91709
MLS# TR26055311Listed by: KING REALTY GROUP INC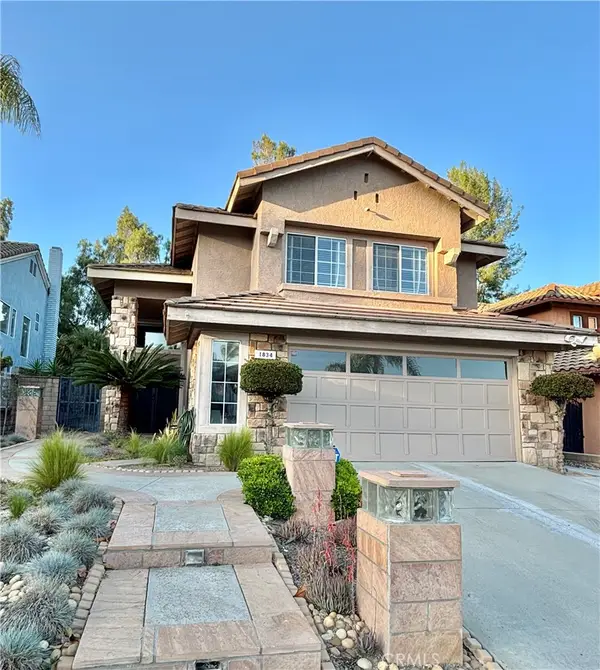 $1,278,000Active4 beds 3 baths2,307 sq. ft.
1834 Berryhill Drive, Chino Hills, CA 91709
MLS# TR26054544Listed by: HOMECOIN.COM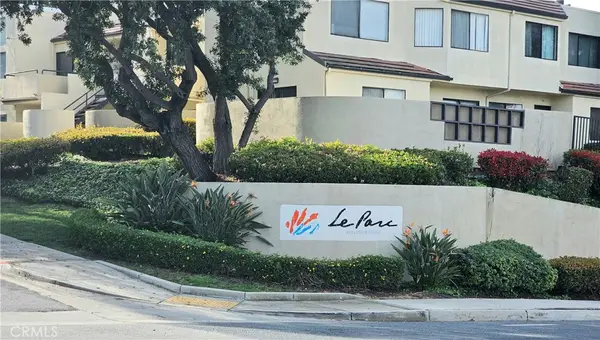 $548,888Active2 beds 3 baths1,125 sq. ft.
13133 Le Parc Blvd. #810, Chino Hills, CA 91709
MLS# CV26053999Listed by: CRESCENT FINANCIAL SERVICE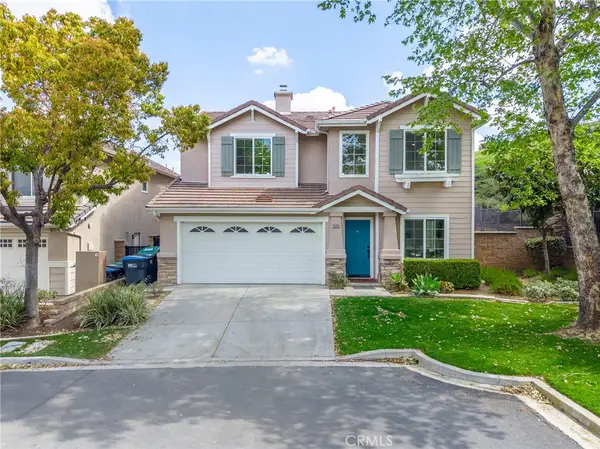 $999,800Active4 beds 3 baths2,070 sq. ft.
15995 Paul Court, Chino Hills, CA 91709
MLS# TR26054120Listed by: PINNACLE REAL ESTATE GROUP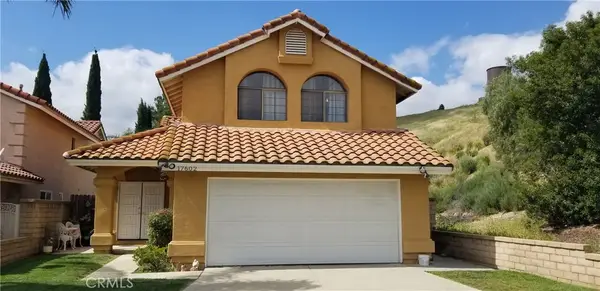 $880,000Active3 beds 3 baths1,731 sq. ft.
17602 Wildflower Place, Chino Hills, CA 91709
MLS# IG26043556Listed by: COLDWELL BANKER ENVISION $618,000Active3 beds 3 baths1,335 sq. ft.
13158 Pinnacle Court, Chino Hills, CA 91709
MLS# WS26047456Listed by: PINNACLE REAL ESTATE GROUP $860,000Active3 beds 3 baths2,045 sq. ft.
2030 Villa Del Lago #B, Chino Hills, CA 91709
MLS# TR25280160Listed by: MASTERS REALTY EASTERN GROUP $1,250,000Active4 beds 3 baths2,461 sq. ft.
14185 Deerbrook Lane, Chino Hills, CA 91709
MLS# CRPW26052896Listed by: REAL BROKERAGE TECHNOLOGIES $1,970,000Active4 beds 4 baths3,670 sq. ft.
15188 Canon Lane, Chino Hills, CA 91709
MLS# CV26052570Listed by: CENTURY 21 MASTERS $1,348,000Active4 beds 3 baths2,980 sq. ft.
3271 Willow Hollow Rd., Chino Hills, CA 91709
MLS# TR26052463Listed by: PINNACLE REAL ESTATE GROUP $559,000Active2 beds 2 baths1,012 sq. ft.
2521 Sundial #G, Chino Hills, CA 91709
MLS# PW26051628Listed by: MKS REAL ESTATE SERVICES, INC $1,130,000Pending5 beds 3 baths2,488 sq. ft.
5953 Park Crest, Chino Hills, CA 91709
MLS# TR26034158Listed by: RE/MAX CHAMPIONS $1,690,000Active4 beds 4 baths3,341 sq. ft.
3940 Golden Terrace, Chino Hills, CA 91709
MLS# TR26052048Listed by: AREX $1,150,000Active4 beds 3 baths2,629 sq. ft.
15722 Live Oak Road, Chino Hills, CA 91709
MLS# AR26049673Listed by: PINNACLE REAL ESTATE GROUP $559,000Active2 beds 2 baths1,012 sq. ft.
2521 Sundial #G, Chino Hills, CA 91709
MLS# PW26051628Listed by: MKS REAL ESTATE SERVICES, INC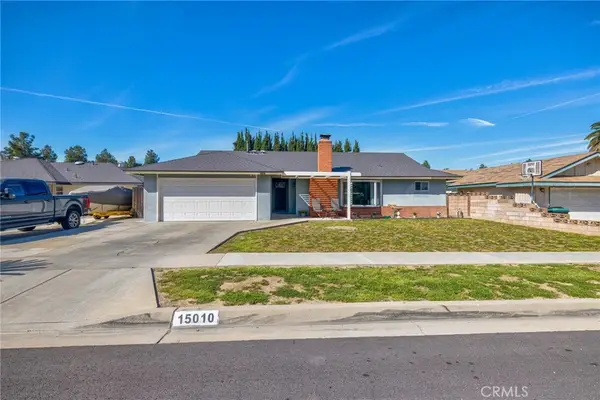 $875,000Active3 beds 2 baths1,626 sq. ft.
15010 Oakwood Lane, Chino Hills, CA 91709
MLS# IG26047095Listed by: COLDWELL BANKER ENVISION $670,000Pending3 beds 2 baths1,000 sq. ft.
4111 El Molino, Chino Hills, CA 91709
MLS# IV26050432Listed by: #1 FLAT FEE-LIBERTY REALTY $285,000Active2 beds 2 baths1,520 sq. ft.
15111 Pipeline #180, Chino Hills, CA 91709
MLS# CV26048119Listed by: THE ASSOCIATES REALTY GROUP $502,000Active2 beds 2 baths1,072 sq. ft.
17863 Addison Court #203, Chino Hills, CA 91709
MLS# WS26039406Listed by: HARVEST REALTY DEVELOPMENT $749,000Pending3 beds 3 baths1,235 sq. ft.
17837 Autry Court, Chino Hills, CA 91709
MLS# OC26049409Listed by: COLDWELL BANKER REALTY $750,000Active4 beds 2 baths1,332 sq. ft.
3495 Terrace, Chino Hills, CA 91709
MLS# PW26047708Listed by: FIRST TEAM REAL ESTATE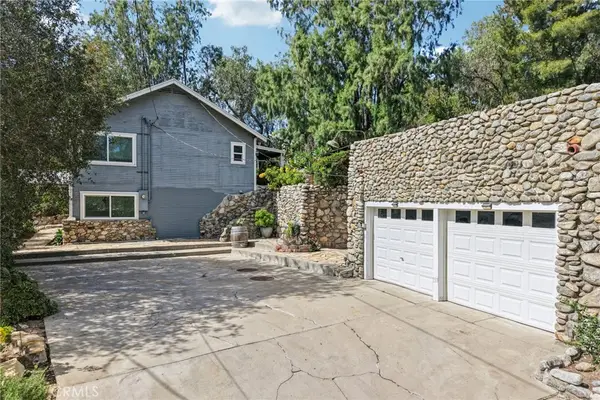 $789,000Active3 beds 2 baths1,248 sq. ft.
16925 Hillside Drive, Chino Hills, CA 91709
MLS# PW26046251Listed by: REDFIN CORPORATION $502,000Active2 beds 2 baths1,072 sq. ft.
17863 Addison Court #203, Chino Hills, CA 91709
MLS# WS26039406Listed by: HARVEST REALTY DEVELOPMENT $1,200,000Pending4 beds 3 baths2,476 sq. ft.
15414 Feldspar Drive, Chino Hills, CA 91709
MLS# CV26045702Listed by: KELLER WILLIAMS EMPIRE ESTATES $900,000Active3 beds 3 baths1,440 sq. ft.
15598 Oakdale, Chino Hills, CA 91709
MLS# TR26048735Listed by: BLDG REALTY $1,175,000Active4 beds 4 baths2,014 sq. ft.
16908 Hillside Drive, Chino Hills, CA 91709
MLS# IG26048090Listed by: REDFIN $1,388,000Active5 beds 3 baths2,766 sq. ft.
1429 Rancho Hills, Chino Hills, CA 91709
MLS# TR26046929Listed by: RE/MAX CHAMPIONS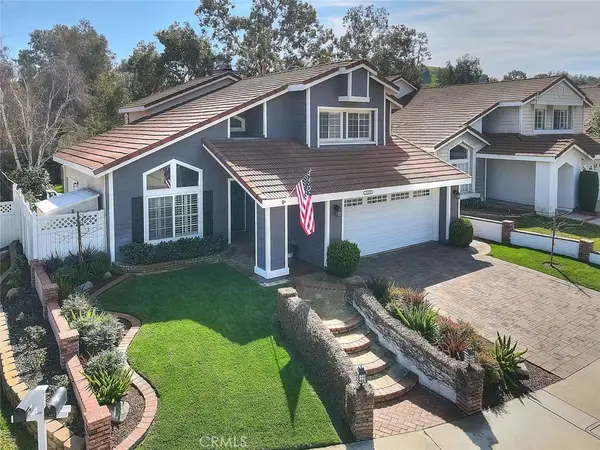 $1,200,000Pending4 beds 3 baths2,020 sq. ft.
15489 Quiet Oak, Chino Hills, CA 91709
MLS# CV26043864Listed by: HELP-U-SELL PRESTIGE PROP'S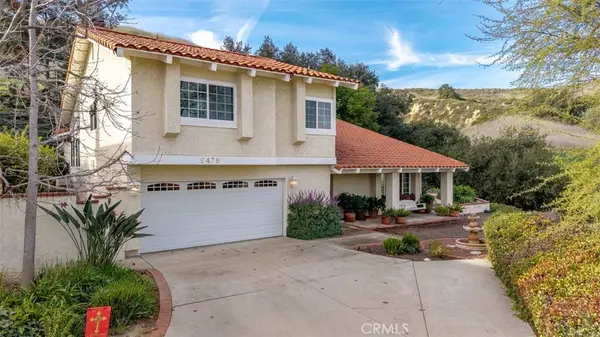 $1,099,000Active3 beds 3 baths2,239 sq. ft.
2478 Limestone Court, Chino Hills, CA 91709
MLS# IG26047394Listed by: REAL BROKER $1,260,000Active4 beds 3 baths2,783 sq. ft.
16284 Cordovan Court, Chino Hills, CA 91709
MLS# OC26045170Listed by: KELLER WILLIAMS REALTY $1,229,900Pending4 beds 3 baths2,515 sq. ft.
16325 Fox Hollow, Chino Hills, CA 91709
MLS# SW26047259Listed by: RICHARD LERMA, BROKER $1,799,000Active6 beds 5 baths3,756 sq. ft.
4027 Blair Ridge, Chino Hills, CA 91709
MLS# CV26021667Listed by: RE/MAX MASTERS REALTY $1,280,000Pending4 beds 3 baths2,157 sq. ft.
13910 Monteverde, Chino Hills, CA 91709
MLS# CV26041980Listed by: HELP-U-SELL PRESTIGE PROP'S $2,190,000Active6 beds 6 baths5,557 sq. ft.
15930 Esquilime, Chino Hills, CA 91709
MLS# TR26046004Listed by: PINNACLE REAL ESTATE GROUP $999,000Pending4 beds 3 baths1,814 sq. ft.
16168 Singing Hills, Chino Hills, CA 91709
MLS# TR26042399Listed by: REMAX 2000 REALTY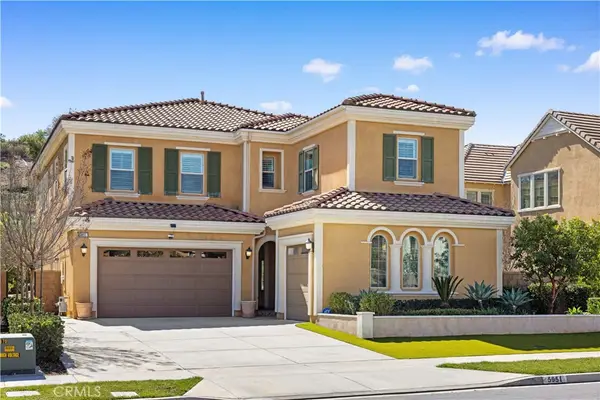 $1,699,000Active5 beds 5 baths3,491 sq. ft.
5951 Porto, Chino Hills, CA 91709
MLS# WS26040814Listed by: HARVEST REALTY DEVELOPMENT $1,588,000Active5 beds 3 baths3,147 sq. ft.
2782 Olympic View Drive, Chino Hills, CA 91709
MLS# CV26043343Listed by: PINNACLE REAL ESTATE GROUP $175,000Active2 beds 2 baths
15111 Pipeline #198, Chino Hills, CA 91709
MLS# TR26042896Listed by: CENTURY 21 MASTERS $549,999Pending2 beds 1 baths907 sq. ft.
15707 Merced Ave, Chino Hills, CA 91709
MLS# SR26041119Listed by: EXP REALTY OF CALIFORNIA INC $829,000Pending4 beds 2 baths1,209 sq. ft.
3986 Valle Vista Dr., Chino Hills, CA 91709
MLS# PW26039215Listed by: BHHS CA PROPERTIES $758,000Pending3 beds 4 baths1,649 sq. ft.
16117 Sereno Lane, Chino Hills, CA 91709
MLS# CV26032971Listed by: RE/MAX MASTERS REALTY $838,000Active3 beds 2 baths1,436 sq. ft.
15496 Rolling Ridge, Chino Hills, CA 91709
MLS# TR26041440Listed by: EXP OF GREATER LOS ANGELES $2,375,000Active5 beds 6 baths4,547 sq. ft.
16127 Greens Court, Chino Hills, CA 91709
MLS# CV26025502Listed by: REALTY MASTERS & ASSOCIATES $848,888Active3 beds 3 baths1,524 sq. ft.
13420 Telluride Drive, Chino Hills, CA 91709
MLS# ML82036139Listed by: COLDWELL BANKER REALTY $449,900Active3 beds 2 baths1,716 sq. ft.
1850 Fairway Dr #61, Chino Hills, CA 91709
MLS# OC26040707Listed by: RE/MAX TERRASOL $1,138,000Pending5 beds 3 baths2,440 sq. ft.
15586 Quiet Oak, Chino Hills, CA 91709
MLS# TR26040244Listed by: REALTY MASTERS & ASSOCIATES $984,800Active4 beds 3 baths1,996 sq. ft.
14377 Autumn Hill, Chino Hills, CA 91709
MLS# PW26039541Listed by: FIRST TEAM REAL ESTATE $820,000Active3 beds 3 baths1,590 sq. ft.
15343 Lotus, Chino Hills, CA 91709
MLS# CRTR26039725Listed by: WETRUST REALTY- Open Wed, 11am to 4pm
 $1,996,444Active4 beds 5 baths3,503 sq. ft.
1102 Zen Circle, Chino Hills, CA 91709
MLS# OC26038224Listed by: TRUMARK CONSTRUCTION SERVICES INC  $838,000Active3 beds 3 baths1,830 sq. ft.
4480 Lilac Cir, Chino Hills, CA 91709
MLS# OC26038077Listed by: PINNACLE REAL ESTATE GROUP $1,924,365Pending5 beds 5 baths3,906 sq. ft.
1151 Zen Circle, Chino Hills, CA 91709
MLS# OC26038260Listed by: TRUMARK CONSTRUCTION SERVICES INC $1,680,000Active4 beds 4 baths3,547 sq. ft.
1909 Scenic Ridge, Chino Hills, CA 91709
MLS# TR26033188Listed by: COLDWELL BANKER ENVISION $1,599,000Active4 beds 3 baths3,017 sq. ft.
13511 Portofino Court, Chino Hills, CA 91709
MLS# CV26032872Listed by: RE/MAX MASTERS REALTY $600,000Active0.21 Acres
16872 Sumach, Chino Hills, CA 91709
MLS# DW26037812Listed by: TRANSUNITED REALTY GROUP $2,580,000Active5 beds 6 baths4,287 sq. ft.
2879 Venezia Court, Chino Hills, CA 91709
MLS# TR26036939Listed by: UNIVERSAL ELITE INC.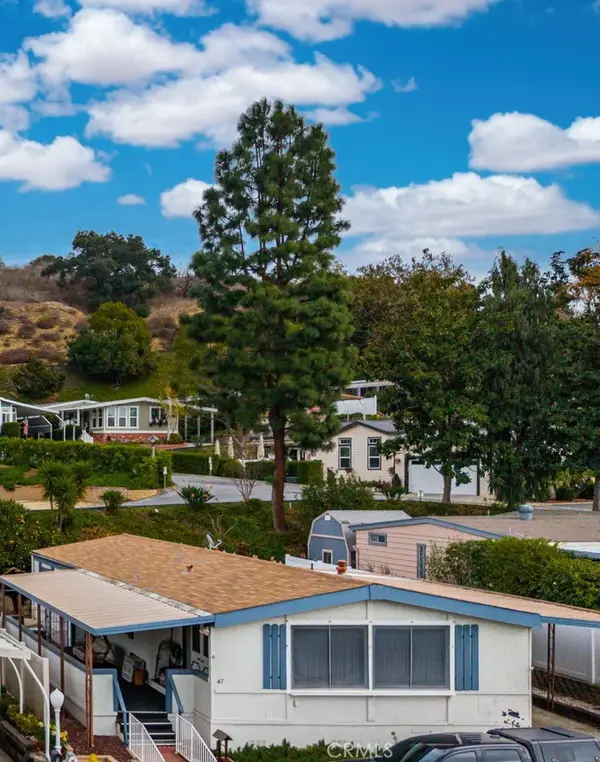 $274,900Active2 beds 2 baths1,480 sq. ft.
1850 Fairway #47, Chino Hills, CA 91709
MLS# CV26036025Listed by: ELEVATE REAL ESTATE AGENCY $799,000Active3 beds 3 baths1,678 sq. ft.
2856 Calle Invierno, Chino Hills, CA 91709
MLS# AR26031243Listed by: IRN REALTY $889,000Active4 beds 2 baths1,640 sq. ft.
15142 Ashwood, Chino Hills, CA 91709
MLS# PW26024567Listed by: HOMESMART REALTY GROUP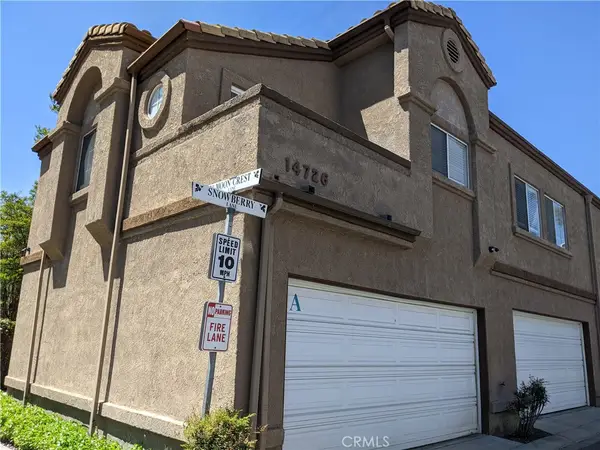 $559,800Active2 beds 2 baths1,025 sq. ft.
14726 Moon Crest, Chino Hills, CA 91709
MLS# CV26033785Listed by: JAMIL ALAM, BROKER $850,000Active3 beds 2 baths1,379 sq. ft.
15676 Deodar Lane, Chino Hills, CA 91709
MLS# TR26031811Listed by: KW VISION $874,500Active3 beds 2 baths1,000 sq. ft.
15718 Aqueduct Lane, Chino Hills, CA 91709
MLS# NDP2601450Listed by: COLDWELL BANKER REALTY $625,000Active3 beds 2 baths1,120 sq. ft.
3365 Orange Grove Avenue, Chino Hills, CA 91709
MLS# WS26033112Listed by: CENTURY 21 CORNERSTONE $1,195,000Pending5 beds 3 baths2,610 sq. ft.
17880 Paseo Del Sol, Chino Hills, CA 91709
MLS# IG26031096Listed by: CENTURY 21 AFFILIATED- Open Sat, 1 to 3pm
 $765,000Pending3 beds 3 baths1,482 sq. ft.
15681 Ladera Vista, Chino Hills, CA 91709
MLS# CV26031078Listed by: HOMEQUEST REAL ESTATE  $898,000Active5 beds 3 baths2,266 sq. ft.
4169 El Molino, Chino Hills, CA 91709
MLS# AR26031925Listed by: RE/MAX PREMIER PROP ARCADIA $729,300Active2 beds 2 baths1,191 sq. ft.
16051 Augusta Drive, Chino Hills, CA 91709
MLS# OC26028026Listed by: PELLEGO, INC. $800,000Active3 beds 2 baths1,506 sq. ft.
16893 Rosemary, Chino Hills, CA 91709
MLS# TR26028497Listed by: EXP REALTY OF CALIFORNIA INC $789,900Active4 beds 2 baths1,398 sq. ft.
4001 Hickory Lane, Chino Hills, CA 91709
MLS# SB26019394Listed by: WEST SHORES REALTY, INC. $159,999Active4 beds 2 baths1,440 sq. ft.
15050 Monte Vista Avenue #126, Chino Hills, CA 91709
MLS# HD26027561Listed by: MERCI REAL ESTATE $790,000Active3 beds 3 baths1,814 sq. ft.
15920 Ellington, Chino Hills, CA 91709
MLS# TR26027417Listed by: AMERICAN ELITE REALTY $1,975,000Pending3 beds 2 baths3,146 sq. ft.
2131 Carbon Canyon Rd, Chino Hills, CA 91709
MLS# CV26027198Listed by: VISMAR REAL ESTATE $780,000Active3 beds 3 baths1,814 sq. ft.
15920 Ellington, Chino Hills, CA 91709
MLS# TR26027417Listed by: AMERICAN ELITE REALTY $950,000Pending3 beds 3 baths1,883 sq. ft.
3020 Plum Street, Chino Hills, CA 91709
MLS# TR26026040Listed by: MASTERS REALTY EASTERN GROUP $535,800Active2 beds 3 baths1,136 sq. ft.
13096 Le Parc #92, Chino Hills, CA 91709
MLS# WS26020961Listed by: PINNACLE REAL ESTATE GROUP $1,000,000Active4 beds 2 baths1,794 sq. ft.
15335 Rolling Ridge Drive, Chino Hills, CA 91709
MLS# PF26005667Listed by: REDFIN CORPORATION $2,860,000Active5 beds 6 baths4,937 sq. ft.
2831 Venezia Court, Chino Hills, CA 91709
MLS# TR26023112Listed by: EVA THOMAS & ASSOCIATES $938,888Active4 beds 3 baths2,412 sq. ft.
15289 Yorba Avenue, Chino Hills, CA 91709
MLS# AR26023689Listed by: EXP REALTY OF SOUTHERN CA, INC $279,000Active3 beds 2 baths1,245 sq. ft.
15111 Pipeline #64, Chino Hills, CA 91709
MLS# IV26022653Listed by: REAL ESTATE MAVENS $1,699,800Active4 beds 4 baths3,093 sq. ft.
5924 Nisa Drive, Chino Hills, CA 91709
MLS# CV26019392Listed by: HELP-U-SELL PRESTIGE PROP'S $5,500,000Active5 beds 6 baths6,600 sq. ft.
2268 Verona Court, Chino Hills, CA 91709
MLS# WS26013543Listed by: KARBURY'S, INC. $2,900,000Active5 beds 5 baths4,311 sq. ft.
3012 Aviano Court, Chino Hills, CA 91709
MLS# OC26020105Listed by: SOLTERRA ESTATES & LENDING INC $1,450,000Pending5 beds 3 baths2,974 sq. ft.
1568 Rancho Hills, Chino Hills, CA 91709
MLS# WS26020423Listed by: RE/MAX ELITE REALTY $478,000Active2 beds 3 baths1,138 sq. ft.
13195 Spire, Chino Hills, CA 91709
MLS# WS26018530Listed by: HUNTINGTON REALTY GROUP CO. $478,000Active2 beds 3 baths1,138 sq. ft.
13195 Spire, Chino Hills, CA 91709
MLS# WS26018530Listed by: HUNTINGTON REALTY GROUP CO. $528,000Active2 beds 2 baths1,118 sq. ft.
13133 Le Parc #712, Chino Hills, CA 91709
MLS# PW26018091Listed by: REMAX TIFFANY REAL ESTATE $1,288,800Active5 beds 4 baths2,945 sq. ft.
15828 Kingston, Chino Hills, CA 91709
MLS# IV26029135Listed by: RE/MAX TIME REALTY $1,350,000Pending4 beds 3 baths2,134 sq. ft.
4942 Citron Court, Chino Hills, CA 91709
MLS# TR26013607Listed by: KING REALTY GROUP INC $264,900Active3 beds 2 baths1,290 sq. ft.
15111 Pipeline Avenue #282, Chino Hills, CA 91709
MLS# IG26011675Listed by: JANICE LYNN SHUMAKER- SWANSON, $498,000Active2 beds 2 baths1,042 sq. ft.
13150 Pinnacle Court, Chino Hills, CA 91709
MLS# WS26010360Listed by: RE/MAX 2000 REALTY $498,000Active2 beds 2 baths1,042 sq. ft.
13150 Pinnacle Court, Chino Hills, CA 91709
MLS# WS26010360Listed by: RE/MAX 2000 REALTY $840,000Active3 beds 3 baths1,478 sq. ft.
16169 Singing Hills, Chino Hills, CA 91709
MLS# IG26010966Listed by: REALTY ONE GROUP HOMELINK- Open Wed, 11am to 4pm
 $1,979,990Active6 beds 5 baths4,154 sq. ft.
16191 Zen Circle, Chino Hills, CA 91709
MLS# OC26010282Listed by: TRUMARK CONSTRUCTION SERVICES INC  $1,850,000Active5 beds 5 baths3,791 sq. ft.
6005 Amora Drive, Chino Hills, CA 91709
MLS# WS26000217Listed by: PINNACLE REAL ESTATE GROUP $4,000,000Active7 beds 7 baths9,700 sq. ft.
1568 Greens Drive, Chino Hills, CA 91709
MLS# WS26006318Listed by: KARBURY'S, INC. $1,318,000Active4 beds 3 baths2,783 sq. ft.
16224 Cordovan Court, Chino Hills, CA 91709
MLS# TR26001869Listed by: REALTY MASTERS & ASSOCIATES $299,000Active0.34 Acres
0 Hillside, Chino Hills, CA 91709
MLS# PW25275189Listed by: HARWIL REAL ESTATE $1,200,000Pending4 beds 3 baths2,230 sq. ft.
13178 Bella Vista Court, Chino Hills, CA 91709
MLS# TR25273534Listed by: KING REALTY GROUP INC $1,498,880Active4 beds 3 baths3,010 sq. ft.
16270 Van Gogh Court, Chino Hills, CA 91709
MLS# WS25270014Listed by: RE/MAX 2000 REALTY $1,498,880Active4 beds 3 baths3,010 sq. ft.
16270 Van Gogh Court, Chino Hills, CA 91709
MLS# WS25270014Listed by: RE/MAX 2000 REALTY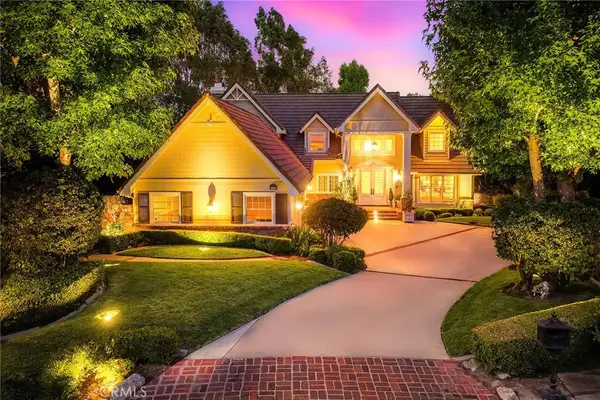 $2,580,000Active4 beds 4 baths3,620 sq. ft.
3248 Giant Forest Loop, Chino Hills, CA 91709
MLS# TR25270912Listed by: RE/MAX MASTERS REALTY $1,050,000Active0.42 Acres
16567 Vellano Club Dr, Chino Hills, CA 91709
MLS# TR25270978Listed by: CENTURY COMMERCIAL RE SERVICES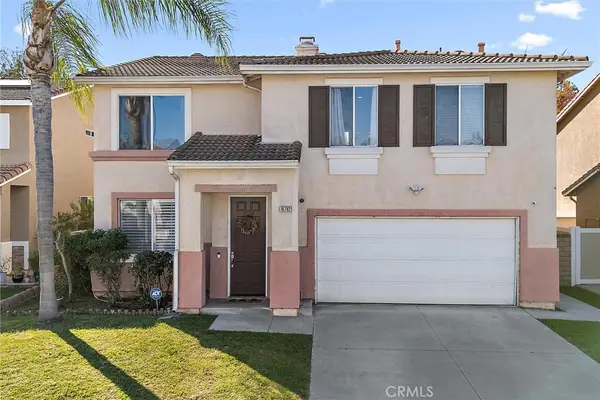 $1,088,888Active4 beds 3 baths2,577 sq. ft.
16782 Elk Horn, Chino Hills, CA 91709
MLS# PW25268116Listed by: NP REALTY $454,950Active3 beds 2 baths
3830 HICKORY VILLAGE LANE, Shafter, CA 93263
MLS# 202513080Listed by: MIRAMAR REALTY $454,950Active4 beds 3 baths
3826 HICKORY VILLAGE LANE, Shafter, CA 93263
MLS# 202513081Listed by: MIRAMAR REALTY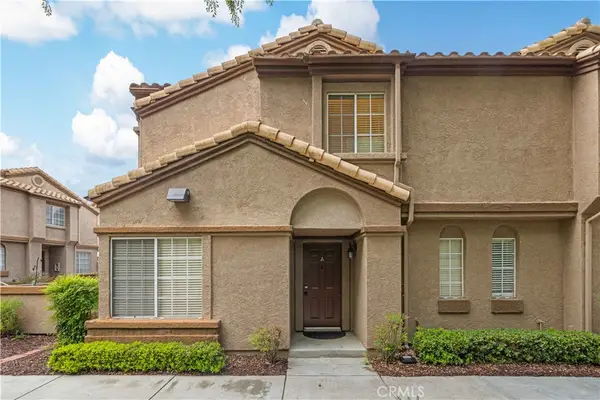 $657,000Active3 beds 3 baths1,392 sq. ft.
2509 Moon Dust #A, Chino Hills, CA 91709
MLS# TR25267544Listed by: PINNACLE REAL ESTATE GROUP $657,000Active3 beds 3 baths1,392 sq. ft.
2509 Moon Dust #A, Chino Hills, CA 91709
MLS# TR25267544Listed by: PINNACLE REAL ESTATE GROUP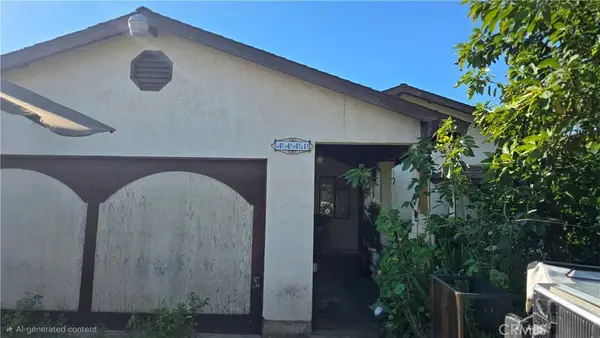 $689,999Active3 beds 2 baths1,416 sq. ft.
4441 Los Serranos Blvd, Chino Hills, CA 91709
MLS# TR25266971Listed by: QUALITY REAL ESTATE CORP. $1,290,000Active5 beds 3 baths3,130 sq. ft.
15345 Georgetown, Chino Hills, CA 91709
MLS# WS25265091Listed by: PINNACLE REAL ESTATE GROUP $1,799,000Active0.28 Acres
2572 Collinas Pt, Chino Hills, CA 91709
MLS# TR25260331Listed by: RE/MAX MASTERS REALTY- Open Sat, 12 to 3pm
 $460,000Active3 beds 2 baths2,077 sq. ft.
15111 Pipeline #189, Chino Hills, CA 91709
MLS# OC25266556Listed by: HOME WORKS REALTY  $260,000Pending3 beds 2 baths1,336 sq. ft.
15111 Pipeline Avenue #274, Chino Hills, CA 91709
MLS# OC25256466Listed by: REALTY ONE GROUP WEST $540,000Pending2 beds 3 baths1,042 sq. ft.
13151 Pinnacle Court, Chino Hills, CA 91709
MLS# IG25207762Listed by: KW COLLEGE PARK $540,000Pending2 beds 3 baths1,042 sq. ft.
13151 Pinnacle Court, Chino Hills, CA 91709
MLS# IG25207762Listed by: KW COLLEGE PARK $1,438,888Active5 beds 4 baths3,424 sq. ft.
5095 Buckwheat, Chino Hills, CA 91709
MLS# WS26030654Listed by: PINNACLE REAL ESTATE GROUP $980,000Active5 beds 4 baths2,109 sq. ft.
15224 Mariposa Avenue, Chino Hills, CA 91709
MLS# HD25243045Listed by: CENTURY 21 MASTERS $1,120,000Active3 beds 3 baths1,811 sq. ft.
2024 Vista Del Sol, Chino Hills, CA 91709
MLS# TR26047124Listed by: RE/MAX CHAMPIONS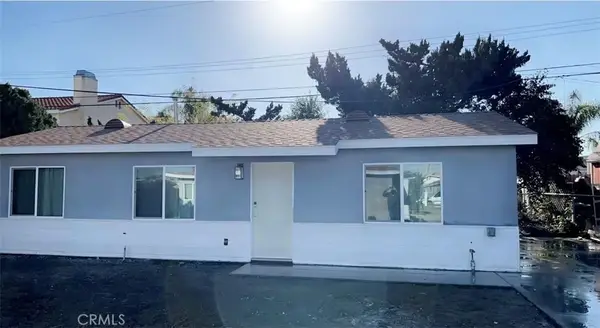 $1,000,000Active4 beds 2 baths1,394 sq. ft.
15508 Quail Street, Chino Hills, CA 91709
MLS# PW25242970Listed by: COLDWELL BANKER ENVISION $1,392,888Pending4 beds 4 baths2,851 sq. ft.
15740 Willow Run, Chino Hills, CA 91709
MLS# NP25223412Listed by: PACIFIC SOTHEBY'S INT'L REALTY $1,299,000Active5 beds 3 baths2,815 sq. ft.
15849 Tanberry Drive, Chino Hills, CA 91709
MLS# CRTR25214288Listed by: A + REALTY & MORTGAGE $505,000Active2 beds 2 baths1,072 sq. ft.
6631 Laurelton Lane #203, Chino Hills, CA 91709
MLS# PW25209611Listed by: FIRST TEAM REAL ESTATE $505,000Active2 beds 2 baths1,072 sq. ft.
6631 Laurelton Lane #203, Chino Hills, CA 91709
MLS# PW25209611Listed by: FIRST TEAM REAL ESTATE- Open Sat, 2 to 4pm
 $1,554,280Active5 beds 4 baths2,989 sq. ft.
3167 Morningfield Dr, Chino Hills, CA 91709
MLS# OC25166671Listed by: LATITUDE 33 REAL ESTATE  $698,888Pending3 beds 2 baths1,354 sq. ft.
16777 Oak Way, Chino Hills, CA 91709
MLS# OC25214562Listed by: HIVE REALTY $2,086,000Active5 beds 5 baths4,304 sq. ft.
3056 Giant Forest, Chino Hills, CA 91709
MLS# OC25182764Listed by: LATITUDE 33 REAL ESTATE $1,466,300Active4 beds 3 baths2,666 sq. ft.
3199 Morningfield Dr Drive, Chino Hills, CA 91709
MLS# OC25166719Listed by: LATITUDE 33 REAL ESTATE $610,000Active2 beds 3 baths1,436 sq. ft.
17871 Shady View Drive #704, Chino Hills, CA 91709
MLS# SB25160460Listed by: PROVIDENT REALTY- Open Sat, 2 to 4pm
 $1,480,000Active4 beds 3 baths2,665 sq. ft.
15429 Turquoise Circle N, Chino Hills, CA 91709
MLS# AR25264250Listed by: PINNACLE REAL ESTATE GROUP  $794,988Pending5 beds 3 baths2,589 sq. ft.
4685 Willow Bend Court, Chino Hills, CA 91709
MLS# CV19282984Listed by: HELP-U-SELL PRESTIGE PROP'S $549,900Pending3 beds 2 baths1,209 sq. ft.
15482 Elm Lane, Chino Hills, CA 91709
MLS# TR19284151Listed by: AMERICAN GOLDEN EAGLE REALTY $1,600,000Active1.96 Acres
13 Old Carbon Canyon, Chino Hills, CA 91709
MLS# CV25153326Listed by: FIRST TEAM REAL ESTATE $1,470,000Active4 beds 3 baths2,920 sq. ft.
15075 Avenida Del Monte, Chino Hills, CA 91709
MLS# TR25139799Listed by: PARK GROUP REAL ESTATE $545,000Active2 beds 3 baths1,243 sq. ft.
13104 Glen Ct #54, Chino Hills, CA 91709
MLS# DW25181623Listed by: TBT REALTY $2,250,000Active3 beds 2 baths2,430 sq. ft.
16757 Hillside Drive, Chino Hills, CA 91709
MLS# IG26015420Listed by: ELEVATE REAL ESTATE AGENCY $2,399,000Active0.86 Acres
2476 Collinas, Chino Hills, CA 91709
MLS# TR25095905Listed by: WETRUST REALTY $1,265,000Active0.36 Acres
16309 Domani, Chino Hills, CA 91709
MLS# AR25039439Listed by: PINNACLE REAL ESTATE GROUP $889,000Active3 beds 3 baths1,848 sq. ft.
5521 Stargaze Street, Chino Hills, CA 91709
MLS# CV25034944Listed by: RE/MAX CHAMPIONS $298,000Active0.29 Acres
0 Grand View Drive, Chino Hills, CA 91709
MLS# IV25023888Listed by: GOLF REALTY $175,000Active0.07 Acres
0 Valle Vista Drive, Chino Hills, CA 91709
MLS# CV24203089Listed by: EXP REALTY OF CALIFORNIA INC $899,000Active0.61 Acres
2304 Verona Court, Chino Hills, CA 91709
MLS# CV24194538Listed by: KING REALTY GROUP, INC $149,999Active0.24 Acres
0 Ravine Lane, Chino Hills, CA 91709
MLS# TR24122915Listed by: WETRUST REALTY $750,000Pending2.5 Acres
2 Old Carbon Canyon, Chino Hills, CA 91709
MLS# CV24050448Listed by: FIRST TEAM REAL ESTATE $2,500,000Active4 Acres
1 Old Carbon Canyon Cut / Cutoff, Chino Hills, CA 91709
MLS# CRCV24049794Listed by: FIRST TEAM REAL ESTATE $2,500,000Active4 Acres
1 Old Carbon Canyon Cut, Chino Hills, CA 91709
MLS# CV24049794Listed by: FIRST TEAM REAL ESTATE $3,980,000Active6 beds 7 baths8,200 sq. ft.
15877 Esquilime Drive, Chino Hills, CA 91709
MLS# TR25082653Listed by: RE/MAX CHAMPIONS $52,000,000Active525 Acres
0 0, Chino Hills, CA 91709
MLS# PW22250791Listed by: CENTURY 21 DISCOVERY $1,449,000Active6 beds 4 baths3,095 sq. ft.
17065 Branco, Chino Hills, CA 91709
MLS# SW25237466Listed by: RISE REALTY
Local realty services provided by:CENTURY 21 Affiliated, CENTURY 21 LOTUS, CENTURY 21 Wildwood Properties, Inc., CENTURY 21 Jordan-Link
This information is deemed reliable but not guaranteed. You should rely on this information only to decide whether or not to further investigate a particular property. BEFORE MAKING ANY OTHER DECISION, YOU SHOULD PERSONALLY INVESTIGATE THE FACTS (e.g. square footage and lot size) with the assistance of an appropriate professional. You may use this information only to identify properties you may be interested in investigating further. All uses except for personal, non-commercial use in accordance with the foregoing purpose are prohibited. Redistribution or copying of this information, any photographs or video tours is strictly prohibited. This information is derived from the Internet Data Exchange (IDX) service provided by San Diego MLS®. Displayed property listings may be held by a brokerage firm other than the broker and/or agent responsible for this display. The information and any photographs and video tours and the compilation from which they are derived is protected by copyright. Compilation © 2020 San Diego MLS®, Inc.
The information being provided by California Regional MLS (Southern California) is for the consumer's personal, non-commercial use and may not be used for any purpose other than to identify prospective properties consumer may be interested in purchasing. Any information relating to real estate for sale referenced on this web site comes from the Internet Data Exchange (IDX) program of the California Regional MLS (Southern California). CENTURY 21 LOTUS is not a Multiple Listing Service (MLS), nor does it offer MLS access. This website is a service of CENTURY 21 LOTUS, a broker participant of California Regional MLS (Southern California). This web site may reference real estate listing(s) held by a brokerage firm other than the broker and/or agent who owns this web site.
The accuracy of all information, regardless of source, including but not limited to open house information, square footages and lot sizes, is deemed reliable but not guaranteed and should be personally verified through personal inspection by and/or with the appropriate professionals. The data contained herein is copyrighted by California Regional MLS (Southern California) and is protected by all applicable copyright laws. Any unauthorized dissemination of this information is in violation of copyright laws and is strictly prohibited.
Copyright 2021 California Regional MLS (Southern California). All rights reserved.
Popular searches near 91709
Popular neighborhoods near 91709
- Anaheim Hills, Anaheim homes for sale
- Archibald Ranch, Ontario homes for sale
- Atwood, Placentia homes for sale
- Blackstone, Brea homes for sale
- Bryant Ranch, Yorba Linda homes for sale
- Chino, Chino homes for sale
- Eastvale, Eastvale homes for sale
- Hidden Hills, Yorba Linda homes for sale
- New Haven, Ontario homes for sale
- North Corona, Eastvale homes for sale
- Park Place, Ontario homes for sale
- Rancho Santa Ana del Chino, Ontario homes for sale
- Sierra del Oro, Corona homes for sale
- Sycamore Canyon, Anaheim homes for sale
- The Highlands, Anaheim homes for sale
- The Summit, Anaheim homes for sale
- Tonner Hills, Brea homes for sale
- Village Oaks, Chino Hills homes for sale
- Vista del Verde, Yorba Linda homes for sale
- Windmill Creek, Chino Hills homes for sale
Protect your home and budget from life's surprises with an Assurant Home Warranty, backed by a partner that supports you through every step of homeownership. Explore Plans.
©2026 Century 21 Real Estate LLC. All rights reserved. CENTURY 21®, the CENTURY 21 Logo and C21® are service marks owned by Century 21 Real Estate LLC. Century 21 Real Estate LLC fully supports the principles of the Fair Housing Act and the Equal Opportunity Act. Each office is independently owned and operated. Listing information is deemed reliable but not guaranteed accurate.