- Benton, Columbia homes for sale
- Douglass Park, Columbia homes for sale
- Hominy Branch, Columbia homes for sale
- Katy Lake Estates, Columbia homes for sale
- King's Meadow, Columbia homes for sale
- Lake Woodrail, Columbia homes for sale
- North Central, Columbia homes for sale
- Old Hawthorne, Columbia homes for sale
- Park DeVille, Columbia homes for sale
- Parkdale, Columbia homes for sale
- Ridgeway, Columbia homes for sale
- Rothwell Heights, Columbia homes for sale
- Shepard Boulevard, Columbia homes for sale
- Smithton Ridge, Columbia homes for sale
- Southwest Hills, Columbia homes for sale
- Sunset Hill, Columbia homes for sale
- University Park, Columbia homes for sale
- Valley View Gardens, Columbia homes for sale
- White Gate, Columbia homes for sale
- Woodridge, Columbia homes for sale
Clark, MO - homes for sale
2 of 2 results displayed
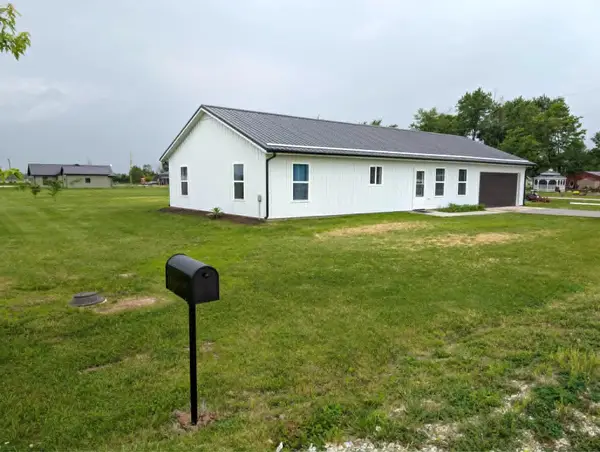 $245,900Pending3 beds 2 baths1,380 sq. ft.
10 Andy Court, Clark, MO 65243
MLS# 26-278Listed by: CENTURY 21 COMMUNITY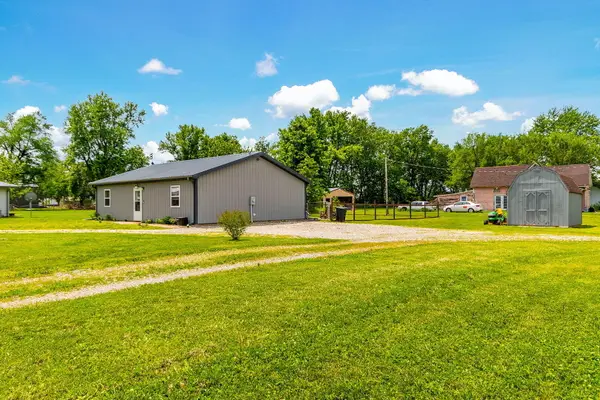 $179,000Active2 beds 1 baths1,200 sq. ft.
305 N Morris Ave., Clark, MO 65243
MLS# 26-260Listed by: CENTURY 21 COMMUNITY
Local realty services provided by:CENTURY 21 Community
Neighborhoods near Clark, MO
Zip codes near Clark, MO
- 65201 homes for sale
- 65202 homes for sale
- 65230 homes for sale
- 65239 homes for sale
- 65240 homes for sale
- 65243 homes for sale
- 65244 homes for sale
- 65248 homes for sale
- 65254 homes for sale
- 65255 homes for sale
- 65256 homes for sale
- 65257 homes for sale
- 65259 homes for sale
- 65263 homes for sale
- 65265 homes for sale
- 65270 homes for sale
- 65274 homes for sale
- 65275 homes for sale
- 65279 homes for sale
- 65284 homes for sale
Popular searches near Clark, MO
- Bonne Femme homes for sale
- Bourbon homes for sale
- Centralia homes for sale
- Centralia homes for sale
- Centralia Township homes for sale
- Hallsville homes for sale
- Harrisburg homes for sale
- Higbee homes for sale
- Huntsville homes for sale
- Madison homes for sale
- Moberly homes for sale
- Moniteau homes for sale
- North Sugar Creek homes for sale
- Perche homes for sale
- Prairie homes for sale
- Rocky Fork homes for sale
- Saling homes for sale
- South Sugar Creek homes for sale
- Sturgeon homes for sale
- Union homes for sale
Protect your home and budget from life's surprises with an Assurant Home Warranty, backed by a partner that supports you through every step of homeownership. Explore Plans.
©2026 Century 21 Real Estate LLC. All rights reserved. CENTURY 21®, the CENTURY 21 Logo and C21® are service marks owned by Century 21 Real Estate LLC. Century 21 Real Estate LLC fully supports the principles of the Fair Housing Act and the Equal Opportunity Act. Each office is independently owned and operated. Listing information is deemed reliable but not guaranteed accurate.