- Allegany County homes for sale
- Berkeley County homes for sale
- Clarke County homes for sale
- Fauquier County homes for sale
- Frederick County homes for sale
- Frederick County homes for sale
- Fulton County homes for sale
- Hampshire County homes for sale
- Hardy County homes for sale
- Jefferson County homes for sale
- Loudoun County homes for sale
- Manassas city County homes for sale
- Mineral County homes for sale
- Montgomery County homes for sale
- Morgan County homes for sale
- Rappahannock County homes for sale
- Shenandoah County homes for sale
- Warren County homes for sale
- Washington County homes for sale
- Winchester city County homes for sale
22624, VA - homes for sale
5 of 5 results displayed
 $975,000Pending146 Acres
668 Quarry, CLEAR BROOK, VA 22624
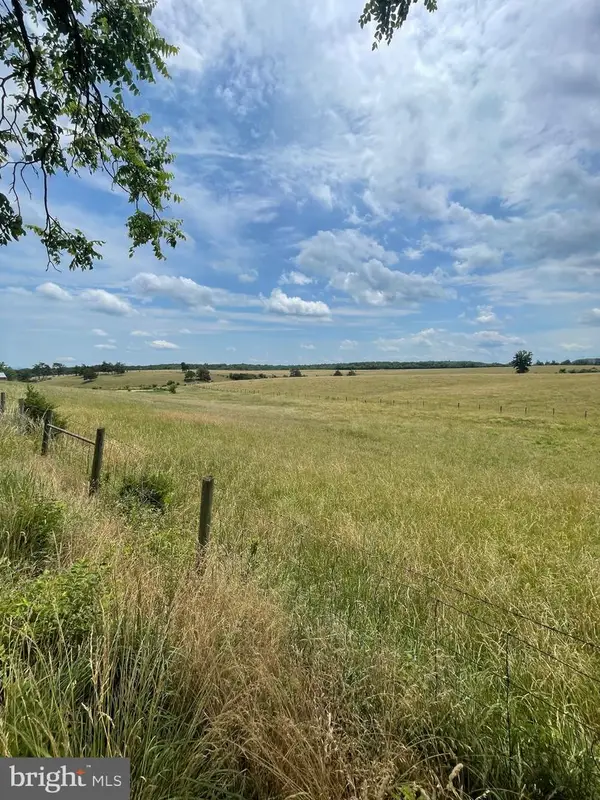
MLS# VAFV2043100Listed by: MARKETPLACE REALTY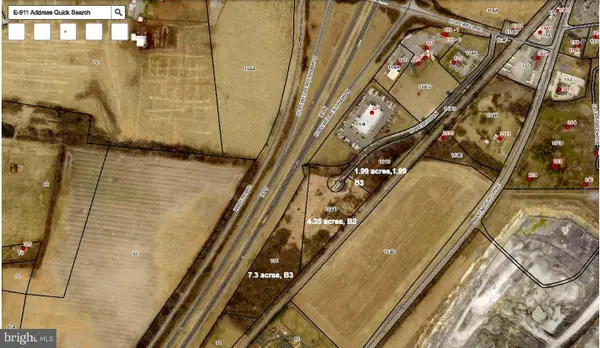 $2,523,400Active13.64 Acres
13.64 Acres Hopewell Ln, CLEAR BROOK, VA 22624
MLS# VAFV2042120Listed by: COLDWELL BANKER PREMIER $239,000Active2.01 Acres
Lot 1 Glebe Dr, CLEAR BROOK, VA 22624
MLS# VAFV2035552Listed by: LONG & FOSTER REAL ESTATE, INC.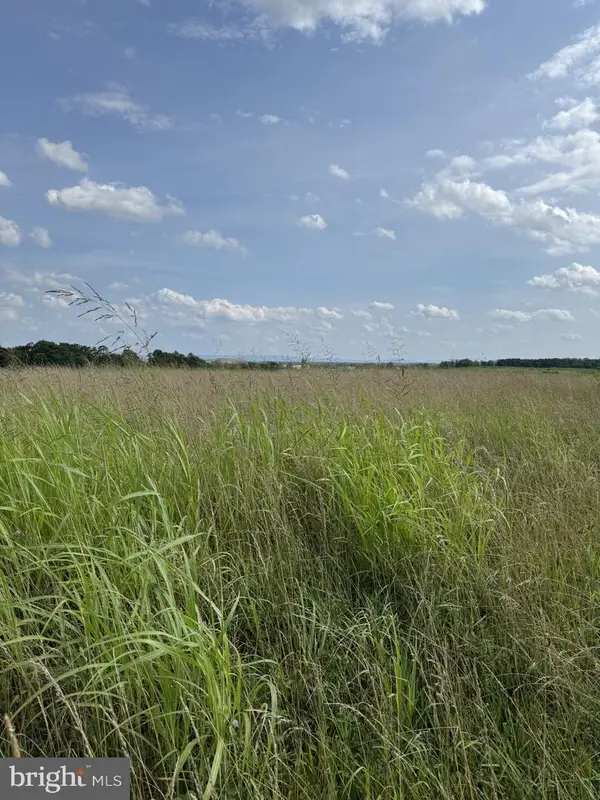 $239,000Active2.01 Acres
Lot 2 Glebe Dr, CLEAR BROOK, VA 22624
MLS# VAFV2035556Listed by: LONG & FOSTER REAL ESTATE, INC.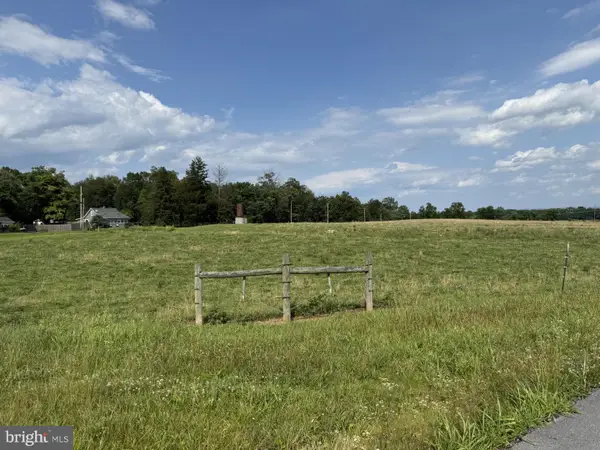 $239,000Active2.48 Acres
Lot 3 Glebe Dr, CLEAR BROOK, VA 22624
MLS# VAFV2035558Listed by: LONG & FOSTER REAL ESTATE, INC.
Local realty services provided by:CENTURY 21 Ryon Real Estate
Counties near Clear Brook, 22624
Protect your home and budget from life's surprises with an Assurant Home Warranty, backed by a partner that supports you through every step of homeownership. Explore Plans.
©2026 Century 21 Real Estate LLC. All rights reserved. CENTURY 21®, the CENTURY 21 Logo and C21® are service marks owned by Century 21 Real Estate LLC. Century 21 Real Estate LLC fully supports the principles of the Fair Housing Act and the Equal Opportunity Act. Each office is independently owned and operated. Listing information is deemed reliable but not guaranteed accurate.