- Brentwood Estates, Clearwater homes for sale
- Clearwater North West, Clearwater homes for sale
- Country Club Estates, Clearwater homes for sale
- Downtown Clearwater, Clearwater homes for sale
- Drew & Park Plaza, Clearwater homes for sale
- Dunedin Marina, Dunedin homes for sale
- Dunedin Mobile Manor, Dunedin homes for sale
- Edgewater Drive, Clearwater homes for sale
- Gateway, Clearwater homes for sale
- Glennwood, Clearwater homes for sale
- Golden Acres, Dunedin homes for sale
- Greenlea & Otten, Clearwater homes for sale
- Mandalay, Clearwater Beach homes for sale
- North Greenwood, Clearwater homes for sale
- Old Clearwater Bay, Clearwater homes for sale
- Prospect Towers, Clearwater homes for sale
- Sand Key Club, Clearwater Beach homes for sale
- Sunset Lake Estates, Clearwater homes for sale
- Willow Wood Village, Dunedin homes for sale
- Wood Street, Dunedin homes for sale
Clearwater, FL - homes for sale
300 of 1,568 results displayed
- New
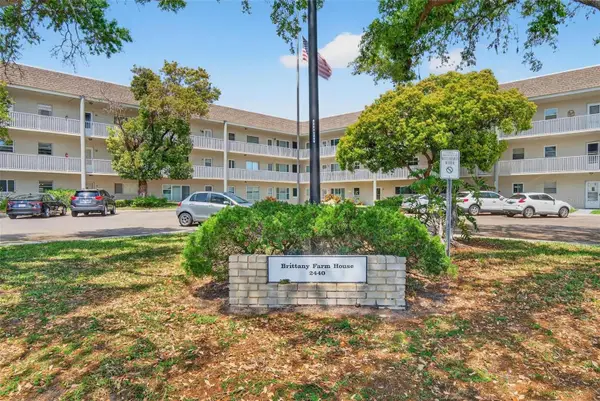
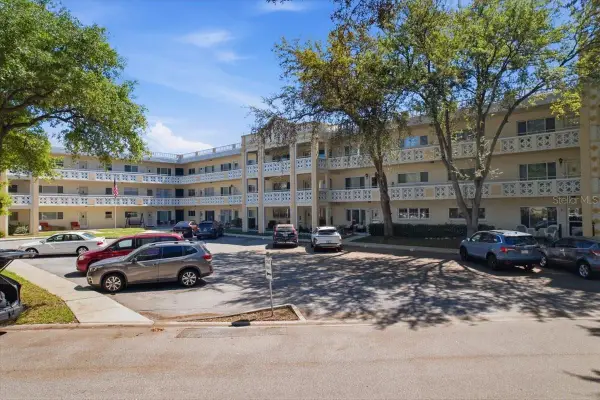
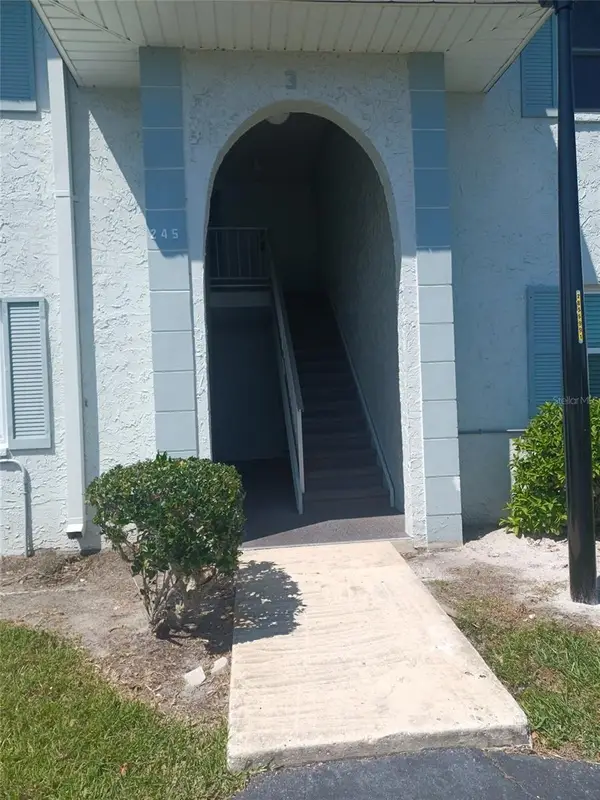 $110,000Active1 beds 1 baths747 sq. ft.
245 S Mcmullen Booth Road #17, CLEARWATER, FL 33759
MLS# TB8491676Listed by: SEA GLASS FLORIDA PROPERTIES - New
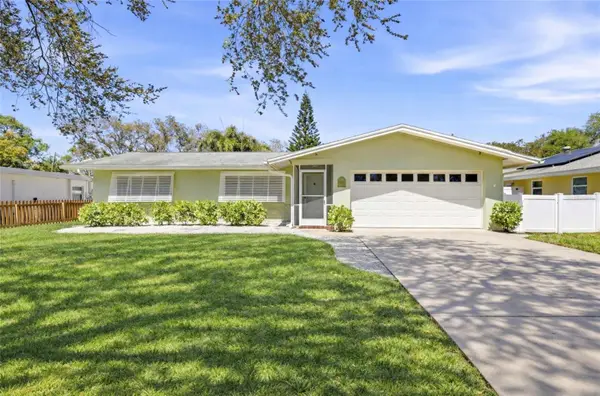
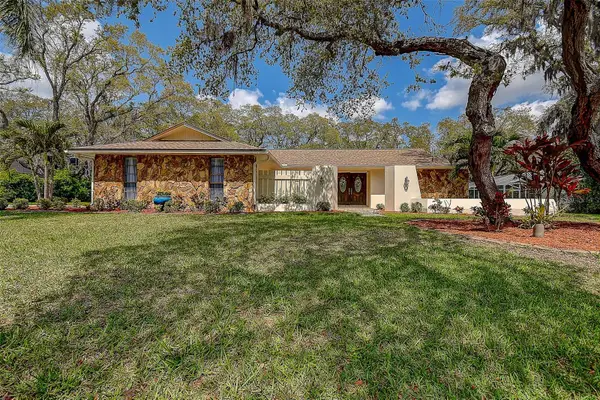 $839,000Active4 beds 3 baths2,514 sq. ft.
2840 Pheasant Run, CLEARWATER, FL 33759
MLS# TB8491568Listed by: RE/MAX REALTEC GROUP INC - New
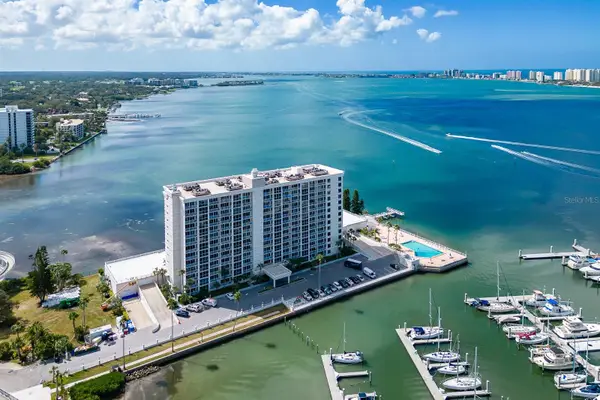
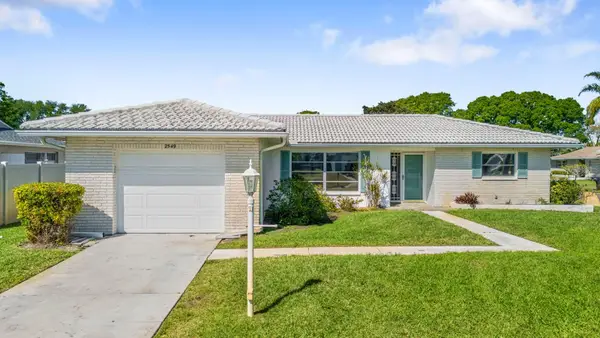
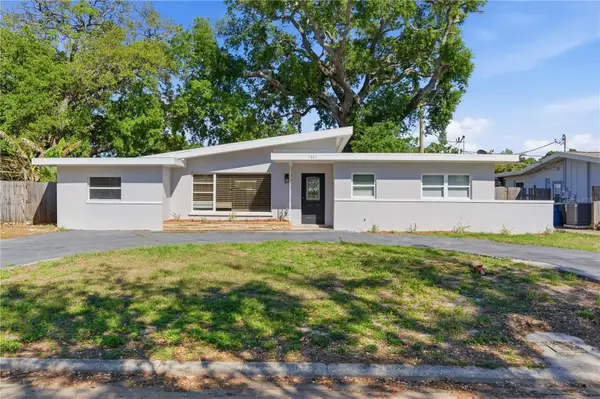
 $564,000Active3 beds 3 baths1,557 sq. ft.
2050 Magnolia Drive, CLEARWATER, FL 33764
MLS# TB8468827Listed by: COASTAL PROPERTIES GROUP INTERNATIONAL - New
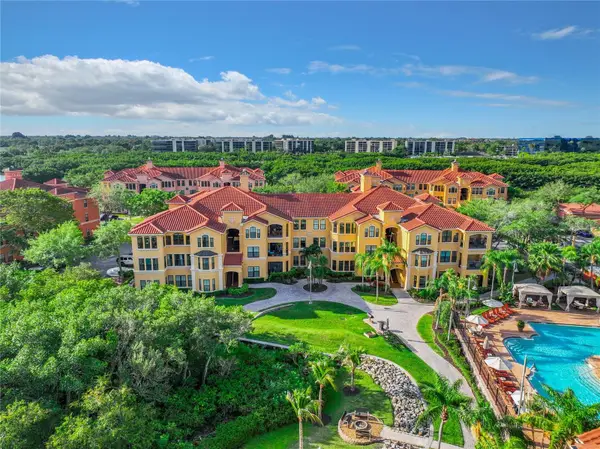
 $749,000Active3 beds 3 baths2,130 sq. ft.
100 Pierce Street #1205, CLEARWATER, FL 33756
MLS# TB8490935Listed by: COASTAL PROPERTIES GROUP INTERNATIONAL - New
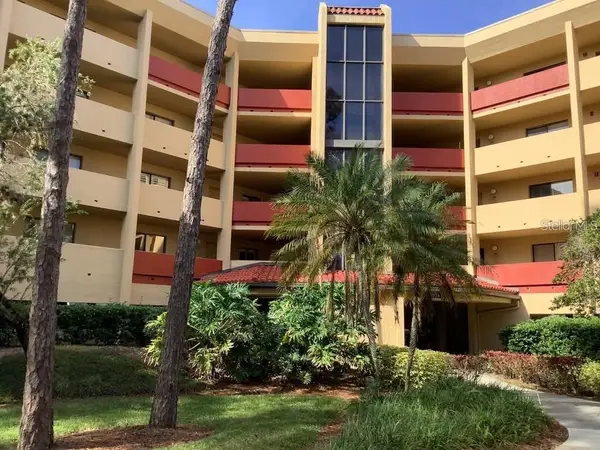
 $239,900Active1 beds 1 baths864 sq. ft.
2724 Via Murano #615, CLEARWATER, FL 33764
MLS# TB8491156Listed by: EASY STREET REALTY - New
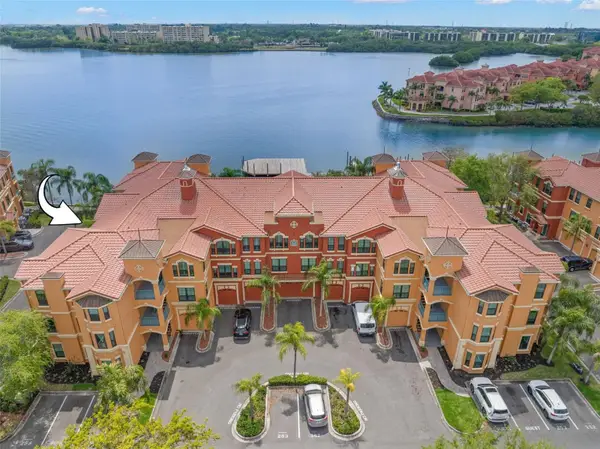
 $329,995Active2 beds 2 baths1,443 sq. ft.
2725 Via Cipriani #730A, CLEARWATER, FL 33764
MLS# TB8491177Listed by: 1 REALTY GROUP LLC - New
 $290,000Active2 beds 2 baths1,405 sq. ft.
2647 Cedar View Court, CLEARWATER, FL 33761
MLS# TB8491639Listed by: FUTURE HOME REALTY INC - New
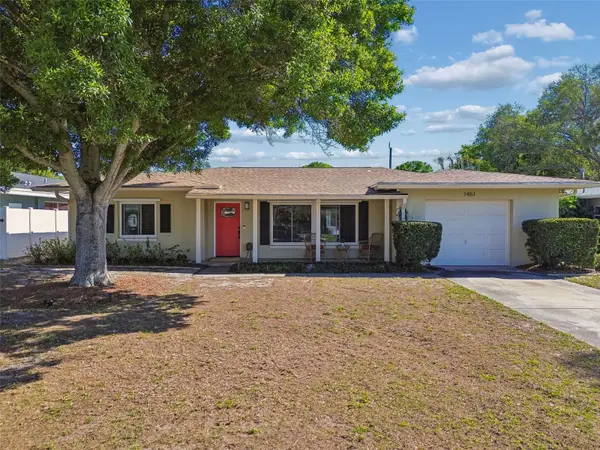
 $320,000Active2 beds 2 baths1,374 sq. ft.
1568 Drew Street, CLEARWATER, FL 33755
MLS# TB8491625Listed by: ACROPOLIS REALTY GROUP LLC - New
 $890,000Active3 beds 3 baths1,845 sq. ft.
600 Bayway Boulevard #304, CLEARWATER BEACH, FL 33767
MLS# O6394365Listed by: COSME REALTY AND INVESTMENT INC - New
 $1,569,000Active3 beds 3 baths1,952 sq. ft.
1170 Gulf Boulevard #605, CLEARWATER, FL 33767
MLS# TB8489314Listed by: COLDWELL BANKER REALTY - New
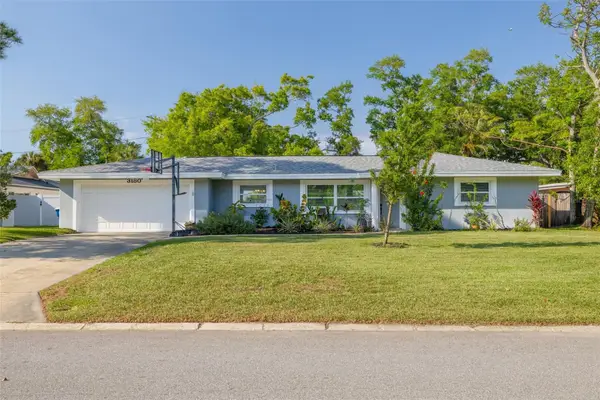 $725,000Active3 beds 3 baths1,776 sq. ft.
3180 San Pedro Street, CLEARWATER, FL 33759
MLS# TB8491145Listed by: COLDWELL BANKER REALTY - New
 $89,000Active1 beds 1 baths640 sq. ft.
1257 Drew Street #14, CLEARWATER, FL 33755
MLS# TB8491536Listed by: LUXURY & BEACH REALTY INC - New
 $214,900Active2 beds 2 baths1,250 sq. ft.
3076 Eastland Boulevard #210, CLEARWATER, FL 33761
MLS# TB8489641Listed by: CHARLES RUTENBERG REALTY INC - New
 $300,000Active2 beds 2 baths1,198 sq. ft.
2765 Via Cipriani #1232A, CLEARWATER, FL 33764
MLS# TB8489428Listed by: KELLER WILLIAMS SOUTH TAMPA - New
 $242,000Active3 beds 2 baths1,325 sq. ft.
2296 Monaco Ln #10, CLEARWATER, FL 33763
MLS# TB8489809Listed by: COLDWELL BANKER REALTY - New
 $1,500,000Active5 beds 5 baths3,714 sq. ft.
1529 Maple Street, CLEARWATER, FL 33755
MLS# TB8489745Listed by: BELLE ISLE REALTY, LLC - New
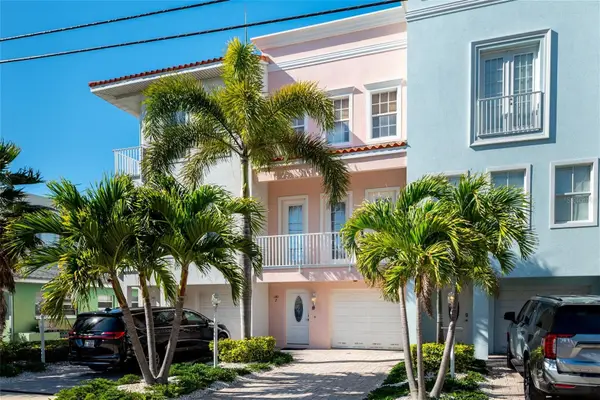 $799,900Active3 beds 3 baths2,275 sq. ft.
140 Brightwater Drive #2, CLEARWATER BEACH, FL 33767
MLS# TB8491448Listed by: REK REALTY - New
 $385,000Active2 beds 2 baths1,246 sq. ft.
1461 Satsuma Street, CLEARWATER, FL 33756
MLS# TB8490946Listed by: CENTURY 21 JIM WHITE & ASSOC - New
 $699,000Active4 beds 2 baths2,122 sq. ft.
1301 Alameda Avenue, CLEARWATER, FL 33759
MLS# TB8489215Listed by: CHARLES RUTENBERG REALTY INC - New
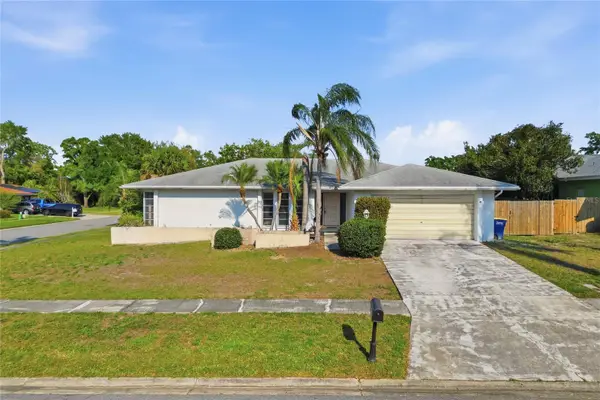
 $469,999Active3 beds 2 baths1,076 sq. ft.
1817 Hunt Lane, CLEARWATER, FL 33764
MLS# TB8491229Listed by: IMPACT REALTY TAMPA BAY - New
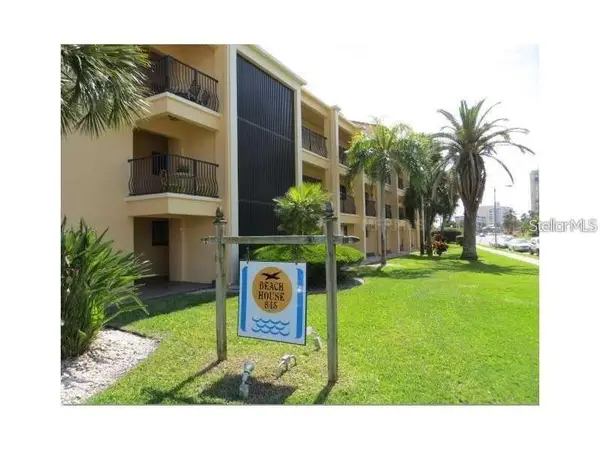 $549,999Active2 beds 2 baths900 sq. ft.
845 S Gulfview Boulevard #110, CLEARWATER BEACH, FL 33767
MLS# TB8489332Listed by: SMITH & ASSOCIATES REAL ESTATE - New
 $269,900Active2 beds 2 baths1,011 sq. ft.
2549 Oakleaf Lane #36C, CLEARWATER, FL 33763
MLS# TB8490692Listed by: GULFSHORES REALTY GROUP - New
 $450,000Active2 beds 2 baths1,335 sq. ft.
770 Island Way #N204, CLEARWATER, FL 33767
MLS# TB8490906Listed by: MAVREALTY - New
 $539,000Active4 beds 3 baths1,838 sq. ft.
219 S Corona Avenue, CLEARWATER, FL 33765
MLS# TB8491051Listed by: FLAT FEE MLS REALTY - New
 $1,098,000Active2 beds 2 baths1,676 sq. ft.
331 Cleveland St #1806, CLEARWATER, FL 33755
MLS# TB8491093Listed by: COLDWELL BANKER REALTY - New
 $290,000Active2 beds 2 baths912 sq. ft.
2317 Indigo Drive, CLEARWATER, FL 33763
MLS# TB8490591Listed by: BRICK HOUSE REALTY SERVICES - New
 $465,000Active2 beds 3 baths1,654 sq. ft.
1100 Canterbury Road, CLEARWATER, FL 33764
MLS# TB8491033Listed by: CENTURY 21 INTEGRA - New
 $269,000Active3 beds 1 baths1,016 sq. ft.
1134 Engman Street, CLEARWATER, FL 33755
MLS# TB8490884Listed by: RICHARD DOYLE REAL ESTATE - New
 $469,000Active3 beds 3 baths1,823 sq. ft.
3130 Eagles Landing Circle W, CLEARWATER, FL 33761
MLS# TB8490462Listed by: KELLER WILLIAMS REALTY- PALM H - New
 $489,600Active3 beds 3 baths1,806 sq. ft.
1618 Barry Road, CLEARWATER, FL 33756
MLS# TB8490958Listed by: CENTURY 21 CIRCLE - New
 $1,499,000Active5 beds 5 baths5,004 sq. ft.
1584 Oak Lane, CLEARWATER, FL 33764
MLS# TB8490329Listed by: BHHS FLORIDA PROPERTIES GROUP - New
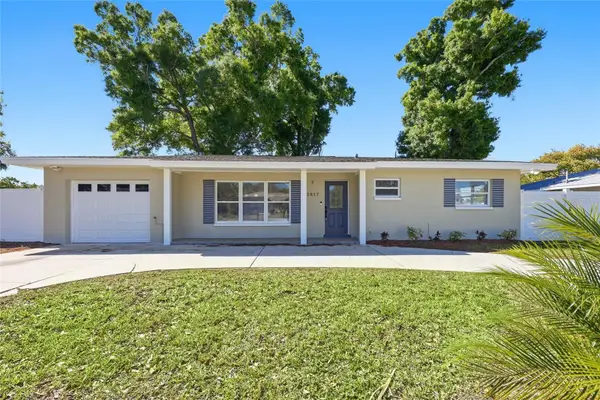
 $489,900Active3 beds 2 baths1,772 sq. ft.
2212 NE Coachman Road, CLEARWATER, FL 33765
MLS# TB8491030Listed by: PAM RYAN REALTY INC - New
 $459,900Active3 beds 2 baths1,251 sq. ft.
2190 Scotland Drive, CLEARWATER, FL 33763
MLS# TB8489947Listed by: 54 REALTY LLC - New
 $500,000Active4 beds 2 baths1,956 sq. ft.
2086 Lakewood Drive, CLEARWATER, FL 33763
MLS# TB8490611Listed by: LPT REALTY, LLC - New
 $120,000Active2 beds 2 baths1,100 sq. ft.
2434 Australia Way E #38, CLEARWATER, FL 33763
MLS# TB8490559Listed by: ON TOP OF THE WORLD RE - New
 $279,000Active2 beds 2 baths1,450 sq. ft.
2612 Pearce Drive #301, CLEARWATER, FL 33764
MLS# TB8490700Listed by: KELLER WILLIAMS REALTY PORTFOLIO COLLECTION - New
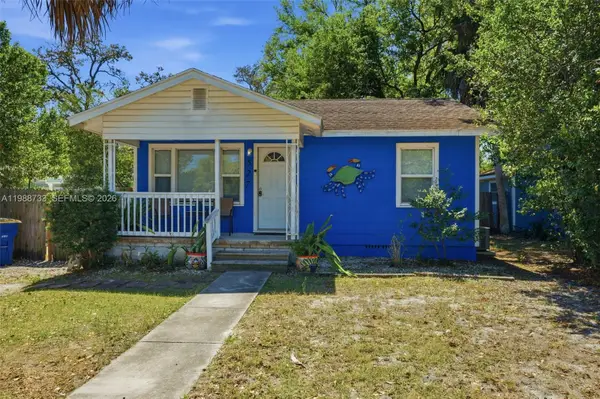 $245,000Active2 beds 1 baths
527 Wildwood Way, Clearwater, FL 33756
MLS# A11988733Listed by: REAL BROKER LLC - New
 $550,000Active3 beds 2 baths1,528 sq. ft.
2162 Cypress Point Drive N, CLEARWATER, FL 33763
MLS# TB8490754Listed by: DALTON WADE INC  $85,000Pending1 beds 1 baths825 sq. ft.
2000 World Parkway Boulevard #25, CLEARWATER, FL 33763
MLS# TB8490584Listed by: ON TOP OF THE WORLD RE- New
 $539,000Active2 beds 2 baths1,350 sq. ft.
660 Island Way #202, CLEARWATER BEACH, FL 33767
MLS# TB8488372Listed by: COASTAL PROPERTIES GROUP INTERNATIONAL - New
 $1,650,000Active4 beds 5 baths2,509 sq. ft.
475 Island Way, CLEARWATER BEACH, FL 33767
MLS# TB8488496Listed by: DALTON WADE INC - New
 $369,900Active2 beds 2 baths1,033 sq. ft.
2300 Tudor Lane, CLEARWATER, FL 33763
MLS# TB8489453Listed by: EXP REALTY LLC - New
 $1,690,000Active3 beds 3 baths2,551 sq. ft.
158 Brightwater Drive #2, CLEARWATER BEACH, FL 33767
MLS# TB8490654Listed by: SMITH & ASSOCIATES REAL ESTATE - New
 $1,298,000Active3 beds 3 baths2,040 sq. ft.
450 Gulfview Boulevard S #1708, CLEARWATER, FL 33767
MLS# TB8490666Listed by: COLDWELL BANKER REALTY - New
 $279,000Active1 beds 1 baths980 sq. ft.
2755 Via Capri #1237, CLEARWATER, FL 33764
MLS# TB8490102Listed by: SERVICE NEAR REALTY - New
 $499,900Active3 beds 2 baths1,350 sq. ft.
2767 Poppyseed Court, CLEARWATER, FL 33761
MLS# TB8490736Listed by: RESULTS REAL ESTATE INC - New
 $199,900Active2 beds 2 baths1,210 sq. ft.
2291 Americus Boulevard W #37, CLEARWATER, FL 33763
MLS# TB8490682Listed by: REAL ESTATE FIRM OF FLORIDA, LLC - New
 $109,900Active3 beds 2 baths1,280 sq. ft.
2625 State Road 590 #2423, CLEARWATER, FL 33759
MLS# O6393706Listed by: IRG CORPORATION - New
 $1,350,000Active3 beds 3 baths2,112 sq. ft.
850 Mandalay Avenue, CLEARWATER BEACH, FL 33767
MLS# TB8489421Listed by: HUTCHESON REAL ESTATE - New
 $94,000Active2 beds 1 baths840 sq. ft.
1221 Drew Street #A2, CLEARWATER, FL 33755
MLS# TB8489450Listed by: HUTCHESON REAL ESTATE - New
 $779,500Active4 beds 3 baths2,690 sq. ft.
2889 Fair Green Drive, CLEARWATER, FL 33761
MLS# TB8489976Listed by: CANCELLI COASTAL REALTY - New
 $675,000Active3 beds 2 baths1,226 sq. ft.
1135 Marine Street, CLEARWATER, FL 33755
MLS# O6393597Listed by: BEYCOME OF FLORIDA LLC - New
 $2,300,000Active4 beds 4 baths2,538 sq. ft.
624 Snug Island, CLEARWATER, FL 33767
MLS# TB8489381Listed by: SMITH & ASSOCIATES REAL ESTATE - New
 $159,000Active2 beds 2 baths1,100 sq. ft.
2447 Ecuadorian Way #73, CLEARWATER, FL 33763
MLS# TB8490331Listed by: ON TOP OF THE WORLD RE - New
 $3,495,000Active4 beds 4 baths4,944 sq. ft.
42 Midway Island, CLEARWATER, FL 33767
MLS# TB8489806Listed by: LPT REALTY, LLC - New
 $369,900Active3 beds 2 baths1,332 sq. ft.
1415 Wood Avenue, CLEARWATER, FL 33755
MLS# TB8490045Listed by: EXP REALTY LLC - New
 $475,000Active3 beds 2 baths1,446 sq. ft.
3016 Sarah Drive, CLEARWATER, FL 33759
MLS# TB8474810Listed by: EATON REALTY - New
 $213,900Active2 beds 2 baths1,360 sq. ft.
2440 World Parkway Boulevard #6, CLEARWATER, FL 33763
MLS# TB8490051Listed by: ON TOP OF THE WORLD RE - New
 $649,900Active3 beds 2 baths1,385 sq. ft.
1022 Sunnydale Drive, CLEARWATER, FL 33755
MLS# TB8489270Listed by: HOMESCENE REALTY - New
 $380,000Active2 beds 2 baths1,641 sq. ft.
2549 Wynnewood Drive, CLEARWATER, FL 33763
MLS# TB8490284Listed by: RE/MAX REALTY UNLIMITED 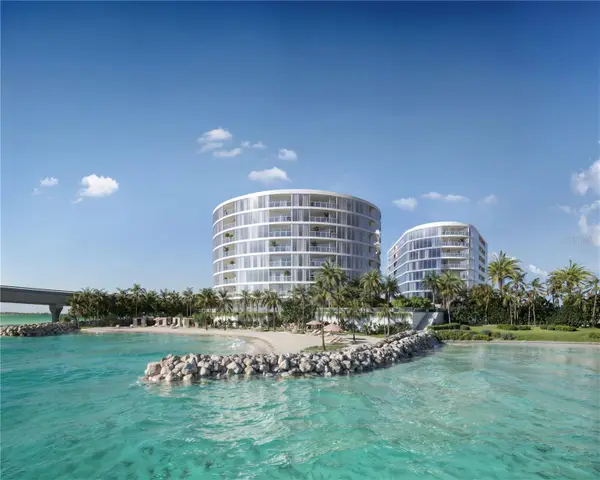 $3,050,000Pending3 beds 4 baths2,419 sq. ft.
805 S Gulfview Blvd #606A, CLEARWATER BEACH, FL 33767
MLS# TB8490064Listed by: VCWB DEVELOPMENT SALES, LLC- New
 $1,585,000Active3 beds 4 baths2,150 sq. ft.
165 Marina Del Rey Court, CLEARWATER BEACH, FL 33767
MLS# TB8489526Listed by: COLDWELL BANKER REALTY  $189,900Pending2 beds 2 baths1,045 sq. ft.
2400 Winding Creek Boulevard #20A, CLEARWATER, FL 33761
MLS# TB8488692Listed by: LIPPLY REAL ESTATE- New
 $149,900Active2 beds 1 baths812 sq. ft.
1276 Mission Circle #45A, CLEARWATER, FL 33759
MLS# TB8488777Listed by: DUNEDIN REALTY LLC - New
 $299,900Active3 beds 1 baths1,097 sq. ft.
1579 S Washington Avenue, CLEARWATER, FL 33756
MLS# TB8489889Listed by: CHARLES RUTENBERG REALTY INC - New
 $319,900Active3 beds 2 baths1,101 sq. ft.
1320 Mary L Road, CLEARWATER, FL 33755
MLS# TB8490040Listed by: REALTY EXPERTS - New
 $525,000Active3 beds 3 baths2,055 sq. ft.
1620 Rachel Court, CLEARWATER, FL 33756
MLS# TB8490029Listed by: ENGEL & VOLKERS BELLEAIR - New
 $425,000Active2 beds 2 baths1,269 sq. ft.
100 Pierce Street #703, CLEARWATER, FL 33756
MLS# TB8484494Listed by: EXP REALTY LLC - New
 $1,999,900Active4 beds 3 baths2,794 sq. ft.
158 Brightwater Drive #1, CLEARWATER BEACH, FL 33767
MLS# TB8489704Listed by: BHHS FLORIDA PROPERTIES GROUP - New
 $987,000Active2 beds 2 baths1,427 sq. ft.
1180 Gulf Blvd #504, CLEARWATER BEACH, FL 33767
MLS# TB8489738Listed by: COLDWELL BANKER REALTY - New
 $417,500Active3 beds 2 baths1,863 sq. ft.
894 Lantern Way, CLEARWATER, FL 33765
MLS# TB8489808Listed by: FUTURE HOME REALTY INC - New
 $1,545,000Active3 beds 3 baths1,952 sq. ft.
1180 Gulf Boulevard #1805, CLEARWATER BEACH, FL 33767
MLS# TB8484165Listed by: COMPASS FLORIDA LLC - New
 $474,900Active3 beds 2 baths1,476 sq. ft.
1505 Laura Street, CLEARWATER, FL 33755
MLS# TB8489385Listed by: 1ST INVESTMENT REALTY GROUP LLC - New
 $375,000Active2 beds 2 baths1,276 sq. ft.
1332/1334 Tioga Avenue, CLEARWATER, FL 33756
MLS# TB8489600Listed by: TORRENCE REAL ESTATE EXCHANGE - New
 $247,500Active2 beds 2 baths1,129 sq. ft.
2486 Bay Berry Drive, CLEARWATER, FL 33763
MLS# TB8489676Listed by: EQUITY REALTY SUNCOAST - New
 $419,000Active3 beds 2 baths1,976 sq. ft.
1658 Jeffords Street, CLEARWATER, FL 33756
MLS# TB8489157Listed by: YELLOWFIN REALTY - New
 $140,000Active2 beds 2 baths900 sq. ft.
1303 S Hercules Avenue #2, CLEARWATER, FL 33764
MLS# TB8487757Listed by: ALIGN RIGHT REALTY CARROLLWOOD - New
 $149,900Active2 beds 2 baths1,400 sq. ft.
2285 Israeli Drive #45, CLEARWATER, FL 33763
MLS# TB8489084Listed by: RE/MAX REALTEC GROUP INC 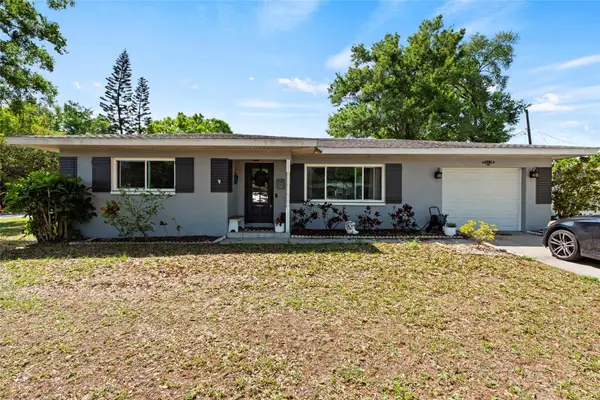 $275,000Pending2 beds 2 baths1,160 sq. ft.
1361 Belleair Road, CLEARWATER, FL 33756
MLS# A4685833Listed by: EXP REALTY, LLC- New
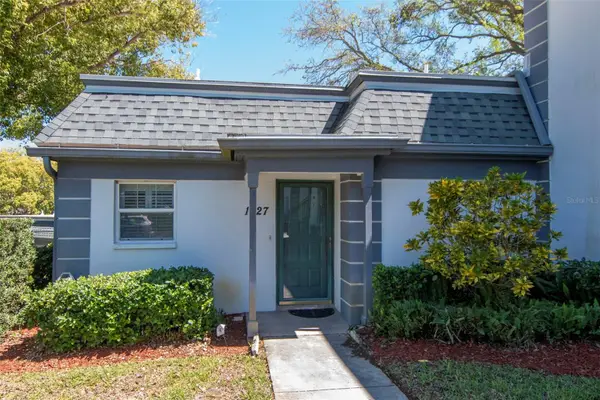 $206,000Active2 beds 2 baths1,357 sq. ft.
1227 N Mcmullen Booth Road #1227, CLEARWATER, FL 33759
MLS# TB8488394Listed by: COLDWELL BANKER REALTY - New
 $429,900Active3 beds 2 baths1,503 sq. ft.
1321 Murray Avenue, CLEARWATER, FL 33755
MLS# TB8488543Listed by: MAVREALTY  $299,900Pending3 beds 1 baths780 sq. ft.
1201 S Betty Lane, CLEARWATER, FL 33756
MLS# TB8489173Listed by: RE/MAX REALTEC GROUP INC- New
 $147,900Active2 beds 2 baths886 sq. ft.
2996 Mission Drive E #60E, CLEARWATER, FL 33759
MLS# TB8489302Listed by: SADLER SUNCOAST REALTY - New
 $149,000Active2 beds 2 baths864 sq. ft.
29250 Us Highway 19 N #610, CLEARWATER, FL 33761
MLS# TB8489266Listed by: SELECT REAL ESTATE OF PINELLAS - New
 $334,900Active3 beds 2 baths1,232 sq. ft.
2765 State Road 590, CLEARWATER, FL 33759
MLS# TB8488705Listed by: COASTAL PROPERTIES GROUP INTERNATIONAL - New
 $999,000Active3 beds 3 baths1,833 sq. ft.
1109 Charles Street, CLEARWATER, FL 33755
MLS# TB8489075Listed by: CHARLES RUTENBERG REALTY INC  $249,900Pending2 beds 2 baths1,160 sq. ft.
2070 Lakeview Drive #204, CLEARWATER, FL 33763
MLS# TB8488680Listed by: BILTMORE GROUP INC- New
 $210,000Active2 beds 2 baths1,440 sq. ft.
2220 Swedish Drive #36, CLEARWATER, FL 33763
MLS# TB8489179Listed by: COLDWELL BANKER REALTY - New
 $545,000Active3 beds 2 baths1,713 sq. ft.
912 S Highland Avenue, CLEARWATER, FL 33756
MLS# TB8487981Listed by: LPT REALTY, LLC.  $326,900Pending3 beds 2 baths1,170 sq. ft.
317 Elizabeth Avenue, CLEARWATER, FL 33759
MLS# TB8489144Listed by: COLDWELL BANKER REALTY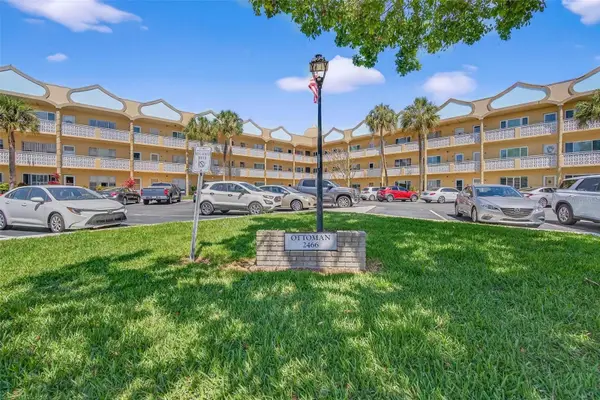 $118,750Pending1 beds 1 baths825 sq. ft.
2466 Ecuadorian Way #20, CLEARWATER, FL 33763
MLS# TB8487137Listed by: COLDWELL BANKER REALTY- New
 $2,150,000Active3 beds 4 baths2,997 sq. ft.
707 Snug Island, CLEARWATER BEACH, FL 33767
MLS# TB8489063Listed by: CHARLES RUTENBERG REALTY INC - New
 $3,199,999Active3 beds 3 baths1,973 sq. ft.
11 Baymont Street #907, CLEARWATER BEACH, FL 33767
MLS# TB8489056Listed by: KELLER WILLIAMS TAMPA CENTRAL - New
 $338,000Active2 beds 1 baths857 sq. ft.
2305 Indigo Drive, CLEARWATER, FL 33763
MLS# TB8489010Listed by: DALTON WADE INC  $600,000Pending3 beds 2 baths1,494 sq. ft.
1204 San Domingo Court, CLEARWATER, FL 33759
MLS# TB8488015Listed by: FUTURE HOME REALTY INC- New
 $625,000Active2 beds 2 baths1,111 sq. ft.
1230 Gulf Boulevard #303, CLEARWATER BEACH, FL 33767
MLS# TB8488075Listed by: DENNIS REALTY & INV. CORP. - New
 $280,000Active3 beds 2 baths1,397 sq. ft.
2210 Utopian Drive E #203, CLEARWATER, FL 33763
MLS# TB8488091Listed by: COLDWELL BANKER REALTY - New
 $168,000Active2 beds 2 baths1,100 sq. ft.
2330 Ecuadorian Way #32, CLEARWATER, FL 33763
MLS# TB8488701Listed by: DALTON WADE INC - New
 $1,260,000Active2 beds 2 baths1,427 sq. ft.
1180 Gulf Boulevard #1504, CLEARWATER, FL 33767
MLS# TB8480776Listed by: EXP REALTY LLC - New
 $670,000Active2 beds 2 baths1,331 sq. ft.
1480 Gulf Boulevard #108, CLEARWATER BEACH, FL 33767
MLS# TB8488744Listed by: THE BASEL HOUSE - New
 $337,900Active3 beds 2 baths1,274 sq. ft.
1125 Engman Street, CLEARWATER, FL 33755
MLS# TB8486464Listed by: LA ROSA REALTY, LLC - New
 $139,000Active2 beds 2 baths1,224 sq. ft.
29250 Us Highway 19 N #135, CLEARWATER, FL 33761
MLS# TB8488594Listed by: SELECT REAL ESTATE OF PINELLAS - New
 $549,000Active2 beds 2 baths1,310 sq. ft.
830 S Gulfview Boulevard #501, CLEARWATER BEACH, FL 33767
MLS# TB8488507Listed by: EZ CHOICE REALTY  $415,000Pending4 beds 3 baths2,292 sq. ft.
2065 Envoy Court, CLEARWATER, FL 33764
MLS# TB8487033Listed by: ENGEL & VOLKERS BELLEAIR- New
 $189,000Active2 beds 2 baths1,105 sq. ft.
2593 Countryside Boulevard #7206, CLEARWATER, FL 33761
MLS# TB8488533Listed by: CHARLES RUTENBERG REALTY INC - New
 $118,900Active1 beds 1 baths825 sq. ft.
2043 Denmark Street #65, CLEARWATER, FL 33763
MLS# TB8488486Listed by: BHHS FLORIDA PROPERTIES GROUP - New
 $225,000Active2 beds 1 baths867 sq. ft.
542 Plumosa Avenue, CLEARWATER, FL 33756
MLS# TB8487218Listed by: COMPASS FLORIDA LLC - New
 $314,900Active2 beds 2 baths1,070 sq. ft.
2371 Indigo Drive, CLEARWATER, FL 33763
MLS# TB8487837Listed by: DALTON WADE INC - New
 $419,900Active3 beds 2 baths1,301 sq. ft.
2465 Brentwood Drive, CLEARWATER, FL 33764
MLS# TB8486514Listed by: THE SHOP REAL ESTATE CO. - New
 $268,888Active2 beds 1 baths676 sq. ft.
1918 Macomber Avenue, CLEARWATER, FL 33755
MLS# TB8488294Listed by: BAYSIDE EXECUTIVE REALTY - New
 $309,000Active4 beds 2 baths1,585 sq. ft.
2074 Sunset Point Road #137, CLEARWATER, FL 33765
MLS# TB8488200Listed by: PRISTINE FLORIDA PROPERTIES LLC - New
 $560,000Active2 beds 2 baths1,181 sq. ft.
868 Bayway Boulevard #101, CLEARWATER BEACH, FL 33767
MLS# TB8488114Listed by: COLDWELL BANKER REALTY - New
 $870,000Active3 beds 2 baths2,569 sq. ft.
2351 NE Coachman Road, CLEARWATER, FL 33765
MLS# TB8485243Listed by: KELLER WILLIAMS REALTY- PALM H - New
 $390,000Active3 beds 3 baths1,616 sq. ft.
2519 Northfield Lane, CLEARWATER, FL 33761
MLS# TB8487157Listed by: KELLER WILLIAMS REALTY- PALM H - New
 $149,900Active1 beds 1 baths875 sq. ft.
200 N Betty Lane #1C, CLEARWATER, FL 33755
MLS# A4686445Listed by: NETWORK REAL ESTATE GROUP - New
 $698,800Active2 beds 2 baths1,324 sq. ft.
1591 Gulf Boulevard #405S, CLEARWATER, FL 33767
MLS# TB8487732Listed by: COASTAL PROPERTIES GROUP INTERNATIONAL - New
 $569,000Active2 beds 2 baths1,367 sq. ft.
311 Island Way #203, CLEARWATER BEACH, FL 33767
MLS# TB8488135Listed by: AGILE GROUP REALTY  $430,000Active3 beds 2 baths1,482 sq. ft.
2196 Bell Cheer Drive, CLEARWATER, FL 33764
MLS# TB8488106Listed by: MCBRIDE KELLY & ASSOCIATES $699,999Pending2 beds 2 baths1,026 sq. ft.
865 S Gulfview Boulevard #106, CLEARWATER BEACH, FL 33767
MLS# TB8485055Listed by: COASTAL PROPERTIES GROUP INTERNATIONAL $409,900Active2 beds 2 baths1,249 sq. ft.
2336 Nash Street, CLEARWATER, FL 33765
MLS# TB8485233Listed by: EXP REALTY LLC $525,000Pending3 beds 2 baths1,782 sq. ft.
1837 Carlton Drive, CLEARWATER, FL 33759
MLS# TB8487880Listed by: SMITH & ASSOCIATES REAL ESTATE $150,000Pending2 beds 2 baths1,200 sq. ft.
2623 Seville Boulevard #106, CLEARWATER, FL 33764
MLS# TB8487294Listed by: KELLER WILLIAMS REALTY- PALM H $639,000Active2 beds 2 baths1,298 sq. ft.
1460 Gulf Boulevard #511, CLEARWATER BEACH, FL 33767
MLS# TB8487809Listed by: HOMECOIN.COM $349,999Active0.42 Acres
0 Sunset Point Road, CLEARWATER, FL 33755
MLS# TB8484047Listed by: ENGEL & VOLKERS BELLEAIR $225,000Active1 beds 1 baths710 sq. ft.
300 Venetian Drive #3, CLEARWATER, FL 33755
MLS# TB8481506Listed by: KELLER WILLIAMS REALTY- PALM H $179,900Active1 beds 1 baths645 sq. ft.
704 Hammock Pine Boulevard #704, CLEARWATER, FL 33761
MLS# TB8487177Listed by: FLAT FEE MLS REALTY $275,000Pending2 beds 1 baths910 sq. ft.
1541 Illinois Road, CLEARWATER, FL 33756
MLS# TB8487532Listed by: BHHS FLORIDA PROPERTIES GROUP $350,000Active2 beds 2 baths1,060 sq. ft.
500 N Osceola Avenue #810, CLEARWATER, FL 33755
MLS# TB8487792Listed by: GREAT HOMES REALTY INC $113,000Active2 beds 2 baths813 sq. ft.
1799 N Highland Avenue #155, CLEARWATER, FL 33755
MLS# TB8487393Listed by: EXP REALTY LLC $225,000Active1 beds 1 baths710 sq. ft.
300 Venetian Drive #2, CLEARWATER, FL 33755
MLS# TB8479455Listed by: KELLER WILLIAMS REALTY- PALM H $515,000Active2 beds 2 baths1,007 sq. ft.
868 Bayway Boulevard #210, CLEARWATER BEACH, FL 33767
MLS# TB8487112Listed by: COASTAL PROPERTIES GROUP INTERNATIONAL $305,000Active2 beds 1 baths1,095 sq. ft.
1949 Pinehurst Drive, CLEARWATER, FL 33763
MLS# TB8486602Listed by: GULF SHORES REALTY ERA POWERED LLC $449,900Active2 beds 2 baths1,100 sq. ft.
1651 Sand Key Estates Court #53, CLEARWATER, FL 33767
MLS# A4686082Listed by: EXP REALTY, LLC $475,000Active3 beds 2 baths2,252 sq. ft.
1735 Union Street, CLEARWATER, FL 33755
MLS# TB8477663Listed by: BILTMORE GROUP INC $519,900Pending3 beds 2 baths1,435 sq. ft.
1467 Bugle Lane, CLEARWATER, FL 33764
MLS# TB8487365Listed by: COASTAL PROPERTIES GROUP INTERNATIONAL $433,250Active3 beds 2 baths1,547 sq. ft.
1477 S Prescott Avenue, CLEARWATER, FL 33756
MLS# O6389565Listed by: MAINSTAY BROKERAGE LLC $125,000Active2 beds 1 baths972 sq. ft.
1235 S Highland Avenue #2-307, CLEARWATER, FL 33756
MLS# TB8485767Listed by: CHARLES RUTENBERG REALTY INC $649,900Pending3 beds 3 baths2,238 sq. ft.
3225 Masters Drive, CLEARWATER, FL 33761
MLS# TB8487159Listed by: YOU FIRST REALTY AND ASSOC LLC $399,000Active2 beds 2 baths1,158 sq. ft.
2063 Pine Ridge Drive, CLEARWATER, FL 33763
MLS# TB8487303Listed by: DALTON WADE INC $139,900Active2 beds 2 baths1,075 sq. ft.
2971 Estancia Boulevard #229, CLEARWATER, FL 33761
MLS# A4686419Listed by: DALTON WADE INC $169,000Active1 beds 1 baths830 sq. ft.
2761 Countryside Boulevard #105, CLEARWATER, FL 33761
MLS# TB8485949Listed by: LIPPLY REAL ESTATE $550,000Pending3 beds 2 baths1,695 sq. ft.
2997 Kenilwick Drive S, CLEARWATER, FL 33761
MLS# TB8485528Listed by: REDFIN CORPORATION $169,000Pending2 beds 2 baths1,400 sq. ft.
2001 World Parkway Boulevard #3, CLEARWATER, FL 33763
MLS# TB8487052Listed by: ON TOP OF THE WORLD RE $145,000Active2 beds 1 baths812 sq. ft.
1175 Mission Circle #1175, CLEARWATER, FL 33759
MLS# TB8485266Listed by: COLDWELL BANKER REALTY $420,000Pending2 beds 2 baths1,596 sq. ft.
2036 W Ridge Drive, CLEARWATER, FL 33763
MLS# TB8485281Listed by: COMPASS FLORIDA, LLC $975,000Active3 beds 2 baths1,850 sq. ft.
125 Island Way #402, CLEARWATER BEACH, FL 33767
MLS# TB8486879Listed by: RE/MAX ACTION FIRST OF FLORIDA $489,000Active2 beds 2 baths1,520 sq. ft.
2071 Butternut Circle E, CLEARWATER, FL 33763
MLS# TB8486461Listed by: DALTON WADE INC $110,000Active1 beds 1 baths825 sq. ft.
2000 World Parkway Boulevard #6, CLEARWATER, FL 33763
MLS# TB8487106Listed by: ON TOP OF THE WORLD RE $435,000Active2 beds 3 baths1,280 sq. ft.
15 Turner Street #4, CLEARWATER, FL 33756
MLS# TB8485916Listed by: BELLOISE REALTY $695,000Active2 beds 2 baths1,186 sq. ft.
450 S Gulfview Boulevard #208, CLEARWATER BEACH, FL 33767
MLS# TB8486531Listed by: EZ CHOICE REALTY $599,000Active1 beds 2 baths1,100 sq. ft.
1540 Gulf Boulevard #2205, CLEARWATER BEACH, FL 33767
MLS# TB8486887Listed by: COASTAL PROPERTIES GROUP INTERNATIONAL $325,000Active3 beds 2 baths1,120 sq. ft.
1061 Nokomis Street, CLEARWATER, FL 33755
MLS# TB8483549Listed by: URBAN CORE REALTY $53,000Active1 beds 1 baths588 sq. ft.
1600 N Old Coachman Rd Road #806, CLEARWATER, FL 33765
MLS# TB8486232Listed by: DALTON WADE INC $499,000Pending3 beds 1 baths1,040 sq. ft.
815 Lantana Avenue, CLEARWATER BEACH, FL 33767
MLS# TB8486384Listed by: KELLER WILLIAMS ST PETE REALTY $130,000Pending1 beds 1 baths682 sq. ft.
2211 Belleair Road #D3, CLEARWATER, FL 33764
MLS# TB8486743Listed by: KELLER WILLIAMS ST PETE REALTY $299,500Active2 beds 2 baths860 sq. ft.
1024 Apache Trail, CLEARWATER, FL 33755
MLS# TB8486499Listed by: INTL. REALTY PLUS-TAMPA BAY $136,000Active1 beds 1 baths564 sq. ft.
18675 Us Highway 19 N #328, CLEARWATER, FL 33764
MLS# TB8485827Listed by: CHARLES RUTENBERG REALTY INC $1,200,000Active3 beds 2 baths1,760 sq. ft.
125 Island Way #503, CLEARWATER BEACH, FL 33767
MLS# TB8486420Listed by: MAVREALTY $329,000Active3 beds 2 baths1,590 sq. ft.
18675 Us Highway 19 N #256, CLEARWATER, FL 33764
MLS# TB8485584Listed by: CHARLES RUTENBERG REALTY INC $149,500Active2 beds 2 baths886 sq. ft.
1395 Mission Drive W #28C, CLEARWATER, FL 33759
MLS# TB8485693Listed by: REALTY ONE GROUP SUNSHINE $310,000Active2 beds 1 baths1,088 sq. ft.
1010 Plaza Street, CLEARWATER, FL 33755
MLS# TB8486662Listed by: HIGH POINT REALTY INC $210,000Pending2 beds 2 baths1,040 sq. ft.
2506 Hammock Court #2506, CLEARWATER, FL 33761
MLS# TB8486173Listed by: CHARLES RUTENBERG REALTY INC $204,900Active1 beds 1 baths1,005 sq. ft.
31 Island Way #1205, CLEARWATER BEACH, FL 33767
MLS# TB8459366Listed by: COLDWELL BANKER REALTY $319,900Active2 beds 1 baths910 sq. ft.
1917 Gilbert Street, CLEARWATER, FL 33765
MLS# TB8481337Listed by: EZ CHOICE REALTY $389,000Pending4 beds 2 baths1,417 sq. ft.
1149 Woodlawn Street, CLEARWATER, FL 33756
MLS# TB8485453Listed by: MELENDY REAL ESTATE $150,000Active1 beds 1 baths750 sq. ft.
2064 Sunset Point Road #71, CLEARWATER, FL 33765
MLS# TB8484603Listed by: KELLER WILLIAMS SOUTH SHORE $279,000Pending2 beds 2 baths1,675 sq. ft.
2170 Americus Boulevard S #4, CLEARWATER, FL 33763
MLS# TB8484019Listed by: GREYHOUSE ENTERPRISES INC $199,999Active2 beds 1 baths948 sq. ft.
129 N Mercury Avenue, CLEARWATER, FL 33765
MLS# TB8486433Listed by: EASY HOME SALES $1,088,000Active3 beds 3 baths1,949 sq. ft.
756 Mandalay Avenue, CLEARWATER BEACH, FL 33767
MLS# TB8485832Listed by: SANTANA AND COMPANY REAL ESTATE $1,495,000Active2 beds 3 baths1,824 sq. ft.
1020 Sunset Point Road #505, CLEARWATER, FL 33755
MLS# TB8484081Listed by: GREAT HOMES REALTY INC $325,000Pending2 beds 2 baths1,308 sq. ft.
1424 Pine Street, CLEARWATER, FL 33756
MLS# TB8486386Listed by: SOUTHERN LIFE REALTY $309,000Pending2 beds 3 baths1,040 sq. ft.
1211 S Lake Drive, CLEARWATER, FL 33756
MLS# TB8483765Listed by: STATION SQUARE REALTY LLC $375,000Active2 beds 1 baths1,304 sq. ft.
2232 Norman Drive, CLEARWATER, FL 33765
MLS# TB8486139Listed by: ARC REALTY GROUP $895,500Pending4 beds 3 baths2,307 sq. ft.
3302 San Jose Street, CLEARWATER, FL 33759
MLS# TB8485803Listed by: PREMIER SOTHEBYS INTL REALTY $350,000Pending4 beds 2 baths2,583 sq. ft.
1488 Laconia Drive E, CLEARWATER, FL 33764
MLS# TB8486060Listed by: COMPASS FLORIDA LLC $299,900Pending2 beds 2 baths1,100 sq. ft.
101 S Maywood Avenue, CLEARWATER, FL 33765
MLS# TB8483832Listed by: DALTON WADE INC $595,000Active3 beds 2 baths1,701 sq. ft.
1546 Belleair Road, CLEARWATER, FL 33756
MLS# TB8473245Listed by: FLORIDA PREMIERE REALTY $1,500,000Active3 beds 3 baths1,952 sq. ft.
1180 Gulf Boulevard #1105, CLEARWATER, FL 33767
MLS# TB8484423Listed by: SAND KEY REALTY $759,900Active2 beds 2 baths1,610 sq. ft.
1660 Gulf Boulevard #807, CLEARWATER, FL 33767
MLS# TB8484695Listed by: CHARLES RUTENBERG REALTY INC $2,224,000Active4 beds 4 baths2,780 sq. ft.
430 Palm Island Se, CLEARWATER BEACH, FL 33767
MLS# TB8484148Listed by: COASTAL PROPERTIES GROUP INTERNATIONAL $575,000Active2 beds 2 baths1,450 sq. ft.
500 N Osceola Avenue #406, CLEARWATER, FL 33755
MLS# TB8479503Listed by: FLORIDA PREMIERE REALTY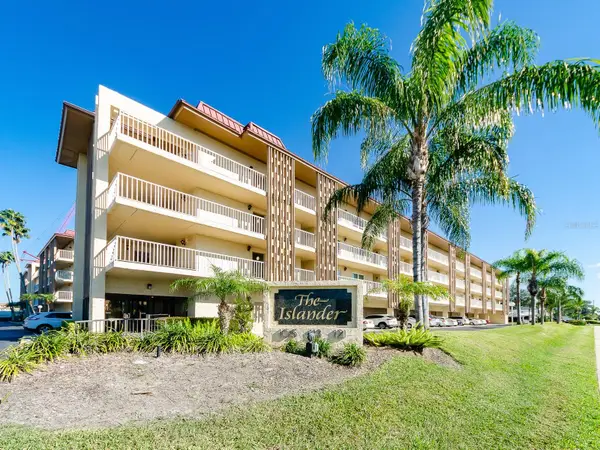 $299,000Active2 beds 2 baths1,192 sq. ft.
105 Island Way #143, CLEARWATER, FL 33767
MLS# TB8486122Listed by: CHARLES RUTENBERG REALTY INC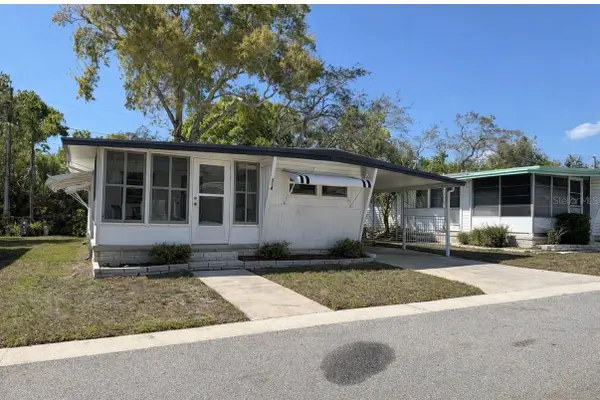 $95,000Active2 beds 2 baths900 sq. ft.
2331 Belleair Road #514, CLEARWATER, FL 33764
MLS# TB8484643Listed by: KELLER WILLIAMS REALTY- PALM H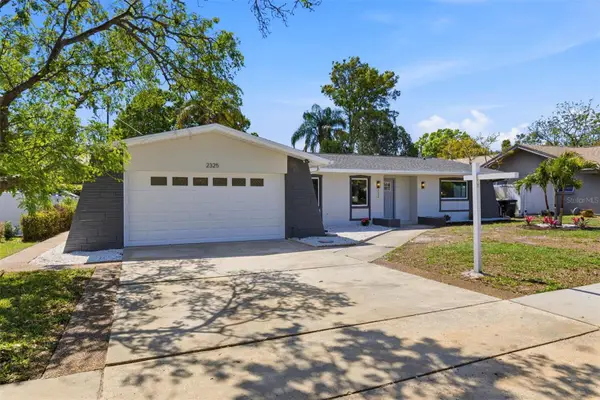 $599,000Pending4 beds 2 baths2,264 sq. ft.
2325 Glenmoor Road N, CLEARWATER, FL 33764
MLS# TB8485993Listed by: RE/MAX ACTION FIRST OF FLORIDA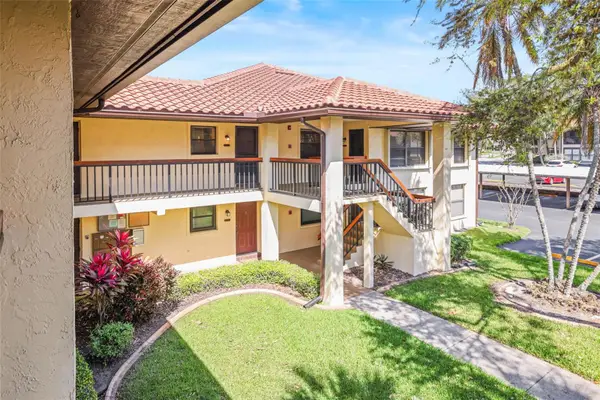 $250,000Active2 beds 2 baths1,030 sq. ft.
2113 Hammock Pine Boulevard #2113, CLEARWATER, FL 33761
MLS# TB8485882Listed by: KATIE DUCHARME REALTY, LLC $210,000Active2 beds 2 baths1,100 sq. ft.
2436 Rhodesian Drive #32, CLEARWATER, FL 33763
MLS# W7883856Listed by: REALTY ONE GROUP MVP $1,199,999Pending2 beds 2 baths1,609 sq. ft.
1290 Gulf Boulevard #408, CLEARWATER BEACH, FL 33767
MLS# TB8485764Listed by: RE/MAX ACTION FIRST OF FLORIDA $950,000Active3 beds 2 baths1,965 sq. ft.
211 Dolphin Point #201, CLEARWATER, FL 33767
MLS# TB8485670Listed by: COLDWELL BANKER REALTY $1,075,000Active3 beds 2 baths1,950 sq. ft.
211 Dolphin Point #203, CLEARWATER, FL 33767
MLS# TB8485699Listed by: COLDWELL BANKER REALTY $1,090,000Active3 beds 2 baths1,900 sq. ft.
211 Dolphin Point #302, CLEARWATER, FL 33767
MLS# TB8485704Listed by: COLDWELL BANKER REALTY $1,125,000Active3 beds 2 baths1,950 sq. ft.
211 Dolphin Point #303, CLEARWATER, FL 33767
MLS# TB8485711Listed by: COLDWELL BANKER REALTY $1,110,000Active3 beds 2 baths1,965 sq. ft.
211 Dolphin Point #401, CLEARWATER BEACH, FL 33767
MLS# TB8485717Listed by: COLDWELL BANKER REALTY $452,500Pending4 beds 3 baths1,484 sq. ft.
905 Plaza Street, CLEARWATER, FL 33755
MLS# TB8485989Listed by: NEXTHOME SOUTH POINTE $399,500Pending4 beds 3 baths1,392 sq. ft.
1832 Greenhill Drive, CLEARWATER, FL 33755
MLS# TB8485892Listed by: YANY REALTY LLC $400,000Active3 beds 2 baths1,560 sq. ft.
2221 Terrace Drive N, CLEARWATER, FL 33765
MLS# TB8484442Listed by: KELLER WILLIAMS REALTY- PALM H $449,900Pending3 beds 2 baths1,503 sq. ft.
1666 Monterey Drive, CLEARWATER, FL 33756
MLS# TB8484048Listed by: MAVREALTY $1,275,000Active2 beds 2 baths1,405 sq. ft.
11 Baymont Street #1109, CLEARWATER BEACH, FL 33767
MLS# TB8484158Listed by: COLDWELL BANKER REALTY $374,900Pending3 beds 3 baths1,758 sq. ft.
829 Horizon Way, CLEARWATER, FL 33764
MLS# TB8485449Listed by: IVY LEAGUE REALTY $345,000Active2 beds 2 baths720 sq. ft.
1362 Milton Street, CLEARWATER, FL 33756
MLS# TB8485619Listed by: NEXTHOME SOUTH POINTE $499,000Active4 beds 3 baths1,673 sq. ft.
1450 Barry Street, CLEARWATER, FL 33756
MLS# TB8485783Listed by: PARADISE REALTY AND INVESTMENT $349,900Pending2 beds 2 baths1,194 sq. ft.
412 N Jefferson Avenue, CLEARWATER, FL 33755
MLS# TB8485781Listed by: RESULTS REAL ESTATE INC $180,000Active2 beds 2 baths1,185 sq. ft.
19029 Us Highway 19 N #1-22, CLEARWATER, FL 33764
MLS# TB8485697Listed by: ENRG GLOBAL REALTY, LLC $247,000Active2 beds 2 baths1,060 sq. ft.
500 N Osceola Avenue #510, CLEARWATER, FL 33755
MLS# TB8485609Listed by: BETTER CHOICE REAL ESTATE $575,500Active4 beds 2 baths2,092 sq. ft.
2058 Nursery Road, CLEARWATER, FL 33764
MLS# TB8484055Listed by: CHARLES RUTENBERG REALTY INC $499,900Active3 beds 2 baths2,426 sq. ft.
2027 Pinecrest Way, CLEARWATER, FL 33755
MLS# TB8485332Listed by: BHHS FLORIDA PROPERTIES GROUP $269,000Active2 beds 2 baths1,400 sq. ft.
2404 Florentine Way #20, CLEARWATER, FL 33763
MLS# TB8484398Listed by: COASTAL PROPERTIES GROUP INTERNATIONAL $94,900Active2 beds 1 baths920 sq. ft.
200 N Betty Lane #5F, CLEARWATER, FL 33755
MLS# TB8485439Listed by: HIGH POINT REALTY INC $629,000Active2 beds 2 baths1,026 sq. ft.
865 S Gulfview Boulevard #207, CLEARWATER BEACH, FL 33767
MLS# TB8485301Listed by: CENTURY 21 COAST TO COAST $165,000Active2 beds 1 baths616 sq. ft.
1160 Grove Street, CLEARWATER, FL 33755
MLS# TB8485137Listed by: GRYPHON ASSET ADVISORS, LLCADVISORS $889,000Pending5 beds 3 baths3,349 sq. ft.
1857 Castle Woods Drive, CLEARWATER, FL 33759
MLS# TB8482502Listed by: COASTAL PROPERTIES GROUP INTERNATIONAL $290,000Active3 beds 2 baths1,525 sq. ft.
701 S Madison Avenue #116, CLEARWATER, FL 33756
MLS# TB8483919Listed by: AVENUE HOMES LLC- Open Wed, 12 to 2pm
 $1,795,000Active3 beds 3 baths1,942 sq. ft.
1520 Gulf Boulevard #1602, CLEARWATER BEACH, FL 33767
MLS# TB8484419Listed by: COASTAL PROPERTIES GROUP INTERNATIONAL  $145,000Active2 beds 2 baths1,100 sq. ft.
2360 Irish Lane #62, CLEARWATER, FL 33763
MLS# TB8484706Listed by: AMOROSE & ASSOCIATES REALTY $112,990Active1 beds 1 baths825 sq. ft.
2043 Denmark Street #67, CLEARWATER, FL 33763
MLS# TB8484459Listed by: CHARLES RUTENBERG REALTY INC $239,000Active2 beds 2 baths1,030 sq. ft.
2009 Hammock Pine Boulevard #2009, CLEARWATER, FL 33761
MLS# TB8484773Listed by: CENTURY 21 COAST TO COAST $351,700Active4 beds 2 baths1,236 sq. ft.
1325 Mary L Road, CLEARWATER, FL 33755
MLS# TB8484794Listed by: PEOPLE'S CHOICE REALTY SVC LLC $108,500Active1 beds 1 baths571 sq. ft.
1799 N Highland Avenue #68, CLEARWATER, FL 33755
MLS# TB8485229Listed by: KELLER WILLIAMS REALTY PORTFOLIO COLLECTION $239,000Active3 beds 2 baths1,325 sq. ft.
2294 Belgian Lane #20, CLEARWATER, FL 33763
MLS# TB8478933Listed by: COLDWELL BANKER REALTY $325,000Pending2 beds 2 baths840 sq. ft.
1712 Carlisle Street, CLEARWATER, FL 33755
MLS# TB8482540Listed by: EXP REALTY $279,000Active2 beds 2 baths1,100 sq. ft.
19029 Us Highway 19 N #9-401, CLEARWATER, FL 33764
MLS# TB8485016Listed by: AGILE GROUP REALTY $48,000Active2 beds 1 baths597 sq. ft.
27466 Us Highway 19 N #3, CLEARWATER, FL 33761
MLS# TB8485143Listed by: CHARLES RUTENBERG REALTY INC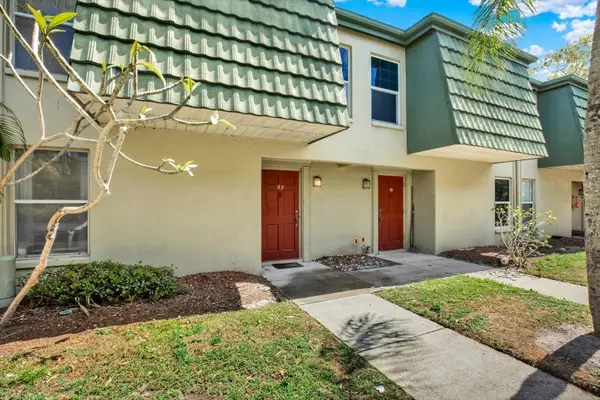 $185,000Active3 beds 3 baths1,179 sq. ft.
1799 N Highland Avenue #53, CLEARWATER, FL 33755
MLS# W7883714Listed by: RE/MAX CHAMPIONS $327,900Active2 beds 3 baths1,231 sq. ft.
830 Padua Lane, CLEARWATER, FL 33756
MLS# W7883710Listed by: KELLER WILLIAMS REALTY- PALM H $545,400Active3 beds 2 baths1,816 sq. ft.
1380 Williams Court, CLEARWATER, FL 33764
MLS# O6389387Listed by: BEYCOME OF FLORIDA LLC $1,279,000Active3 beds 3 baths2,998 sq. ft.
348 Larboard Way, CLEARWATER BEACH, FL 33767
MLS# TB8482031Listed by: COLDWELL BANKER REALTY $114,000Active2 beds 1 baths1,100 sq. ft.
2041 Australia Way W #49, CLEARWATER, FL 33763
MLS# TB8484870Listed by: ON TOP OF THE WORLD RE $519,000Active2 beds 2 baths1,530 sq. ft.
1651 Sand Key Estates Court #52, CLEARWATER, FL 33767
MLS# TB8483010Listed by: RE/MAX ACTION FIRST OF FLORIDA $585,000Active3 beds 2 baths2,218 sq. ft.
1001 Willowbranch Avenue, CLEARWATER, FL 33764
MLS# TB8483651Listed by: MAVREALTY $2,750,000Pending4 beds 6 baths4,524 sq. ft.
403 Jasmine Way, CLEARWATER, FL 33756
MLS# TB8484698Listed by: COMPASS FLORIDA LLC $262,000Active2 beds 2 baths1,370 sq. ft.
2260 Costa Rican Drive #6, CLEARWATER, FL 33763
MLS# TB8484175Listed by: COLDWELL BANKER REALTY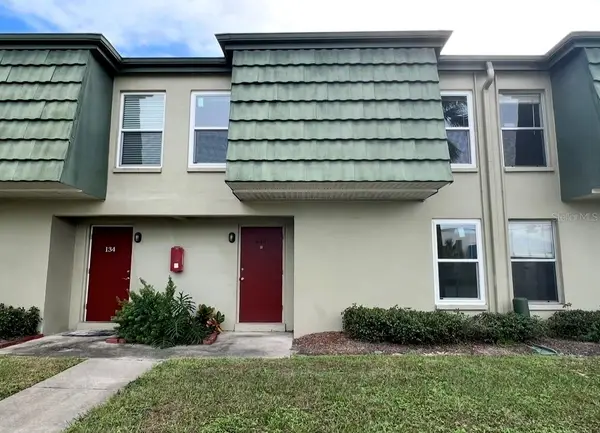 $199,900Pending3 beds 3 baths1,179 sq. ft.
1799 N Highland Avenue #133, CLEARWATER, FL 33755
MLS# TB8482089Listed by: REALTY ONE GROUP SUNSHINE $2,299,000Active3 beds 3 baths2,381 sq. ft.
1370 Gulf Boulevard #402, CLEARWATER, FL 33767
MLS# TB8484078Listed by: COASTAL PROPERTIES GROUP INTERNATIONAL $85,000Pending2 beds 1 baths900 sq. ft.
2625 State Road 590 #1211, CLEARWATER, FL 33759
MLS# TB8484673Listed by: COLDWELL BANKER REALTY $875,000Active2 beds 2 baths2,003 sq. ft.
920 N Osceola Avenue #604, CLEARWATER, FL 33755
MLS# TB8483894Listed by: FUTURE HOME REALTY INC $1,225,000Active3 beds 3 baths2,017 sq. ft.
205 Brightwater Drive #202, CLEARWATER BEACH, FL 33767
MLS# TB8472266Listed by: COLDWELL BANKER REALTY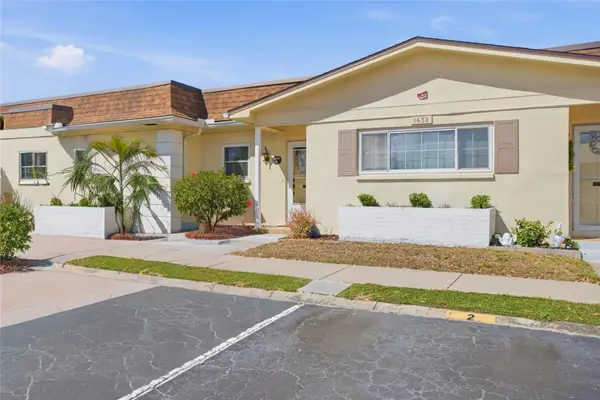 $149,900Active1 beds 1 baths974 sq. ft.
1632 S Lake Avenue #3, CLEARWATER, FL 33756
MLS# TB8484417Listed by: COLDWELL BANKER REALTY $490,000Pending2 beds 2 baths1,202 sq. ft.
1613 Elizabeth Lane, CLEARWATER, FL 33755
MLS# TB8484583Listed by: CHARLES RUTENBERG REALTY INC $500,000Active2 beds 2 baths1,118 sq. ft.
1401 Gulf Boulevard #117, CLEARWATER BEACH, FL 33767
MLS# TB8484094Listed by: COASTAL PROPERTIES GROUP INTERNATIONAL $425,000Pending3 beds 2 baths1,516 sq. ft.
2637 Cypress Bend Drive, CLEARWATER, FL 33761
MLS# TB8484147Listed by: BAIRD REALTY GROUP $425,000Active2 beds 2 baths1,350 sq. ft.
660 Island Way #902, CLEARWATER, FL 33767
MLS# TB8465845Listed by: FUTURE HOME REALTY INC $610,000Pending3 beds 2 baths1,830 sq. ft.
308 N Missouri Avenue, CLEARWATER, FL 33755
MLS# TB8484237Listed by: STONEBRIDGE REAL ESTATE CO $315,000Active2 beds 2 baths1,309 sq. ft.
2773 Via Cipriani #1321B, CLEARWATER, FL 33764
MLS# TB8484012Listed by: A-TEAM HOME SALES & RENTALS $989,000Active3 beds 4 baths2,125 sq. ft.
944 Bruce Avenue, CLEARWATER BEACH, FL 33767
MLS# TB8465912Listed by: HIGH POINT REALTY INC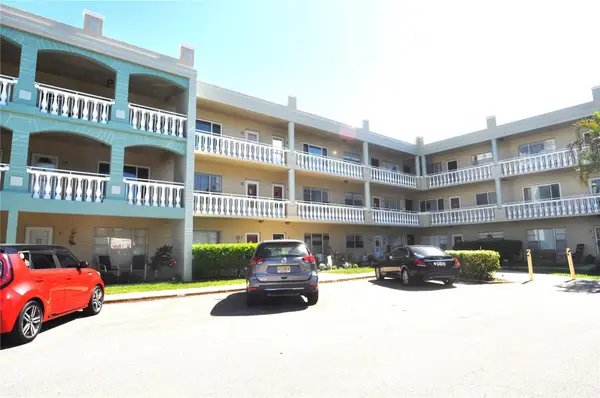 $120,000Pending2 beds 2 baths1,100 sq. ft.
2331 Finlandia Lane #43, CLEARWATER, FL 33763
MLS# TB8483913Listed by: RE/MAX REALTEC GROUP INC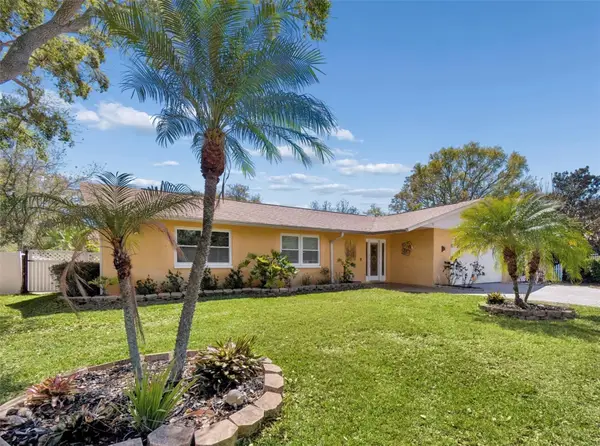 $583,200Active3 beds 3 baths2,156 sq. ft.
1807 Oak Forest Drive S, CLEARWATER, FL 33759
MLS# TB8483930Listed by: CHARLES RUTENBERG REALTY INC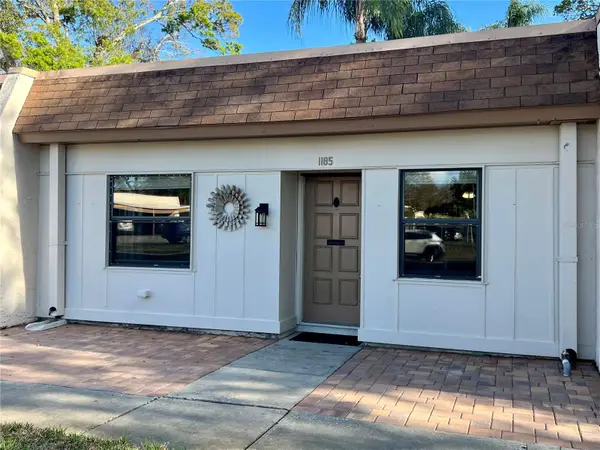 $154,900Active2 beds 1 baths812 sq. ft.
1185 Mission Circle, CLEARWATER, FL 33759
MLS# TB8479642Listed by: REALTY ONE GROUP SUNSHINE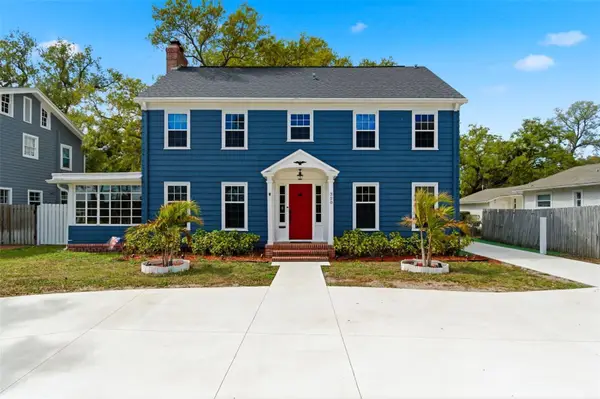 $849,900Active5 beds 4 baths3,224 sq. ft.
320 N Betty Lane, CLEARWATER, FL 33755
MLS# TB8482837Listed by: REALTY EXPERTS $325,000Active2 beds 3 baths1,274 sq. ft.
2016 Sunset Meadow Drive, CLEARWATER, FL 33763
MLS# TB8483594Listed by: LLOYD REALTY $147,000Active1 beds 1 baths570 sq. ft.
701 S Madison Avenue #109, CLEARWATER, FL 33756
MLS# TB8483601Listed by: GALLERY PROPERTIES INTERNATIONAL $239,900Active2 beds 2 baths1,270 sq. ft.
3443 Baronne Court, CLEARWATER, FL 33761
MLS# TB8483971Listed by: COLDWELL BANKER REALTY $170,000Active2 beds 2 baths943 sq. ft.
1960 Union Street #22, CLEARWATER, FL 33763
MLS# TB8484026Listed by: ENRG GLOBAL REALTY, LLC $99,900Active2 beds 1 baths1,100 sq. ft.
2462 Brazilia Drive #16, CLEARWATER, FL 33763
MLS# TB8483944Listed by: BONOMO REALTY LLC $119,000Active1 beds 1 baths685 sq. ft.
1001 Pearce Drive #205, CLEARWATER, FL 33764
MLS# TB8482362Listed by: SELECT PROPERTIES INC $124,900Active2 beds 1 baths1,100 sq. ft.
2404 Florentine Way #52, CLEARWATER, FL 33763
MLS# TB8483485Listed by: BONOMO REALTY LLC $479,990Active3 beds 2 baths1,444 sq. ft.
1806 Beverly Circle N, CLEARWATER, FL 33764
MLS# TB8470082Listed by: EXP REALTY LLC $165,000Active2 beds 2 baths886 sq. ft.
1165 Mission Circle #53F, CLEARWATER, FL 33759
MLS# TB8481783Listed by: 54 REALTY LLC $729,000Active2 beds 2 baths1,462 sq. ft.
1390 Gulf Boulevard #102, CLEARWATER, FL 33767
MLS# TB8482924Listed by: BEACH TO BAY BROKERS LLC $549,000Pending2 beds 2 baths1,260 sq. ft.
800 S Gulfview Boulevard #907, CLEARWATER BEACH, FL 33767
MLS# TB8483744Listed by: CHARLES RUTENBERG REALTY INC $139,900Pending2 beds 1 baths865 sq. ft.
1243 S Martin Luther King Jr Avenue #B501, CLEARWATER, FL 33756
MLS# TB8483835Listed by: COMPASS FLORIDA, LLC $180,000Active2 beds 2 baths900 sq. ft.
2250 Druid Road E #905, CLEARWATER, FL 33764
MLS# TB8483501Listed by: ASCEND REALTY $535,000Pending3 beds 3 baths1,700 sq. ft.
320 Island Way #103, CLEARWATER, FL 33767
MLS# TB8482166Listed by: LPT REALTY, LLC $789,000Active2 beds 2 baths1,643 sq. ft.
210 Dolphin Point #B, CLEARWATER BEACH, FL 33767
MLS# TB8482429Listed by: COASTAL PROPERTIES GROUP INTERNATIONAL $499,990Pending3 beds 3 baths2,132 sq. ft.
327 N Duncan Avenue, CLEARWATER, FL 33755
MLS# TB8482611Listed by: OUT FAST REALTY & INVESTMENTS $172,000Active2 beds 1 baths817 sq. ft.
2452 Enterprise Road #15, CLEARWATER, FL 33763
MLS# TB8483107Listed by: CENTURY 21 COASTAL ALLIANCE $255,000Active2 beds 2 baths1,400 sq. ft.
2073 Denmark Street #5, CLEARWATER, FL 33763
MLS# TB8483721Listed by: ON TOP OF THE WORLD RE $469,900Pending3 beds 2 baths1,607 sq. ft.
1889 Stancel Drive, CLEARWATER, FL 33764
MLS# TB8483602Listed by: BANYAN RESIDENTIAL GROUP, LLC $150,000Pending2 beds 2 baths1,117 sq. ft.
3034 Eastland Boulevard #D210, CLEARWATER, FL 33761
MLS# TB8481413Listed by: DALTON WADE INC $695,500Active2 beds 2 baths1,363 sq. ft.
1591 Gulf Boulevard #203S, CLEARWATER BEACH, FL 33767
MLS# TB8481486Listed by: FLORIDA LUXURY GROUP $219,000Active1 beds 1 baths701 sq. ft.
1234 S Missouri Avenue #320, CLEARWATER, FL 33756
MLS# TB8479170Listed by: RE/MAX ACTION FIRST OF FLORIDA $170,000Active2 beds 2 baths1,270 sq. ft.
1655 S Highland Avenue #C155, CLEARWATER, FL 33756
MLS# TB8479802Listed by: RE/MAX ACTION FIRST OF FLORIDA $119,000Active1 beds 1 baths580 sq. ft.
2420 Winding Creek Boulevard #105, CLEARWATER, FL 33761
MLS# TB8481233Listed by: COMPASS FLORIDA LLC $159,500Active2 beds 2 baths1,100 sq. ft.
2360 Irish Lane #16, CLEARWATER, FL 33763
MLS# TB8483337Listed by: DALTON WADE INC $189,900Active1 beds 1 baths750 sq. ft.
3034 Eastland Boulevard #D104, CLEARWATER, FL 33761
MLS# TB8482206Listed by: KELLER WILLIAMS REALTY- PALM H $293,900Active2 beds 2 baths1,527 sq. ft.
1636 S Lake Avenue #1, CLEARWATER, FL 33756
MLS# TB8483249Listed by: COLDWELL BANKER REALTY $395,000Pending2 beds 2 baths1,035 sq. ft.
661 Poinsettia Avenue #109, CLEARWATER BEACH, FL 33767
MLS# TB8480593Listed by: SUNSTAR REAL ESTATE LLC $214,900Active2 beds 2 baths1,400 sq. ft.
2400 Columbia Drive #18, CLEARWATER, FL 33763
MLS# TB8483456Listed by: ON TOP OF THE WORLD RE $150,000Pending2 beds 2 baths1,400 sq. ft.
2020 World Parkway Boulevard #54, CLEARWATER, FL 33763
MLS# TB8482331Listed by: EXP REALTY LLC $1,149,900Active3 beds 3 baths1,869 sq. ft.
759 Lantana Avenue, CLEARWATER, FL 33767
MLS# TB8483028Listed by: RE/MAX REALTEC GROUP INC $94,999Active1 beds 1 baths682 sq. ft.
2207 Belleair Road #B11, CLEARWATER, FL 33764
MLS# TB8479774Listed by: LIPPLY REAL ESTATE $839,900Pending4 beds 3 baths2,687 sq. ft.
2822 Gloria Court, CLEARWATER, FL 33761
MLS# TB8481266Listed by: DUNEDIN REALTY LLC $1,595,000Active2 beds 2 baths1,000 sq. ft.
2634 South Drive, CLEARWATER, FL 33759
MLS# W7883268Listed by: DALTON WADE INC $430,000Active2 beds 2 baths1,595 sq. ft.
3107 Oyster Bayou Way, CLEARWATER, FL 33759
MLS# TB8482751Listed by: ENGEL & VOLKERS TAMPA DOWNTOWN $390,000Active2 beds 3 baths1,571 sq. ft.
2442 Foggy Creek Circle, CLEARWATER, FL 33764
MLS# TB8483015Listed by: ASCEND REALTY $425,000Active3 beds 2 baths1,380 sq. ft.
1623 S Prescott Avenue, CLEARWATER, FL 33756
MLS# TB8482982Listed by: KELLER WILLIAMS ST PETE REALTY $545,500Active3 beds 3 baths1,890 sq. ft.
1014 Ewing Place, CLEARWATER, FL 33756
MLS# TB8481852Listed by: NATIVE PROPERTIES INC $199,990Active2 beds 2 baths1,400 sq. ft.
2285 Israeli Drive #57, CLEARWATER, FL 33763
MLS# TB8482210Listed by: LPT REALTY, LLC $348,000Active2 beds 2 baths1,588 sq. ft.
642 Wells Court #402, CLEARWATER, FL 33756
MLS# TB8482877Listed by: MAVREALTY $995,000Active2 beds 2 baths1,670 sq. ft.
1660 Gulf Boulevard #PH5, CLEARWATER BEACH, FL 33767
MLS# TB8483029Listed by: COASTAL PROPERTIES GROUP INTERNATIONAL $286,000Active2 beds 2 baths1,400 sq. ft.
2073 Denmark Street #37, CLEARWATER, FL 33763
MLS# TB8482670Listed by: REALTY ONE GROUP SUNSHINE $120,000Active1 beds 1 baths747 sq. ft.
215 S Mcmullen Booth Road #182, CLEARWATER, FL 33759
MLS# TB8483072Listed by: PEOPLE'S TRUST REALTY $470,000Active2 beds 2 baths1,451 sq. ft.
1324 Summerlin Drive, CLEARWATER, FL 33764
MLS# TB8482712Listed by: CENTURY 21 INTEGRA $120,000Active2 beds 2 baths1,100 sq. ft.
2430 Brazilia Drive #44, CLEARWATER, FL 33763
MLS# TB8482847Listed by: ON TOP OF THE WORLD RE $220,000Active2 beds 2 baths1,155 sq. ft.
2020 Lakeview Drive #105, CLEARWATER, FL 33763
MLS# TB8467037Listed by: BILTMORE GROUP INC $935,000Active2 beds 2 baths1,464 sq. ft.
1290 Gulf Boulevard #1002, CLEARWATER, FL 33767
MLS# TB8481810Listed by: BEACHWISE REAL ESTATE $133,900Active2 beds 2 baths813 sq. ft.
1799 N Highland Avenue #106, CLEARWATER, FL 33755
MLS# TB8482179Listed by: HOMEFRONT REALTY $419,000Pending2 beds 2 baths1,349 sq. ft.
1841 Magnolia Drive, CLEARWATER, FL 33764
MLS# TB8481908Listed by: LPT REALTY, LLC $318,000Active2 beds 2 baths793 sq. ft.
231 Skiff Point #7, CLEARWATER BEACH, FL 33767
MLS# TB8482103Listed by: EMPIRE REALTY OF PINELLAS $899,999Active2 beds 2 baths1,953 sq. ft.
920 N Osceola Avenue #702, CLEARWATER, FL 33755
MLS# TB8477696Listed by: COASTAL PROPERTIES GROUP $550,000Active3 beds 3 baths1,847 sq. ft.
601 N Osceola Avenue, CLEARWATER, FL 33755
MLS# TB8482577Listed by: DHM REAL ESTATE GROUP LLC $155,000Pending1 beds 1 baths660 sq. ft.
1216 S Missouri Avenue #408, CLEARWATER, FL 33756
MLS# O6387362Listed by: OLYMPUS EXECUTIVE REALTY INC
Local realty services provided by:CENTURY 21 Alliance Realty Group, CENTURY 21 Hansen Realty
The information being provided by Stellar Mls is for the consumer's personal, non-commercial use and may not be used for any purpose other than to identify prospective properties consumer may be interested in purchasing. Any information relating to real estate for sale referenced on this web site comes from the Internet Data Exchange (IDX) program of the Stellar Mls. CENTURY 21 Alliance Realty Group is not a Multiple Listing Service (MLS), nor does it offer MLS access. This website is a service of CENTURY 21 Alliance Realty Group, a broker participant of Stellar Mls. This web site may reference real estate listing(s) held by a brokerage firm other than the broker and/or agent who owns this web site.
The accuracy of all information, regardless of source, including but not limited to open house information, square footages and lot sizes, is deemed reliable but not guaranteed and should be personally verified through personal inspection by and/or with the appropriate professionals. The data contained herein is copyrighted by Stellar Mls and is protected by all applicable copyright laws. Any unauthorized dissemination of this information is in violation of copyright laws and is strictly prohibited.
Properties in listings may have been sold or may no longer be available.
Copyright 2026 Stellar Mls. All rights reserved.
Information deemed reliable but not guaranteed. Information is provided, in part, by Greater Miami MLS. This information being provided is for consumer's personal, non-commercial use and may not be used for any other purpose other than to identify prospective properties consumers may be interested in purchasing.
Neighborhoods near Clearwater, FL
Zip codes near Clearwater, FL
- 33755 homes for sale
- 33756 homes for sale
- 33759 homes for sale
- 33760 homes for sale
- 33761 homes for sale
- 33763 homes for sale
- 33764 homes for sale
- 33765 homes for sale
- 33767 homes for sale
- 33770 homes for sale
- 33771 homes for sale
- 33774 homes for sale
- 33778 homes for sale
- 33785 homes for sale
- 33786 homes for sale
- 34681 homes for sale
- 34683 homes for sale
- 34684 homes for sale
- 34695 homes for sale
- 34698 homes for sale
Popular searches near Clearwater, FL
- Bardmoor homes for sale
- Belleair homes for sale
- Belleair Beach homes for sale
- Belleair Bluffs homes for sale
- Belleair Shore homes for sale
- Clearwater Beach homes for sale
- Crystal Beach homes for sale
- Dunedin homes for sale
- Feather Sound homes for sale
- Greenbriar homes for sale
- Harbor Bluffs homes for sale
- Indian Rocks Beach homes for sale
- Indian Shores homes for sale
- Largo homes for sale
- Oldsmar homes for sale
- Palm Harbor homes for sale
- Ridgecrest homes for sale
- Safety Harbor homes for sale
- Seminole homes for sale
- South Highpoint homes for sale
Protect your home and budget from life's surprises with an Assurant Home Warranty, backed by a partner that supports you through every step of homeownership. Explore Plans.
©2026 Century 21 Real Estate LLC. All rights reserved. CENTURY 21®, the CENTURY 21 Logo and C21® are service marks owned by Century 21 Real Estate LLC. Century 21 Real Estate LLC fully supports the principles of the Fair Housing Act and the Equal Opportunity Act. Each office is independently owned and operated. Listing information is deemed reliable but not guaranteed accurate.