- Battlefield homes for sale
- Battlefield A homes for sale
- Battlefield B homes for sale
- Billings homes for sale
- Cass homes for sale
- Clever homes for sale
- East Polk homes for sale
- East Republic homes for sale
- Garden Grove homes for sale
- Grant homes for sale
- Hurley Township homes for sale
- Lincoln homes for sale
- Nixa homes for sale
- North Galloway homes for sale
- Northview homes for sale
- Ponce De Leon homes for sale
- Republic homes for sale
- Rosedale homes for sale
- Union Chapel homes for sale
- Wilson CW homes for sale
65631, MO - homes for sale
57 of 57 results displayed
- New
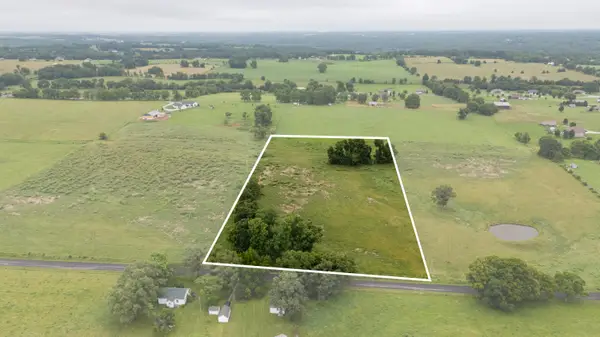 $179,900Active7.82 Acres
Tract 2 Fraizer Road, Clever, MO 65631
MLS# 60327302Listed by: MURNEY ASSOCIATES - PRIMROSE - New
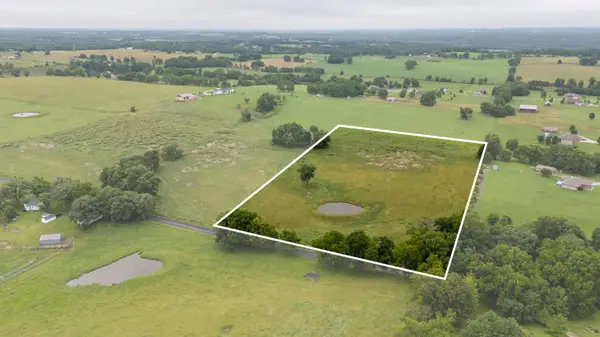 $179,900Active7.82 Acres
Tract 3 Fraizer Road, Clever, MO 65631
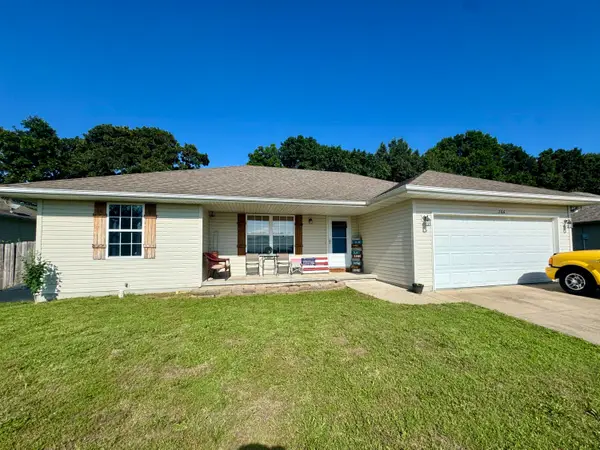
MLS# 60327304Listed by: MURNEY ASSOCIATES - PRIMROSE  $225,000Pending3 beds 2 baths1,551 sq. ft.
319 W Shawnee Court, Clever, MO 65631
MLS# 60326803Listed by: KELLER WILLIAMS- New
 $1,799,900Active6 beds 4 baths3,791 sq. ft.
411/425 Lake Branch Road, Clever, MO 65631
MLS# 60326673Listed by: ALPHA REALTY MO, LLC - New
 $525,000Active3 beds 2 baths1,920 sq. ft.
425 Lake Branch Road, Clever, MO 65631
MLS# 60326675Listed by: ALPHA REALTY MO, LLC - New
 $229,900Active3 beds 2 baths1,321 sq. ft.
206 Spruce Avenue, Clever, MO 65631
MLS# 60326631Listed by: A R WILSON, REALTORS - New
 $390,000Active3 beds 2 baths2,312 sq. ft.
533 Ghan Road, Clever, MO 65631
MLS# 60326589Listed by: MURNEY ASSOCIATES - NIXA - New
 $2,650,000Active6 beds 6 baths6,900 sq. ft.
740 Russel Ridge Road, Nixa, MO 65714
MLS# 60326561Listed by: MURNEY ASSOCIATES - PRIMROSE - New
 $232,900Active3 beds 2 baths1,175 sq. ft.
414 N Cherokee Trail, Clever, MO 65631
MLS# 60326545Listed by: RE/MAX HOUSE OF BROKERS  $459,900Pending4 beds 2 baths2,240 sq. ft.
150 Southern Fields Circle, Clever, MO 65631
MLS# 60326523Listed by: AMAX REAL ESTATE $169,900Pending3 beds 1 baths1,032 sq. ft.
104 Maple Street, Clever, MO 65631
MLS# 60326457Listed by: STURDY REAL ESTATE $525,000Active3 beds 2 baths1,885 sq. ft.
118 Country Corner Drive Street, Clever, MO 65631
MLS# 60326293Listed by: KELLER WILLIAMS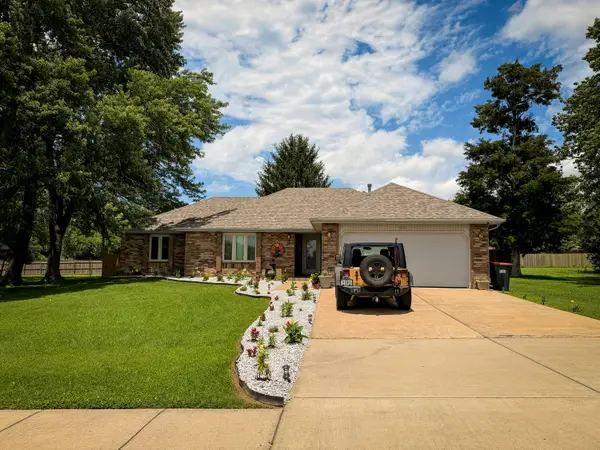 $339,900Active3 beds 2 baths1,959 sq. ft.
310 E Grant Street, Clever, MO 65631
MLS# 60325931Listed by: LANE BRANCH REALTY $610,000Active5 beds 3 baths3,578 sq. ft.
205 Nice Place Road, Clever, MO 65631
MLS# 60325677Listed by: GATEWAY REAL ESTATE TEAM LLC $309,900Active3 beds 2 baths1,346 sq. ft.
710 W Lexington Circle, Clever, MO 65631
MLS# 60325616Listed by: KELLER WILLIAMS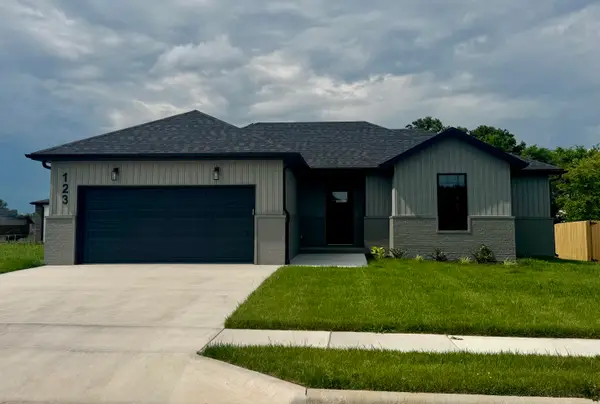 $274,900Active3 beds 2 baths1,378 sq. ft.
123 E Teakwood Avenue, Clever, MO 65631
MLS# 60325510Listed by: CRUTCHER REAL ESTATE GROUP LLC- Open Sun, 1 to 3pm
 $339,900Active4 beds 2 baths2,907 sq. ft.
322 E Drive Street, Clever, MO 65631
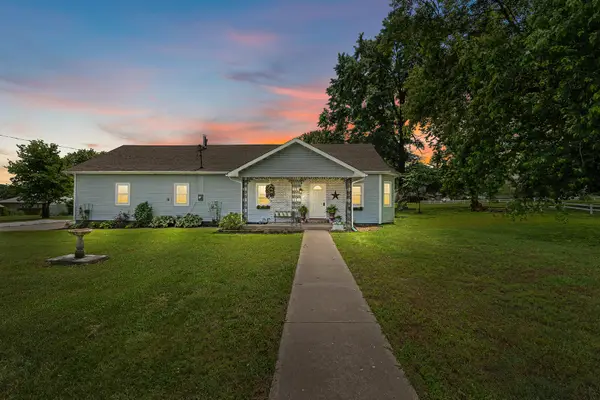
MLS# 60325306Listed by: MURNEY ASSOCIATES - PRIMROSE  $239,900Active4 beds 3 baths1,776 sq. ft.
125 E Chrysler Avenue, Clever, MO 65631
MLS# 60325070Listed by: MURNEY ASSOCIATES - PRIMROSE $225,000Pending3 beds 2 baths1,352 sq. ft.
127 N Carter Court, Clever, MO 65631
MLS# 60324867Listed by: KELLER WILLIAMS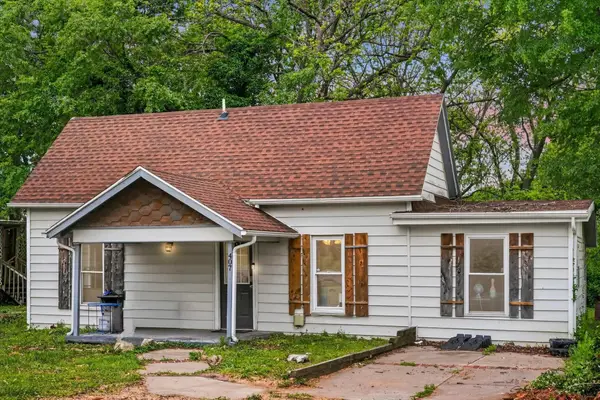 $153,000Active3 beds 1 baths979 sq. ft.
407 S Clarke Avenue, Clever, MO 65631
MLS# 60324406Listed by: KELLER WILLIAMS $430,000Active3 beds 2 baths1,805 sq. ft.
643 State Highway P, Clever, MO 65631
MLS# 60324313Listed by: MURNEY ASSOCIATES - PRIMROSE $229,000Pending3 beds 2 baths1,175 sq. ft.
412 N Cherokee Trail, Clever, MO 65631
MLS# 60324136Listed by: RE/MAX HOUSE OF BROKERS $424,900Pending3 beds 2 baths1,672 sq. ft.
359 Cranbrook Lane, Billings, MO 65610
MLS# 60323927Listed by: EXP REALTY LLC $319,000Active1 beds 2 baths2,000 sq. ft.
8294 W Veterans Boulevard, Clever, MO 65631
MLS# 60322574Listed by: SOCIETY REAL ESTATE LLC $469,900Active3 beds 3 baths2,367 sq. ft.
150 Shelbrae Lane, Clever, MO 65631
MLS# 60322444Listed by: THE REALTY.GROUP, LLC $169,000Active1.03 Acres
000 Highway 14, Clever, MO 65631
MLS# 60322476Listed by: CANTRELL REAL ESTATE $375,000Active39.9 Acres
000 Richwood School House Road, Clever, MO 65631
MLS# 60322432Listed by: ASSIST 2 SELL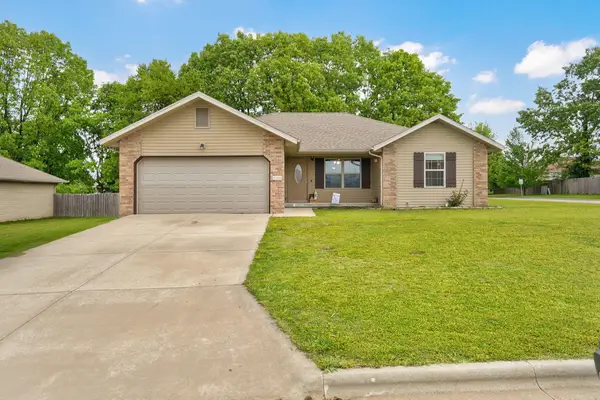 $249,900Pending4 beds 2 baths1,407 sq. ft.
501 Bradford Pear, Clever, MO 65631
MLS# 60322178Listed by: MURNEY ASSOCIATES - NIXA $299,900Pending3 beds 2 baths1,587 sq. ft.
1247 State Highway N, Clever, MO 65631
MLS# 60321892Listed by: SILLIMAN REALTY & ASSOCIATES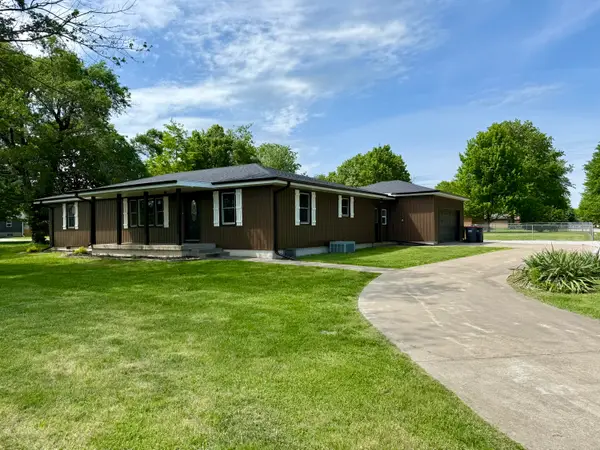 $305,000Pending3 beds 2 baths1,620 sq. ft.
313 E Grant Street, Clever, MO 65631
MLS# 60321860Listed by: BETTER HOMES & GARDENS SW GRP $329,900Active3 beds 2 baths1,647 sq. ft.
607 N Acacia Avenue, Clever, MO 65631
MLS# 60321145Listed by: CRUTCHER REAL ESTATE GROUP LLC $1,049,000Active5 beds 4 baths4,228 sq. ft.
493 Spring Creek Road, Clever, MO 65631
MLS# 60320256Listed by: KELLER WILLIAMS $1,385,000Active5 beds 4 baths4,228 sq. ft.
493 Spring Creek Road, Clever, MO 65631
MLS# 60320163Listed by: KELLER WILLIAMS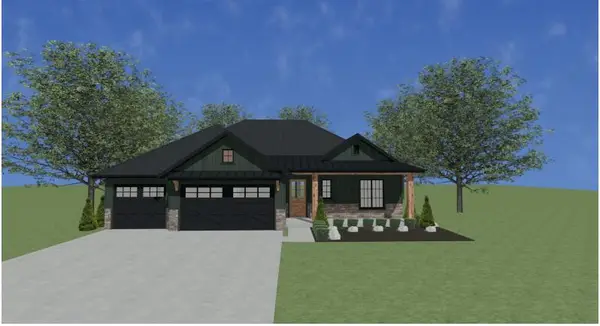 $799,999Pending4 beds 3 baths3,230 sq. ft.
1690 State Highway Zz, Clever, MO 65631
MLS# 60319060Listed by: KELLER WILLIAMS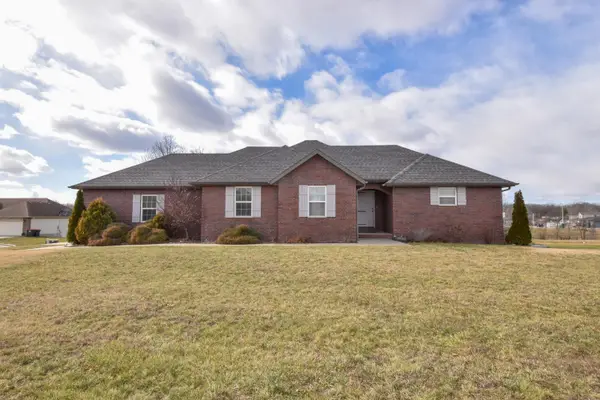 $429,000Active4 beds 3 baths2,884 sq. ft.
519 N Elm Avenue, Clever, MO 65631
MLS# 60319047Listed by: MURNEY ASSOCIATES - PRIMROSE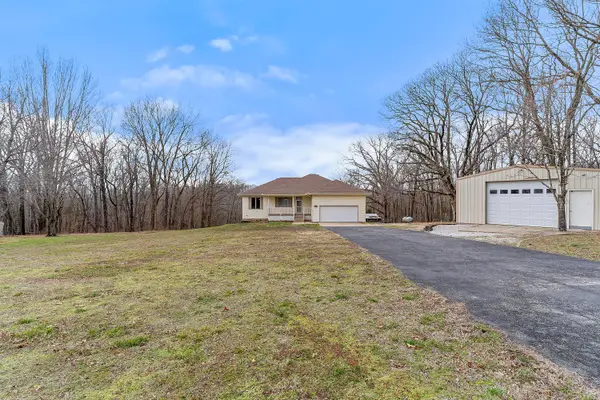 $455,000Active4 beds 3 baths3,433 sq. ft.
117 Chelsea Lane, Clever, MO 65631
MLS# 60317165Listed by: REECENICHOLS - SPRINGFIELD $329,900Pending3 beds 2 baths1,647 sq. ft.
603 N Acacia Avenue, Clever, MO 65631
MLS# 60316108Listed by: CRUTCHER REAL ESTATE GROUP LLC $309,900Pending4 beds 2 baths1,586 sq. ft.
605 N Acacia Avenue, Clever, MO 65631
MLS# 60316104Listed by: CRUTCHER REAL ESTATE GROUP LLC $398,000Active4 beds 2 baths1,650 sq. ft.
422 Spring Creek Road, Clever, MO 65631
MLS# 60312621Listed by: KELLER WILLIAMS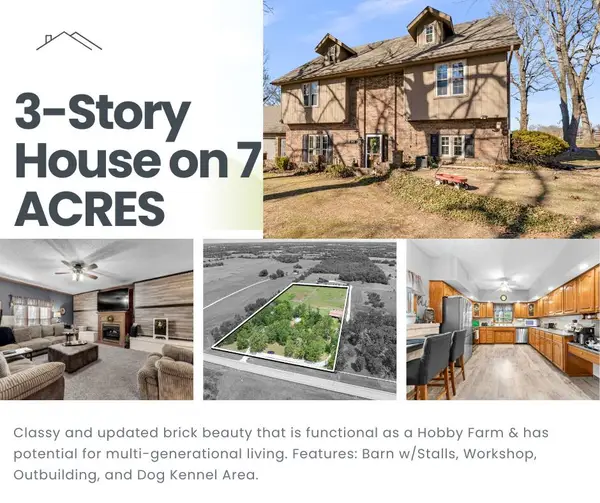 $515,000Pending5 beds 3 baths3,316 sq. ft.
8433 W Veterans Boulevard, Clever, MO 65631
MLS# 60315967Listed by: STERLING REAL ESTATE GROUP LLC $349,900Active4 beds 3 baths1,784 sq. ft.
118 E Acacia Circle, Clever, MO 65631
MLS# 60315875Listed by: CRUTCHER REAL ESTATE GROUP LLC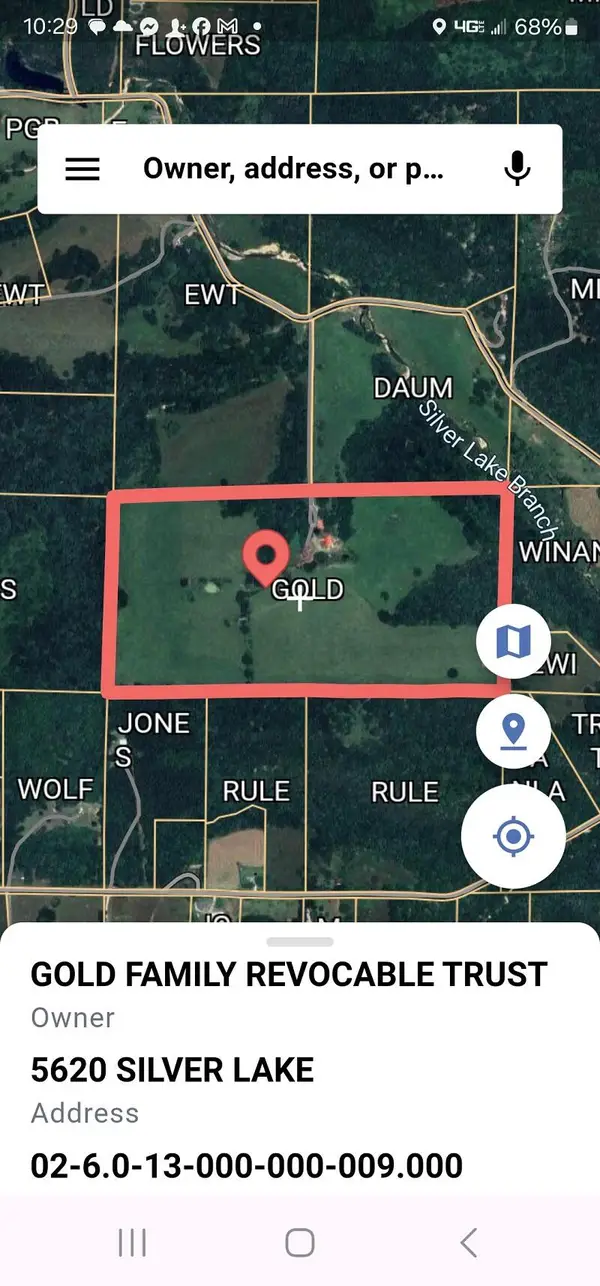 $320,000Active32 Acres
5620 Silver Lake Rd Road, Clever, MO 65631
MLS# 60315002Listed by: BATTLECREEK PROPERTIES, INC $400,000Active2 beds 1 baths942 sq. ft.
5620 Silver Lake Road, Clever, MO 65631
MLS# 60315003Listed by: BATTLECREEK PROPERTIES, INC $75,000Active0.82 Acres
203 W Brown Street, Clever, MO 65631
MLS# 60314241Listed by: MELTON AUCTION AND REALTY, LLC $50,000Active0.65 Acres
000 Dollar Street #Lot 2, Clever, MO 65631
MLS# 60314184Listed by: MASSENGALE GROUP - KELLER WILLIAMS - NIXA $50,000Active0.88 Acres
000 Dollar Street #Lot 1, 2, Clever, MO 65631
MLS# 60314185Listed by: MASSENGALE GROUP - KELLER WILLIAMS - NIXA $1,060,060Active5 beds 3 baths3,580 sq. ft.
296 316 State Highway, Clever, MO 65631
MLS# 60311982Listed by: BLUECAMO PROPERTIES $179,900Active3 beds 1 baths1,114 sq. ft.
407 W Brown Street, Clever, MO 65631
MLS# 60310420Listed by: STERLING REAL ESTATE GROUP LLC $270,000Active20 Acres
000 State Hwy M, Clever, MO 65631
MLS# 60309528Listed by: MURNEY ASSOCIATES - NIXA $299,000Active5.25 Acres
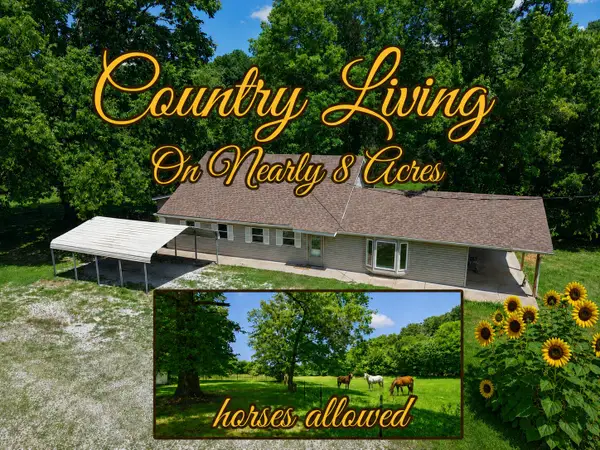
7830 Snow Drop Avenue, Clever, MO 65631
MLS# 60305760Listed by: MURNEY ASSOCIATES - PRIMROSE $699,000Active5 beds 3 baths3,324 sq. ft.
303 Crystal Valley Rd, Clever, MO 65631
MLS# 60304878Listed by: KELLER WILLIAMS $349,900Pending4 beds 3 baths1,784 sq. ft.
116 E Acacia Circle, Clever, MO 65631
MLS# 60302953Listed by: CRUTCHER REAL ESTATE GROUP LLC $800,000Active2 beds 1 baths942 sq. ft.
5620 Silver Lake Road, Clever, MO 65631
MLS# 60288787Listed by: BATTLECREEK PROPERTIES, INC $525,000Active5 beds 3 baths3,280 sq. ft.
747 Amanda Drive, Clever, MO 65631
MLS# 60318095Listed by: MURNEY ASSOCIATES - PRIMROSE $590,000Active20.22 Acres
858 Kimberlin Mill Road, Clever, MO 65631
MLS# 60272183Listed by: MURNEY ASSOCIATES - PRIMROSE $295,000Active11.38 Acres
858 Kimberlin Mill Road, Clever, MO 65631
MLS# 60272165Listed by: MURNEY ASSOCIATES - PRIMROSE $235,000Pending3 beds 2 baths1,432 sq. ft.
513 W Osage, Clever, MO 65631
MLS# 60255566Listed by: EXP REALTY LLC
Local realty services provided by:CENTURY 21 Combs & Associates Real Estate
Copyright 2026 Southern Missouri MLS. All rights reserved. Listings courtesy of Southern Missouri MLS as distributed by MLS GRID <Last Updated November 16, 2023. Southern Missouri MLS provides content displayed here (“provided content”) on an “as is” basis and makes no representations or warranties regarding the provided content, including, but not limited to those of non-infringement, timeliness, accuracy, or completeness. Individuals and companies using information presented are responsible for verification and validation of information they utilize and present to their customers and clients. Southern Missouri MLS will not be liable for any damage or loss resulting from use of the provided content or the products available through Portals, IDX, VOW, and/or Syndication. Recipients of this information shall not resell, redistribute, reproduce, modify, or otherwise copy any portion thereof without the expressed written consent of Southern Missouri MLS
Popular searches near 65631
Popular neighborhoods near 65631
- Bradford Park, Springfield homes for sale
- Brentwood, Springfield homes for sale
- Delaware, Springfield homes for sale
- Fassnight, Springfield homes for sale
- Kickapoo, Springfield homes for sale
- Lake Springfield, Springfield homes for sale
- Mark Twain, Springfield homes for sale
- Meador Park, Springfield homes for sale
- Millwood, East Clay A homes for sale
- Parkcrest, Springfield homes for sale
- Phelps, Springfield homes for sale
- Primrose, Springfield homes for sale
- Seminole, Springfield homes for sale
- Sequiota, Springfield homes for sale
- Southside, Springfield homes for sale
- Study, Springfield homes for sale
- University Heights, Springfield homes for sale
- Westport, Springfield homes for sale
- Westside, Springfield homes for sale
- Young Lilly, Springfield homes for sale
Counties near Clever, 65631
- Barry County homes for sale
- Barton County homes for sale
- Boone County homes for sale
- Carroll County homes for sale
- Cedar County homes for sale
- Christian County homes for sale
- Dade County homes for sale
- Dallas County homes for sale
- Douglas County homes for sale
- Greene County homes for sale
- Jasper County homes for sale
- Lawrence County homes for sale
- McDonald County homes for sale
- Newton County homes for sale
- Ozark County homes for sale
- Polk County homes for sale
- Stone County homes for sale
- Taney County homes for sale
- Webster County homes for sale
- Wright County homes for sale
Protect your home and budget from life's surprises with an Assurant Home Warranty, backed by a partner that supports you through every step of homeownership. Explore Plans.
©2026 Century 21 Real Estate LLC. All rights reserved. CENTURY 21®, the CENTURY 21 Logo and C21® are service marks owned by Century 21 Real Estate LLC. Century 21 Real Estate LLC fully supports the principles of the Fair Housing Act and the Equal Opportunity Act. Each office is independently owned and operated. Listing information is deemed reliable but not guaranteed accurate.