- Accent, Des Moines properties for sale
- Brook Run VIllage, Des Moines properties for sale
- Capitol East, Des Moines properties for sale
- Carman Estates, Des Moines properties for sale
- Copper Creek, Pleasant Hill properties for sale
- Easter Lake Area, Des Moines properties for sale
- Fairground, Des Moines properties for sale
- Fort Des Moines, Des Moines properties for sale
- Grays Lake, Des Moines properties for sale
- Gray's Woods, Des Moines properties for sale
- Indianola Hills, Des Moines properties for sale
- Magnolia Park, Des Moines properties for sale
- McKinley School, Des Moines properties for sale
- Pioneer Park, Des Moines properties for sale
- River Woods, Des Moines properties for sale
- Sheridan Gardens, Des Moines properties for sale
- South Park, Des Moines properties for sale
- Valley High Manor, Des Moines properties for sale
- Watrous Heights, Des Moines properties for sale
- Watrous South, Des Moines properties for sale
50057, IA - homes for sale
2 of 2 results displayed
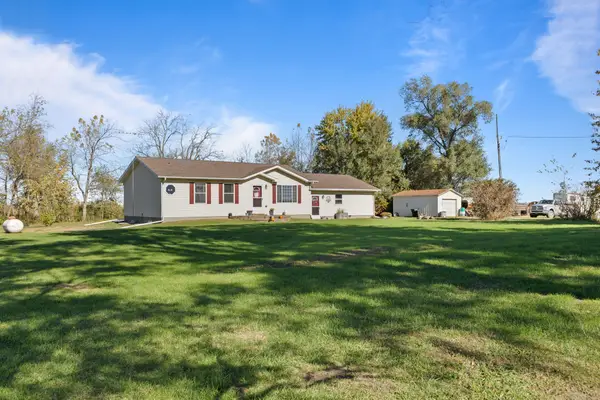 $355,000Active4 beds 3 baths1,134 sq. ft.
1175 Upton Street, Columbia, IA 50057
MLS# 729718Listed by: KELLER WILLIAMS REALTY GDM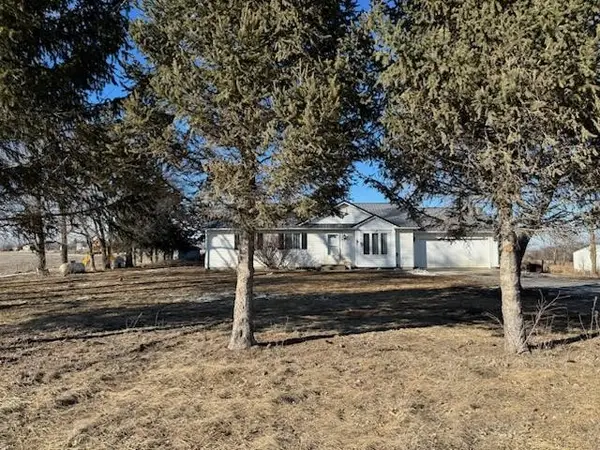 $329,000Pending3 beds 3 baths1,248 sq. ft.
2443 103rd Avenue, Columbia, IA 50057
MLS# 712307Listed by: HOME REALTY
Local realty services provided by:CENTURY 21 Signature Real Estate
Popular neighborhoods near 50057
Counties near Columbia, 50057
- Appanoose County properties for sale
- Clarke County properties for sale
- Dallas County properties for sale
- Decatur County properties for sale
- Jasper County properties for sale
- Keokuk County properties for sale
- Lucas County properties for sale
- Madison County properties for sale
- Mahaska County properties for sale
- Marion County properties for sale
- Marshall County properties for sale
- Mercer County properties for sale
- Monroe County properties for sale
- Polk County properties for sale
- Poweshiek County properties for sale
- Putnam County properties for sale
- Schuyler County properties for sale
- Wapello County properties for sale
- Warren County properties for sale
- Wayne County properties for sale
©2025 Century 21 Real Estate LLC. All rights reserved. CENTURY 21®, the CENTURY 21 Logo and C21® are service marks owned by Century 21 Real Estate LLC. Century 21 Real Estate LLC fully supports the principles of the Fair Housing Act and the Equal Opportunity Act. Each office is independently owned and operated. Listing information is deemed reliable but not guaranteed accurate.
©2025 Century 21 Real Estate LLC. All rights reserved. CENTURY 21®, the CENTURY 21 Logo and C21® are service marks owned by Century 21 Real Estate LLC. Century 21 Real Estate LLC fully supports the principles of the Fair Housing Act and the Equal Opportunity Act. Each office is independently owned and operated. Listing information is deemed reliable but not guaranteed accurate.