- Alma homes for sale
- Bailey homes for sale
- Blue River homes for sale
- Breckenridge homes for sale
- Como homes for sale
- Copper Mountain homes for sale
- Fairplay homes for sale
- Frisco homes for sale
- Granite homes for sale
- Grant homes for sale
- Hartsel homes for sale
- Jefferson homes for sale
- Keystone homes for sale
- Lake George homes for sale
- Leadville homes for sale
- Leadville North homes for sale
- Montezuma homes for sale
- Pine homes for sale
- Shawnee homes for sale
- Twin Lakes homes for sale
80432, CO - homes for sale
81 of 81 results displayed
- New
 $42,500Active2 Acres
445 Warpath Rd, Como, CO 80432
MLS# 7772082Listed by: Jefferson Real Estate - New
 $35,000Active2 Acres
600 Pronghorn, Jefferson, CO 80456
MLS# 3888720Listed by: COLDWELL BANKER REALTY BK
- New
 $35,000Active2 Acres
600 Pronghorn Drive, Como, CO 80432
MLS# 5737451Listed by: COLDWELL BANKER REALTY - New
 $59,999Active2 Acres
154 Raven Way, Como, CO 80432
MLS# 4848543Listed by: PlatLabs LLC - New
 $65,000Active4 Acres
615 Caracara Ln, Jefferson, CO 80456
MLS# 8880288Listed by: Your Castle Realty LLC - New
 $25,000Active3 Acres
3646 Remington Rd, Como, CO 80432
MLS# 9538777Listed by: Jefferson Real Estate  $95,000Active3.77 Acres
853 W Longbow Dr, Como, CO 80432
MLS# 1870103Listed by: Jefferson Real Estate $195,000Active5.17 Acres
538 Remington Road, Como, CO 80432
MLS# 4839739Listed by: HIGH COUNTRY REALTY LLC $25,890Active3 Acres
65 Veery Way, Jefferson, CO 80456
MLS# 2908187Listed by: Keller Williams Preferred Realty $495,000Active35.44 Acres
2559 Vista Grande Dr, Como, CO 80432
MLS# 7839655Listed by: Full Circle Real Estate Group $40,000Active2 Acres
50 Rawhide Way, Jefferson, CO 80456
MLS# 6331555Listed by: Hatch Realty, LLC $39,900Active3 Acres
Address Withheld By Seller, Jefferson, CO 80456
MLS# 5837495Listed by: Jefferson Real Estate $79,000Active5 Acres
688 Ouray Trl, Como, CO 80432
MLS# 2456777Listed by: Jefferson Real Estate $79,500Active5 Acres
769 Mockingbird Cir, Como, CO 80432
MLS# 8036426Listed by: Jefferson Real Estate $999,900Active160.19 Acres
828 Gitche Goone Lane, Jefferson, CO 80456
MLS# 1544706Listed by: PIKES PEAK DREAM HOMES REALTY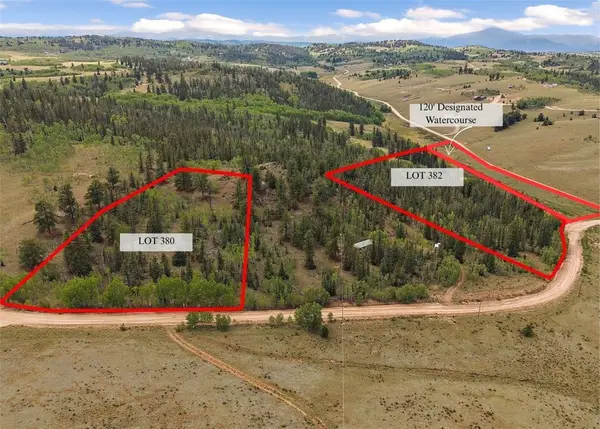 $59,500Active5 Acres
TBD382 Winchester Drive, Como, CO 80432
MLS# S1065682Listed by: ROAM REAL ESTATE GROUP, LLC $105,000Active35 Acres
5123 Bar D Rd, Como, CO 80432
MLS# 8323379Listed by: RE/MAX Synergy $48,999Active2 Acres
84 Konik Ln, Como, CO 80432
MLS# 4190918Listed by: eXp Realty, LLC $45,000Active2 Acres
53 Cobb Lane, Como, CO 80432
MLS# S1065807Listed by: RE/MAX NEXUS $65,000Active3 Acres
99 Hackney Lane, Como, CO 80432
MLS# S1065805Listed by: RE/MAX NEXUS $125,000Active35 Acres
2716 Gap Rd, Como, CO 80432
MLS# 2339273Listed by: Jefferson Real Estate $65,000Active3 Acres
29 Strelets Way, Como, CO 80432
MLS# 9695738Listed by: JEFFERSON REAL ESTATE $27,000Active1.68 Acres
581 Longbow Drive, Como, CO 80432
MLS# S1064573Listed by: JEFFERSON REAL ESTATE, INC. $540,000Active119.33 Acres
0 Night Hawk Cir, Como, CO 80432
MLS# 3464786Listed by: Jefferson Real Estate $34,900Pending2.43 Acres
646 Antelope Way, Como, CO 80432
MLS# 8799491Listed by: JEFFERSON REAL ESTATE $32,000Active1.01 Acres
210 Tepee Trl, Como, CO 80432
MLS# 3473279Listed by: Jefferson Real Estate $99,900Active8.15 Acres
0 Haida Ln, Como, CO 80432
MLS# 3440056Listed by: Jefferson Real Estate $27,900Active4 Acres
32 Hanover Lane, Como, CO 80432
MLS# S1064028Listed by: JEFFERSON REAL ESTATE, INC. $29,900Active2 Acres
805 Longbow Dr, Como, CO 80432
MLS# 3292963Listed by: Jefferson Real Estate $29,900Active2 Acres
805 Longbow Drive, Como, CO 80432
MLS# S1064021Listed by: JEFFERSON REAL ESTATE, INC. $29,900Active2 Acres
805 Longbow Drive, Como, CO 80432
MLS# 3292963Listed by: JEFFERSON REAL ESTATE $105,000Active35 Acres
622 Rainbow Drive, Como, CO 80432
MLS# S1063843Listed by: RE/MAX NEXUS $46,499Active4.43 Acres
317 Lippzana Rd, Como, CO 80432
MLS# 2562611Listed by: Jefferson Real Estate $21,000Active5.5 Acres
901 Elkhorn View Dr, Como, CO 80432
MLS# 4765787Listed by: Jefferson Real Estate $32,000Pending3 Acres
6452 Remington Rd, Como, CO 80432
MLS# 3154636Listed by: Jefferson Real Estate $50,000Active2.25 Acres
530 Gitche Goone Lane, Como, CO 80432
MLS# S1062423Listed by: ALPENGLOW REAL ESTATE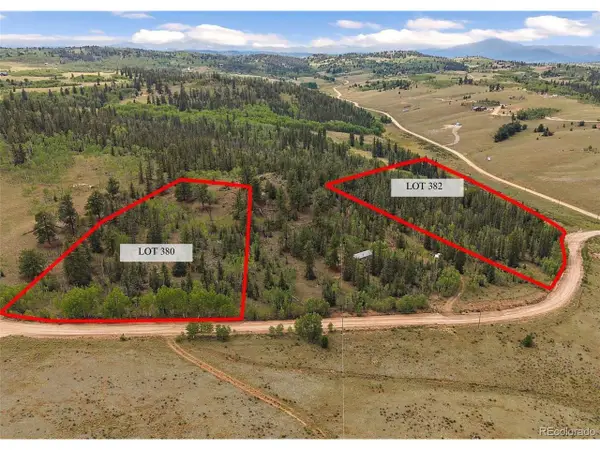 $59,500Active5 Acres
0 Winchester Dr, Como, CO 80432
MLS# 4694337Listed by: Roam Real Estate Group $45,000Active1 Acres
431 Arrowhead Drive, Como, CO 80432
MLS# S1062283Listed by: RE/MAX NEXUS $39,900Active3 Acres
28 Old Squaw Road, Como, CO 80432
MLS# S1062218Listed by: JEFFERSON REAL ESTATE, INC. $69,900Active2.81 Acres
Address Withheld By Seller, Como, CO 80432
MLS# 1683377Listed by: Jefferson Real Estate $32,000Active1.04 Acres
2475 W Longbow Drive, Como, CO 80432
MLS# S1061984Listed by: RE/MAX NEXUS $99,000Active10.63 Acres
496 Houma Way, Como, CO 80432
MLS# 9237625Listed by: United Country Mountain Brokers $70,000Active35 Acres
221 Vista Grande Court, Como, CO 80432
MLS# 6736012Listed by: HOMESMART $25,000Active1.05 Acres
702 Pinto Trl, Como, CO 80432
MLS# 8330967Listed by: Jefferson Real Estate $50,000Active1.06 Acres
1630 Wampum Lane, Como, CO 80432
MLS# S1061774Listed by: RE/MAX NEXUS $45,000Active1 Acres
22 Teton Trail, Como, CO 80432
MLS# S1061653Listed by: RE/MAX NEXUS $42,000Active3 Acres
924 Mustang Rd, Como, CO 80432
MLS# 5467066Listed by: Jefferson Real Estate $34,000Active3 Acres
1310 Mcdowell Drive, Como, CO 80432
MLS# S1061458Listed by: JEFFERSON REAL ESTATE, INC. $34,000Active3 Acres
1310 Mcdowell Dr, Como, CO 80432
MLS# 2138167Listed by: Jefferson Real Estate $35,000Active4.19 Acres
458 Remington Rd, Jefferson, CO 80432
MLS# 9677584Listed by: Worth Clark Realty $125,000Active42.97 Acres
450 S Park Dr, Como, CO 80432
MLS# 5824150Listed by: Swan Realty Corp $38,400Active1.13 Acres
75 Ithaca Ln, Como, CO 80432
MLS# 2568855Listed by: Jefferson Real Estate $38,900Active1.17 Acres
113 Ithaca Ln, Como, CO 80432
MLS# 2235686Listed by: Jefferson Real Estate $38,000Active1.03 Acres
514 Chief Trl, Como, CO 80432
MLS# 4274222Listed by: Jefferson Real Estate $75,000Active2 Acres
258 Old Squaw Rd, Como, CO 80432
MLS# 7265225Listed by: Jefferson Real Estate $49,000Active2 Acres
943 Bear Lane, Como, CO 80432
MLS# S1057983Listed by: EXP REALTY, LLC, MOUNTAIN HOUSE PROPERTIES $450,000Active35 Acres
4019 Buffalo Ridge Road, Como, CO 80456
MLS# S1058055Listed by: HIGH RIDGE REALTY, LLC $450,000Active35 Acres
4019 Buffalo Ridge Rd, Como, CO 80432
MLS# 7885383Listed by: High Ridge Realty $48,000Active3 Acres
1950 Travois Rd, Como, CO 80432
MLS# 1586321Listed by: Caniglia Real Estate Group Llc $95,000Active5 Acres
908 Raven Way, Como, CO 80432
MLS# 7496978Listed by: Jefferson Real Estate $45,000Active2 Acres
0 Kiowa St, Como, CO 80432
MLS# 8331488Listed by: Jefferson Real Estate $45,000Active2 Acres
499 Kiowa St, Como, CO 80432
MLS# 3190105Listed by: Jefferson Real Estate $34,000Active2 Acres
2892 Breton Cir, Como, CO 80432
MLS# 3038868Listed by: Caniglia Real Estate Group Llc $118,000Active35 Acres
797 Vista Grande Dr, Como, CO 80432
MLS# 7853741Listed by: Brookshire Homes Realty $30,000Active2.18 Acres
1290 Lippzana Rd, Como, CO 80432
MLS# 2025703Listed by: Jefferson Real Estate $45,000Active2.12 Acres
192 Bear Way, Como, CO 80432
MLS# 2666824Listed by: Jefferson Real Estate $40,000Active4.13 Acres
143 Lippzana Rd, Como, CO 80432
MLS# 6077931Listed by: Jefferson Real Estate $27,000Active1.68 Acres
581 Longbow Dr, Como, CO 80432
MLS# 1527074Listed by: Jefferson Real Estate $49,500Active2.7 Acres
95 Wabeno Ct, Jefferson, CO 80456
MLS# 4514324Listed by: Legacy 100 Real Estate Partners LLC $42,500Active2.05 Acres
98 Wabeno Ct, Jefferson, CO 80456
MLS# 5983547Listed by: Legacy 100 Real Estate Partners LLC $65,000Active35 Acres
31 Boyero Rd, Como, CO 80432
MLS# 5377877Listed by: Harvest Realty $8,000,000Active0 Acres
21103 Elkhorn Road, Como, CO 80456
MLS# 6795436Listed by: CONFLUENCE LAND COMPANY $4,000,000Active0 Acres
1185 County Road 734, Fairplay, CO 80440
MLS# 9947118Listed by: CONFLUENCE LAND COMPANY $8,000,000Active2420 Acres
21103 Elkhorn Rd, Como, CO 80432
MLS# 9718218Listed by: Confluence Land Company $37,000Active12 Acres
735 Link Rd, Como, CO 80432
MLS# 4700882Listed by: Jefferson Real Estate $32,000Active12 Acres
803 Link Rd, Como, CO 80432
MLS# 8758696Listed by: Jefferson Real Estate $27,000Active2.23 Acres
825 Gitche Goone Ln, Como, CO 80432
MLS# 4124834Listed by: Jefferson Real Estate $21,900Active1 Acres
1878 Kiowa St, Como, CO 80432
MLS# 9609822Listed by: Jefferson Real Estate $37,400Active1.22 Acres
522 Tepee Trail, Como, CO 80432
MLS# 2220902Listed by: JEFFERSON REAL ESTATE $190,000Active40 Acres
157 Crow Ct, Como, CO 80432
MLS# 8774126Listed by: Guide Real Estate $43,000Active4 Acres
3547 Arrowhead Dr, Como, CO 80432
MLS# 5402296Listed by: Jefferson Real Estate
Local realty services provided by:CENTURY 21 Top Dog Properties, CENTURY 21 Signature Realty
The real estate listing information and related content displayed on this site is provided exclusively for consumer's personal, non-commercial use and may not be used for any purpose other than to identify prospective properties consumers may be interested in purchasing. This information and related content is deemed reliable but is not guaranteed accurate by Information and Real Estate Services, LLC.
Information source: Information and Real Estate Services, LLC. Provided for limited non-commercial use only under IRES Rules © Copyright IRES. The information being provided by Information and Real Estate Services is for the consumer's personal, non-commercial use and may not be used for any purpose other than to identify prospective properties consumer may be interested in purchasing. Any information relating to real estate for sale referenced on this web site comes from the Internet Data Exchange (IDX) program of the Information and Real Estate Services. This web site may reference real estate listing(s) held by a brokerage firm other than the broker and/or agent who owns this web site.
The accuracy of all information, regardless of source, including but not limited to open house information, square footages and lot sizes, is deemed reliable but not guaranteed and should be personally verified through personal inspection by and/or with the appropriate professionals. The data contained herein is copyrighted by Information and Real Estate Services and is protected by all applicable copyright laws. Any unauthorized dissemination of this information is in violation of copyright laws and is strictly prohibited.
Based on information submitted to the MLS GRID as of March 27, 2026 11:47 PM. All data is obtained from various sources and may not have been verified by broker or MLS GRID. Supplied Open House information is subject to change without notice. All information should be independently reviewed and verified for accuracy. Properties may or may not be listed by the office/agent presenting the information.
The information being provided by Pikes Peak REALTOR® Services Corp. is for the consumer's personal, non-commercial use and may not be used for any purpose other than to identify prospective properties consumer may be interested in purchasing. Any information relating to real estate for sale referenced on this web site comes from the Internet Data Exchange (IDX) program of the Pikes Peak REALTOR® Services Corp.. CENTURY 21 Top Dog Properties is not a Multiple Listing Service (MLS), nor does it offer MLS access. This website is a service of CENTURY 21 Top Dog Properties, a broker participant of Pikes Peak REALTOR® Services Corp.. This web site may reference real estate listing(s) held by a brokerage firm other than the broker and/or agent who owns this web site.
The accuracy of all information, regardless of source, including but not limited to open house information, square footages and lot sizes, is deemed reliable but not guaranteed and should be personally verified through personal inspection by and/or with the appropriate professionals. The data contained herein is copyrighted by Pikes Peak REALTOR® Services Corp. and is protected by all applicable copyright laws. Any unauthorized dissemination of this information is in violation of copyright laws and is strictly prohibited.
The real estate listing information and related content displayed on this site is provided exclusively for consumers' personal, non-commercial use and may not be used for any purpose other than to identify prospective properties consumers may be interested in purchasing. This information and related content is deemed reliable but is not guaranteed accurate by the Pikes Peak REALTOR® Services Corp.
Copyright 2026 Pikes Peak REALTOR® Services Corp. All rights reserved.
Popular searches near 80432
Popular neighborhoods near 80432
- Aspen Park, Morrison homes for sale
- Bear Mountain Vista, Evergreen homes for sale
- Dome Rock, Littleton homes for sale
- Eagles Nest, Silverthorne homes for sale
- Empire, Empire homes for sale
- Evergreen, Evergreen homes for sale
- Georgetown, Georgetown homes for sale
- Hiwan, Evergreen homes for sale
- Homestead, Morrison homes for sale
- Idaho Springs, Idaho Springs homes for sale
- Indian Hills, Indian Hills homes for sale
- Ken-Caryl Ranch, Littleton homes for sale
- Keystone, Dillon homes for sale
- North Turkey Creek, Morrison homes for sale
- Soda Creek, Evergreen homes for sale
- Soda Creek at Lake Dillon, Dillon homes for sale
- Summit Cove, Dillon homes for sale
- The Highlands, Breckenridge homes for sale
- The Ponds at Blue River, Silverthorne homes for sale
- The River Course at Keystone, Dillon homes for sale
Counties near Como, 80432
- Boulder County homes for sale
- Broomfield County homes for sale
- Chaffee County homes for sale
- Clear Creek County homes for sale
- Custer County homes for sale
- Denver County homes for sale
- Douglas County homes for sale
- Eagle County homes for sale
- El Paso County homes for sale
- Fremont County homes for sale
- Gilpin County homes for sale
- Grand County homes for sale
- Gunnison County homes for sale
- Jefferson County homes for sale
- Lake County homes for sale
- Park County homes for sale
- Pitkin County homes for sale
- Saguache County homes for sale
- Summit County homes for sale
- Teller County homes for sale
Protect your home and budget from life's surprises with an Assurant Home Warranty, backed by a partner that supports you through every step of homeownership. Explore Plans.
©2026 Century 21 Real Estate LLC. All rights reserved. CENTURY 21®, the CENTURY 21 Logo and C21® are service marks owned by Century 21 Real Estate LLC. Century 21 Real Estate LLC fully supports the principles of the Fair Housing Act and the Equal Opportunity Act. Each office is independently owned and operated. Listing information is deemed reliable but not guaranteed accurate.