- Anaheim-Santa Ana-Garden Grove homes for sale
- Central Coast homes for sale
- Corona Del Mar homes for sale
- Costa Mesa homes for sale
- Fountain Valley homes for sale
- Garden Grove homes for sale
- Huntington Beach homes for sale
- Irvine homes for sale
- Irvine-Lake Forest homes for sale
- Midway City homes for sale
- Newport Beach homes for sale
- Newport Coast homes for sale
- North Coast homes for sale
- North Tustin homes for sale
- Orange homes for sale
- Santa Ana homes for sale
- Stanton homes for sale
- Sunset Beach homes for sale
- Tustin homes for sale
- Westminster homes for sale
92626, CA - homes for sale
8 of 8 results displayed
 $799,000Active2 beds 2 baths1,221 sq. ft.
810 Baker #210, Costa Mesa, CA 92626
MLS# OC26056899Listed by: MARTERRA REAL ESTATE $695,000Active3 beds 2 baths1,736 sq. ft.
3437 Pinebrook Circle #101, Costa Mesa, CA 92626
MLS# CRNP26051060Listed by: LA PLACA PROPERTIES $779,999Pending2 beds 2 baths1,119 sq. ft.
2330 Vanguard Way #L101, Costa Mesa, CA 92626
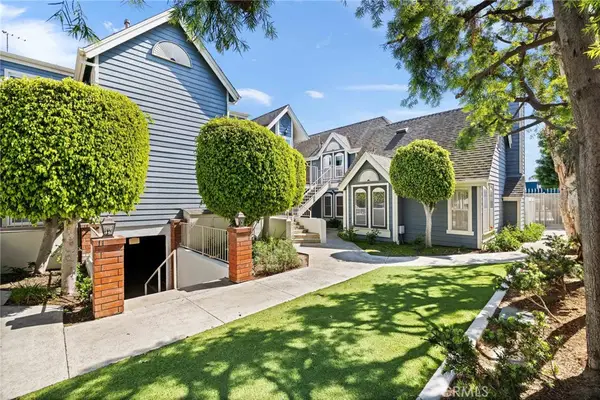
MLS# CROC26044686Listed by: FIRST TEAM REAL ESTATE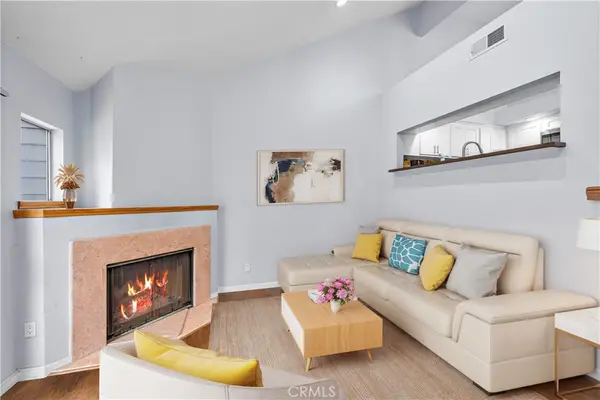 $635,000Active1 beds 1 baths864 sq. ft.
781 Grayling, Costa Mesa, CA 92626
MLS# OC26036650Listed by: FIRST TEAM REAL ESTATE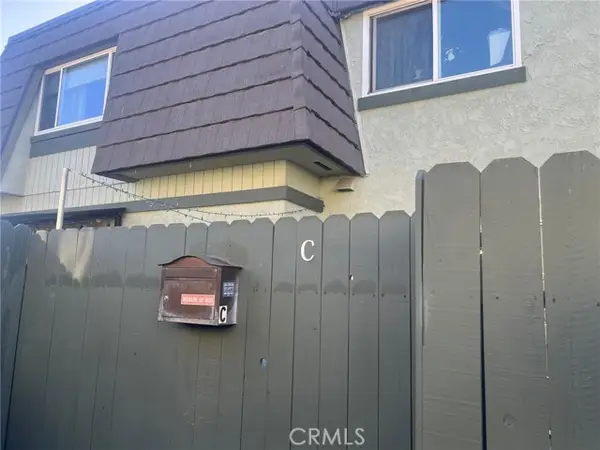 $644,500Active2 beds 1 baths890 sq. ft.
1616 Iowa #C, Costa Mesa, CA 92626
MLS# CRPW26029024Listed by: INTEGRA PROPERTIES $699,999Active2 beds 2 baths985 sq. ft.
783 Grayling, Costa Mesa, CA 92626
MLS# OC26021945Listed by: DSJ PROPERTY MANAGEMENT INC.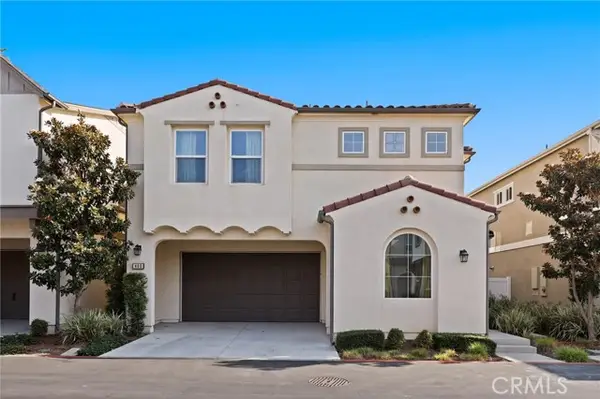 $1,474,800Active4 beds 3 baths2,225 sq. ft.
403 Aura Drive, Costa Mesa, CA 92626
MLS# CROC26003133Listed by: REDFIN $750,000Active2 beds 2 baths1,090 sq. ft.
2330 Vanguard #F102, Costa Mesa, CA 92626
MLS# NP26032554Listed by: RE/MAX FINE HOMES
Local realty services provided by:CENTURY 21 Affiliated, CENTURY 21 Sierra Properties
The information being provided by California Regional MLS (Southern California) is for the consumer's personal, non-commercial use and may not be used for any purpose other than to identify prospective properties consumer may be interested in purchasing. Any information relating to real estate for sale referenced on this web site comes from the Internet Data Exchange (IDX) program of the California Regional MLS (Southern California). CENTURY 21 Affiliated is not a Multiple Listing Service (MLS), nor does it offer MLS access. This website is a service of CENTURY 21 Affiliated, a broker participant of California Regional MLS (Southern California). This web site may reference real estate listing(s) held by a brokerage firm other than the broker and/or agent who owns this web site.
The accuracy of all information, regardless of source, including but not limited to open house information, square footages and lot sizes, is deemed reliable but not guaranteed and should be personally verified through personal inspection by and/or with the appropriate professionals. The data contained herein is copyrighted by California Regional MLS (Southern California) and is protected by all applicable copyright laws. Any unauthorized dissemination of this information is in violation of copyright laws and is strictly prohibited.
Copyright 2021 California Regional MLS (Southern California). All rights reserved.
Popular searches near 92626
Popular neighborhoods near 92626
- Central Costa Mesa, Costa Mesa homes for sale
- College Park, Costa Mesa homes for sale
- Downtown, Costa Mesa homes for sale
- Eastside Costa Mesa, Costa Mesa homes for sale
- Halecrest, Costa Mesa homes for sale
- Harbor Boulevard Corridor, Costa Mesa homes for sale
- Hutton Centre, Santa Ana homes for sale
- Mesa Del Mar, Costa Mesa homes for sale
- Mesa Verde, Costa Mesa homes for sale
- North Costa Mesa, Costa Mesa homes for sale
- North Mesa, Costa Mesa homes for sale
- Orange County Fairgrounds, Costa Mesa homes for sale
- Republic Homes, Santa Ana homes for sale
- Sandpointe, Santa Ana homes for sale
- Santa Ana Heights, Newport Beach homes for sale
- SoBECA, Costa Mesa homes for sale
- South Coast, Santa Ana homes for sale
- South Coast Metro, Costa Mesa homes for sale
- The Island Streets, Costa Mesa homes for sale
- Wimbledon Village, Costa Mesa homes for sale
Counties near Costa Mesa, 92626
Protect your home and budget from life's surprises with an Assurant Home Warranty, backed by a partner that supports you through every step of homeownership. Explore Plans.
©2026 Century 21 Real Estate LLC. All rights reserved. CENTURY 21®, the CENTURY 21 Logo and C21® are service marks owned by Century 21 Real Estate LLC. Century 21 Real Estate LLC fully supports the principles of the Fair Housing Act and the Equal Opportunity Act. Each office is independently owned and operated. Listing information is deemed reliable but not guaranteed accurate.