- Almira properties for sale
- Bridgeport properties for sale
- Bridgeport properties for sale
- Chelan properties for sale
- Chelan Falls properties for sale
- Coulee City properties for sale
- Coulee City properties for sale
- Coulee Dam properties for sale
- Electric City properties for sale
- Ephrata properties for sale
- Ephrata-Soap Lake properties for sale
- Gloyd properties for sale
- Grand Coulee properties for sale
- Grand Coulee properties for sale
- Lakeview properties for sale
- Mansfield properties for sale
- Marlin properties for sale
- Soap Lake properties for sale
- Waterville properties for sale
- Wilson Creek properties for sale
99115, WA - homes for sale
22 of 22 results displayed
 $245,000Pending3 beds 2 baths1,728 sq. ft.
37585 Western Avenue Ne, Coulee City, WA 99115
MLS# 2457799Listed by: HOMESMART
 $75,000Active20 Acres
1 Banks Lake View Road Ne #1, Coulee City, WA 99115
MLS# 2455412Listed by: BHGRE GARY MANN REALTY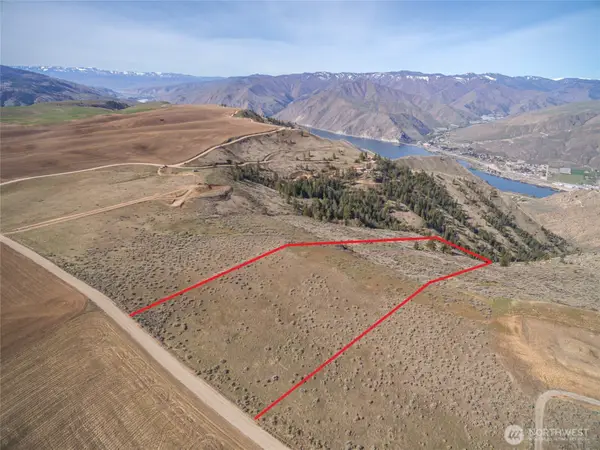 $180,000Active20 Acres
12 Road S Nw #12, Waterville, WA 98858
MLS# 2451836Listed by: NICK MCLEAN REAL ESTATE GROUP $180,000Active20 Acres
13 Road S Nw #13, Waterville, WA 98858
MLS# 2451850Listed by: NICK MCLEAN REAL ESTATE GROUP $145,000Active0.06 Acres
31465 Moore Road Ne #616, Coulee City, WA 99115
MLS# 2448649Listed by: RE/MAX HONORS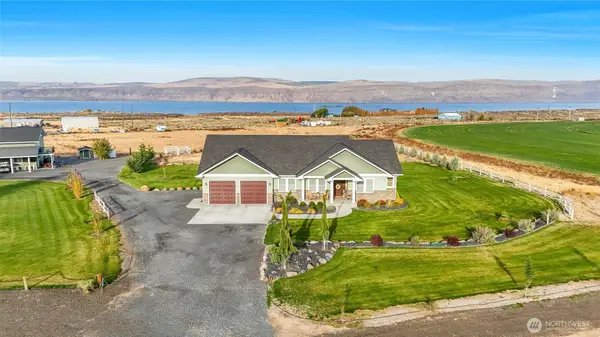 $895,000Active3 beds 2 baths3,044 sq. ft.
10410 Northern Avenue Ne, Coulee City, WA 99115
MLS# 2447199Listed by: BHGRE GARY MANN REALTY $150,000Active20.01 Acres
58 Banks Lake View Road, Coulee City, WA 99115
MLS# 2445074Listed by: HOMESMART $89,999Active55 Acres
0 Us 2, Coulee City, WA 99115
MLS# 2438599Listed by: WINDERMERE RE K-2 REALTY $325,000Active3 beds 2 baths1,215 sq. ft.
405 E Chelan Street, Coulee City, WA 99115
MLS# 2436253Listed by: HOMESMART $155,000Active5 Acres
35914 NE Rd J.7, Coulee City, WA 99115
MLS# 2433287Listed by: HOMECOIN.COM $495,000Active40 Acres
10835 Ne Road, Coulee City, WA 99115
MLS# 2431793Listed by: HOMECOIN.COM $110,000Active1.53 Acres
0 J Ne, Coulee City, WA 99115
MLS# 2419143Listed by: NEXTHOME 365 REALTY $339,000Active2 beds 2 baths1,248 sq. ft.
411 E Washington Street, Coulee City, WA 99115
MLS# 2419064Listed by: COFFMAN PROPERTIES $249,000Active20 Acres
210 Banks Lake Road #17, Coulee City, WA 99115
MLS# 2406236Listed by: HOMESMART $298,000Active20.19 Acres
41 Banks Lake View Road #15, Coulee City, WA 99115
MLS# 2403854Listed by: HOMESMART $265,000Active20 Acres
215 Banks Lake View Road #13, Coulee City, WA 99115
MLS# 2379295Listed by: HOMESMART $629,000Active640 Acres
4 Road J Ne, Mansfield, WA 98830
MLS# 2324857Listed by: WINDERMERE RE/LAKE CHELAN $365,750Active4 beds 3 baths3,132 sq. ft.
212 E Locust Street, Coulee City, WA 99115
MLS# 2454777Listed by: DOVE REALTY, INC. $199,000Active2 beds 1 baths1,346 sq. ft.
120 E Lewis Street, Coulee City, WA 99115
MLS# 2318682Listed by: HOMESMART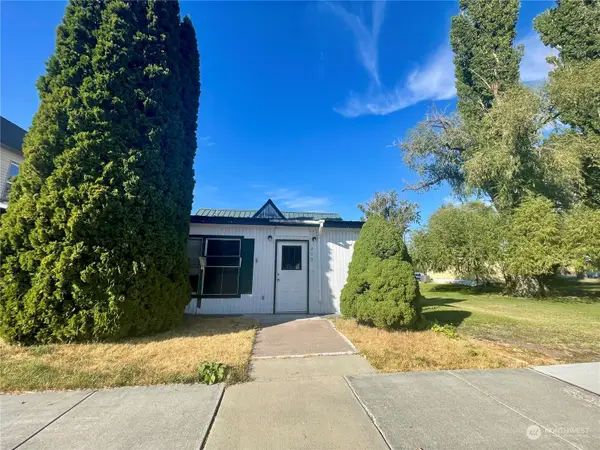 $69,000Active1 beds 1 baths1,271 sq. ft.
206 E Main Street, Coulee City, WA 99115
MLS# 2291930Listed by: HOMESMART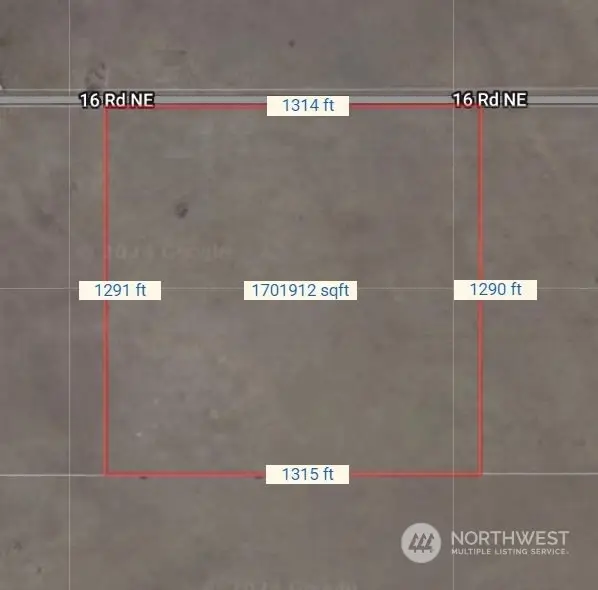 $42,500Active39 Acres
0 Bz 16 Road Ne, Mansfield, WA 98830
MLS# 2288709Listed by: BEST CHOICE REALTY LLC $799,999Pending-- beds -- baths2,996 sq. ft.
32761 NE K Road, Coulee City, WA 99115
MLS# 2142095Listed by: EXP REALTY
Local realty services provided by:CENTURY 21 Tri-Cities
Listings courtesy of Northwest MLS as distributed by MLS GRID. Based on information submitted to the MLS GRID as of December 19, 2025. All data is obtained from various sources and may not have been verified by broker or MLS GRID. Supplied Open House Information is subject to change without notice. All information should be independently reviewed and verified for accuracy. Properties may or may not be listed by the office/agent presenting the information. Listing information is provided for consumers' personal, non-commercial use, solely to identify prospective properties for potential purchase; all other use is strictly prohibited and may violate relevant federal and state law. Information deemed reliable but not guaranteed. Copyright © 2025 MLS GRID. All Rights Reserved.
Popular searches near 99115
Popular neighborhoods near 99115
- Airway Heights, Airway Heights properties for sale
- Browne's Addition, Spokane properties for sale
- Cliff/Cannon, Spokane properties for sale
- Comstock, Spokane properties for sale
- Emerson, Spokane properties for sale
- Five Mile, Spokane properties for sale
- Grandview, Spokane properties for sale
- Latah Valley, Spokane properties for sale
- Lidgerwood Park, Spokane properties for sale
- Logan, Spokane properties for sale
- Manito, Spokane properties for sale
- Nevada / Lidgerwood, Spokane properties for sale
- North Hill, Spokane properties for sale
- North Indian Trail, Spokane properties for sale
- Northwest, Spokane properties for sale
- Riverside, Spokane properties for sale
- Shiloh Hills, Spokane properties for sale
- South Indian Trail, Spokane properties for sale
- West Central, Spokane properties for sale
- West Hills, Spokane properties for sale
Counties near Coulee City, 99115
- Adams County properties for sale
- Benton County properties for sale
- Chelan County properties for sale
- Douglas County properties for sale
- Ferry County properties for sale
- Franklin County properties for sale
- Grant County properties for sale
- Kittitas County properties for sale
- Lincoln County properties for sale
- Okanogan County properties for sale
- Spokane County properties for sale
- Stevens County properties for sale
- Yakima County properties for sale
©2025 Century 21 Real Estate LLC. All rights reserved. CENTURY 21®, the CENTURY 21 Logo and C21® are service marks owned by Century 21 Real Estate LLC. Century 21 Real Estate LLC fully supports the principles of the Fair Housing Act and the Equal Opportunity Act. Each office is independently owned and operated. Listing information is deemed reliable but not guaranteed accurate.
©2025 Century 21 Real Estate LLC. All rights reserved. CENTURY 21®, the CENTURY 21 Logo and C21® are service marks owned by Century 21 Real Estate LLC. Century 21 Real Estate LLC fully supports the principles of the Fair Housing Act and the Equal Opportunity Act. Each office is independently owned and operated. Listing information is deemed reliable but not guaranteed accurate.