- Airway Heights, Airway Heights homes for sale
- Browne's Addition, Spokane homes for sale
- Cliff/Cannon, Spokane homes for sale
- Emerson, Spokane homes for sale
- Five Mile, Spokane homes for sale
- Grandview, Spokane homes for sale
- Latah Valley, Spokane homes for sale
- Lidgerwood Park, Spokane homes for sale
- Logan, Spokane homes for sale
- Manito, Spokane homes for sale
- Nevada / Lidgerwood, Spokane homes for sale
- North Hill, Spokane homes for sale
- North Indian Trail, Spokane homes for sale
- Northwest, Spokane homes for sale
- Riverside, Spokane homes for sale
- Shiloh Hills, Spokane homes for sale
- South Indian Trail, Spokane homes for sale
- West Central, Spokane homes for sale
- West Hills, Spokane homes for sale
- Whitman, Spokane homes for sale
Coulee Dam, WA - homes for sale
9 of 9 results displayed
- New
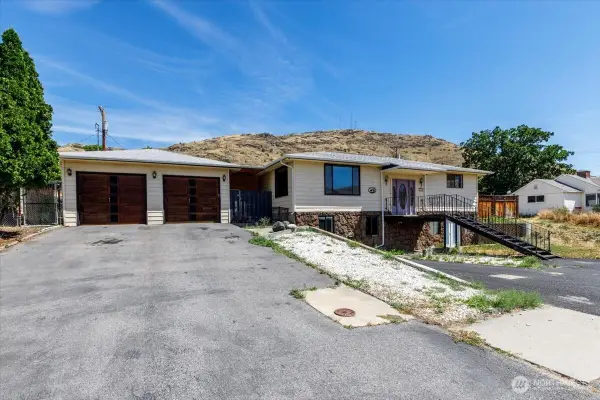 $695,000Active4 beds 4 baths2,988 sq. ft.
801 Tulip Street, Coulee Dam, WA 99116
MLS# 2548496Listed by: EXP REALTY
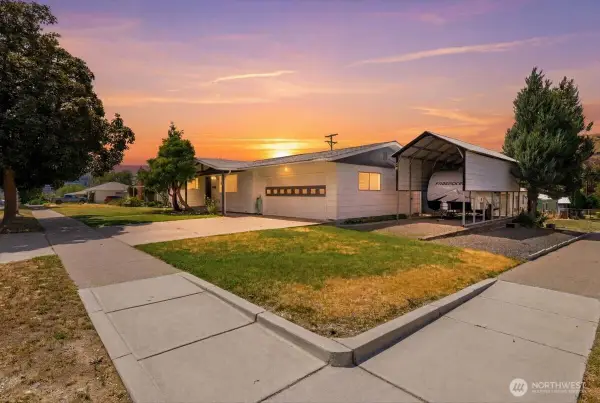 $360,000Active5 beds 3 baths2,912 sq. ft.
806 Central Drive, Coulee Dam, WA 99116
MLS# 2548874Listed by: EXP REALTY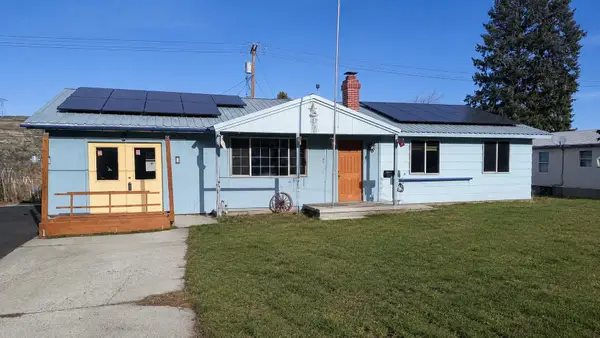 $215,000Active3 beds 2 baths1,280 sq. ft.
1124 Camas St, Coulee Dam, WA 99116
MLS# 202620038Listed by: EXTANT REALTY $75,000Active3 beds 1 baths814 sq. ft.
602 Cedar Street, Coulee Dam, WA 99116
MLS# 2537982Listed by: LPT REALTY LLC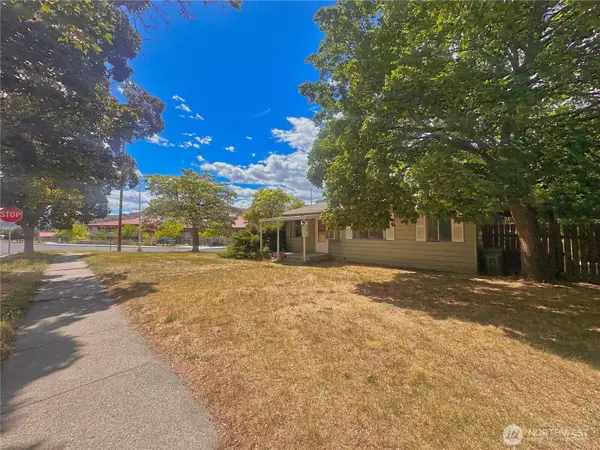 $234,950Active3 beds 2 baths1,224 sq. ft.
1000 Central Drive, Coulee Dam, WA 99116
MLS# 2532421Listed by: BEST CHOICE REALTY LLC $399,000Active3 beds 2 baths2,057 sq. ft.
1013 River Drive, Coulee Dam, WA 99116
MLS# 2536225Listed by: EXP REALTY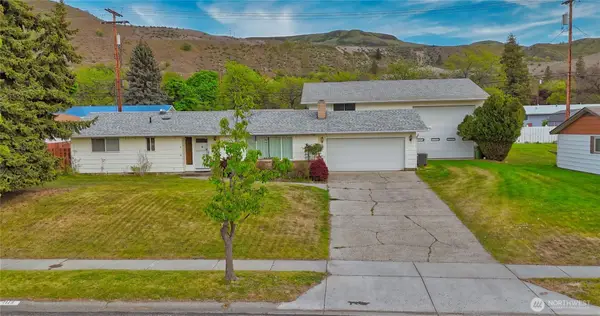 $399,900Active4 beds 3 baths2,364 sq. ft.
1113 River Drive, Coulee Dam, WA 99116
MLS# 2517169Listed by: BEST CHOICE REALTY LLC $299,000Active3 beds 1 baths1,682 sq. ft.
804 Central Drive, Coulee Dam, WA 99116
MLS# 2483132Listed by: BEST CHOICE REALTY LLC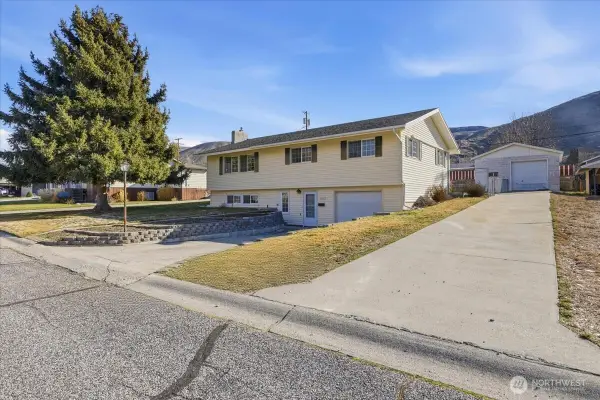 $415,000Active3 beds 3 baths2,640 sq. ft.
707 Spruce Street, Coulee Dam, WA 99116
MLS# 2484598Listed by: EXP REALTY
Local realty services provided by:CENTURY 21 Van Dorm Realty, CENTURY 21 Kelly Davis
Listings courtesy of Northwest MLS as distributed by MLS GRID. Based on information submitted to the MLS GRID as of July 17, 2026. All data is obtained from various sources and may not have been verified by broker or MLS GRID. Supplied Open House Information is subject to change without notice. All information should be independently reviewed and verified for accuracy. Properties may or may not be listed by the office/agent presenting the information. Listing information is provided for consumers' personal, non-commercial use, solely to identify prospective properties for potential purchase; all other use is strictly prohibited and may violate relevant federal and state law. Information deemed reliable but not guaranteed. Copyright © 2026 MLS GRID. All Rights Reserved. NWMLS Member Broker: Jeffrey Pust
Neighborhoods near Coulee Dam, WA
Zip codes near Coulee Dam, WA
- 98812 homes for sale
- 98813 homes for sale
- 98829 homes for sale
- 98830 homes for sale
- 98840 homes for sale
- 98841 homes for sale
- 98860 homes for sale
- 99103 homes for sale
- 99115 homes for sale
- 99116 homes for sale
- 99117 homes for sale
- 99122 homes for sale
- 99123 homes for sale
- 99129 homes for sale
- 99131 homes for sale
- 99133 homes for sale
- 99134 homes for sale
- 99138 homes for sale
- 99147 homes for sale
- 99185 homes for sale
Popular searches near Coulee Dam, WA
- Almira homes for sale
- Brewster homes for sale
- Bridgeport homes for sale
- Bridgeport homes for sale
- Colville Reservation homes for sale
- Colville Reservation homes for sale
- Coulee City homes for sale
- Coulee City homes for sale
- Creston homes for sale
- Deer Meadows homes for sale
- Electric City homes for sale
- Fruitland homes for sale
- Grand Coulee homes for sale
- Grand Coulee homes for sale
- Lincoln homes for sale
- Mansfield homes for sale
- Okanogan homes for sale
- Seven Bays homes for sale
- Wilbur homes for sale
- Wilson Creek homes for sale
Protect your home and budget from life's surprises with an Assurant Home Warranty, backed by a partner that supports you through every step of homeownership. Explore Plans.
©2026 Century 21 Real Estate LLC. All rights reserved. CENTURY 21®, the CENTURY 21 Logo and C21® are service marks owned by Century 21 Real Estate LLC. Century 21 Real Estate LLC fully supports the principles of the Fair Housing Act and the Equal Opportunity Act. Each office is independently owned and operated. Listing information is deemed reliable but not guaranteed accurate.