- Benbrook Lakeside, Benbrook homes for sale
- DeCordova Bend Estates, Granbury homes for sale
- Hulen Heights, Fort Worth homes for sale
- Lost Creek Estates, Fort Worth homes for sale
- Meadows Of Candleridge, Fort Worth homes for sale
- Mira Vista, Fort Worth homes for sale
- Mustang Park, Fort Worth homes for sale
- Panther Heights, Crowley homes for sale
- Pecan Plantation, Granbury homes for sale
- Poynter Crossing, Fort Worth homes for sale
- Primrose Crossing, Fort Worth homes for sale
- Quail Ridge Estates, Fort Worth homes for sale
- Rosemary Ridge, Crowley homes for sale
- Stone Meadow, Fort Worth homes for sale
- Summer Creek, Fort Worth homes for sale
- Summer Creek Ranch, Fort Worth homes for sale
- Summer Creek South, Fort Worth homes for sale
- Timber Creek, Fort Worth homes for sale
- Westpark Estates, Fort Worth homes for sale
- White Stone, Fort Worth homes for sale
Cresson, TX - homes for sale
28 of 28 results displayed
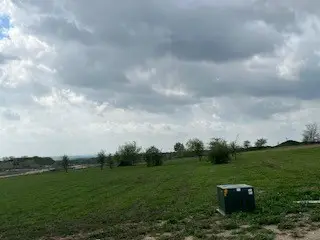 $145,000Pending2.03 Acres
101 Alexander Court, Cresson, TX 76035
MLS# 21209179Listed by: MINERAL GROVE REALTY, LLC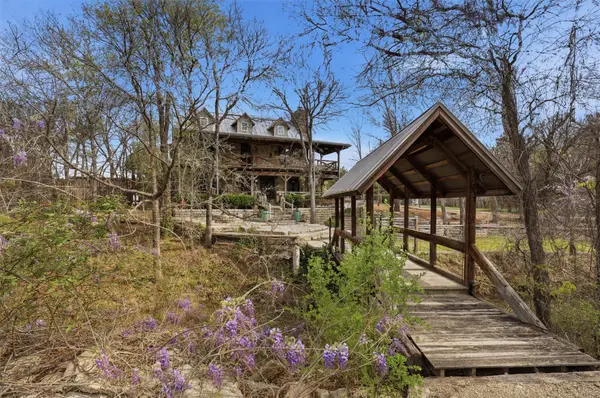 $674,900Pending3 beds 3 baths1,890 sq. ft.
209 Bluebonnet Court, Cresson, TX 76035
MLS# 21212984Listed by: THE FORT REAL ESTATE $129,900Active2.19 Acres
1006 Rana Drive, Cresson, TX 76035
MLS# 21197464Listed by: NEWFOUND REAL ESTATE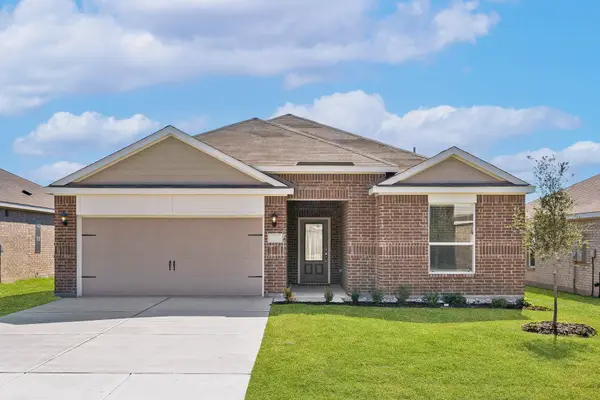 $314,900Active4 beds 2 baths1,784 sq. ft.
13413 Hang Fire Lane, Cresson, TX 76035
MLS# 21201287Listed by: LGI HOMES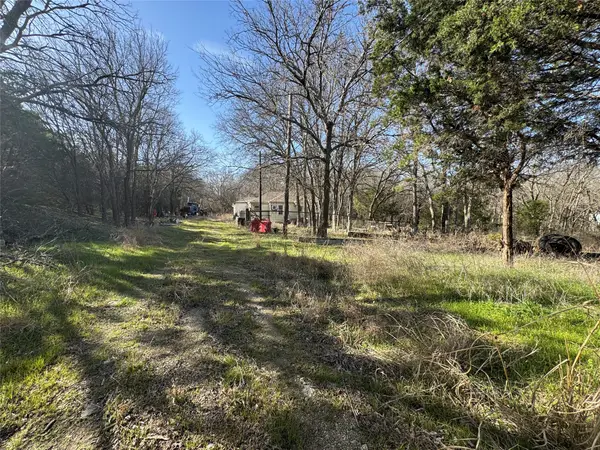 $194,999Active3 beds 1 baths1,676 sq. ft.
329 S Skyline Court, Cresson, TX 76035
MLS# 21182574Listed by: FOCUS ON HOMES REALTY LLC $200,000Active2.01 Acres
3123 Rio Grande, Cresson, TX 76035
MLS# 21164057Listed by: THE AGENCY FRISCO $215,000Active2.02 Acres
430 Conway Cove, Cresson, TX 76035
MLS# 21164094Listed by: THE AGENCY FRISCO $661,000Active4 beds 4 baths2,347 sq. ft.
208 N Mountain Ridge, Cresson, TX 76035
MLS# 21167024Listed by: CHARITABLE REALTY $3,350,000Active4 beds 5 baths4,750 sq. ft.
3117 Rio Grande Circle, Granbury, TX 76035
MLS# 21203381Listed by: THE AGENCY FRISCO $849,000Active4 beds 3 baths2,953 sq. ft.
2004 Rana Drive, Cresson, TX 76035
MLS# 21159140Listed by: COMPASS RE TEXAS, LLC. $179,000Active2.07 Acres
3001 Rio Grande Circle, Cresson, TX 76035
MLS# 21152736Listed by: GRANBURY REALTY, LLC $279,900Pending3 beds 2 baths1,379 sq. ft.
13429 Hang Fire Lane, Cresson, TX 76035
MLS# 21201148Listed by: LGI HOMES $239,990Pending4 beds 3 baths2,203 sq. ft.
13364 Broom Tail Court, Cresson, TX 76035
MLS# 21095432Listed by: HOMESUSA.COM $252,990Active5 beds 3 baths2,600 sq. ft.
13360 Broom Tail Court, Cresson, TX 76035
MLS# 21095433Listed by: HOMESUSA.COM $239,990Pending4 beds 3 baths2,203 sq. ft.
13365 Broom Tail Court, Cresson, TX 76035
MLS# 21095460Listed by: HOMESUSA.COM $1,200,000Active3 beds 4 baths2,967 sq. ft.
117 Citation Drive, Cresson, TX 76035
MLS# 21091389Listed by: THE PRICHARD GROUP $824,900Active4 beds 3 baths2,990 sq. ft.
2136 Cotton Tail Way, Cresson, TX 76035
MLS# 21076624Listed by: KELLER WILLIAMS BRAZOS WEST $199,000Pending2.68 Acres
2025 Cotton Tail Way, Granbury, TX 76035
MLS# 21061271Listed by: EXP REALTY, LLC $172,000Pending2.02 Acres
2031 Cotton Tail Way, Cresson, TX 76035
MLS# 21061753Listed by: EXP REALTY, LLC $479,000Active3 beds 2 baths1,503 sq. ft.
8116 Clearview Court, Cresson, TX 76035
MLS# 21056373Listed by: READY REAL ESTATE LLC $45,000Active0.25 Acres
4618 Aberdeen Drive, Cresson, TX 76035
MLS# 21047711Listed by: BETTER HOMES & GARDENS, WINANS $998,000Active66.77 Acres
TBD Hwy 171, Cresson, TX 76035
MLS# 21048688Listed by: LEAGUE REAL ESTATE- New
 $232,000Active2.02 Acres
301 Elliott Court, Cresson, TX 76035
MLS# 21215896Listed by: EXP REALTY LLC - New
 $232,000Active2.01 Acres
400 Conway Cove, Cresson, TX 76035
MLS# 21215906Listed by: EXP REALTY LLC  $289,900Active3 beds 2 baths1,379 sq. ft.
13420 Gitty Up Circle, Cresson, TX 76035
MLS# 21201263Listed by: LGI HOMES $289,900Active3 beds 2 baths1,379 sq. ft.
13413 Gitty Up Circle, Cresson, TX 76035
MLS# 21201162Listed by: LGI HOMES $304,900Pending3 beds 2 baths1,658 sq. ft.
13404 Gitty Up Circle, Cresson, TX 76035
MLS# 21142818Listed by: LGI HOMES $199,900Active2.07 Acres
3266 Rio Grande Circle, Cresson, TX 76035
MLS# 20636101Listed by: BRIGGS FREEMAN SOTHEBY'S INT'L
Local realty services provided by:CENTURY 21 Elite
Information provided, in part, by North Texas Real Estate Information Systems, Inc. Last Updated March 26, 2026 Listings with the NTREIS logo are listed by brokerages other than CENTURY 21 Elite.
Neighborhoods near Cresson, TX
Zip codes near Cresson, TX
- 76008 homes for sale
- 76028 homes for sale
- 76033 homes for sale
- 76035 homes for sale
- 76036 homes for sale
- 76044 homes for sale
- 76048 homes for sale
- 76049 homes for sale
- 76058 homes for sale
- 76059 homes for sale
- 76087 homes for sale
- 76108 homes for sale
- 76109 homes for sale
- 76115 homes for sale
- 76116 homes for sale
- 76123 homes for sale
- 76126 homes for sale
- 76132 homes for sale
- 76133 homes for sale
- 76134 homes for sale
Popular searches near Cresson, TX
- Aledo homes for sale
- Annetta homes for sale
- Annetta North homes for sale
- Annetta South homes for sale
- Benbrook homes for sale
- Burleson homes for sale
- Burleson-Joshua homes for sale
- Canyon Creek homes for sale
- Cresson homes for sale
- Crowley homes for sale
- Decordova homes for sale
- Godley homes for sale
- Granbury homes for sale
- Granbury East homes for sale
- Joshua homes for sale
- Oak Trail Shores homes for sale
- Pecan Plantation homes for sale
- Stockton Bend homes for sale
- Weatherford Southeast homes for sale
- Western Lake homes for sale
Protect your home and budget from life's surprises with an Assurant Home Warranty, backed by a partner that supports you through every step of homeownership. Explore Plans.
©2026 Century 21 Real Estate LLC. All rights reserved. CENTURY 21®, the CENTURY 21 Logo and C21® are service marks owned by Century 21 Real Estate LLC. Century 21 Real Estate LLC fully supports the principles of the Fair Housing Act and the Equal Opportunity Act. Each office is independently owned and operated. Listing information is deemed reliable but not guaranteed accurate.