- Attleboro homes for sale
- Bellingham town homes for sale
- Blackstone homes for sale
- Central Falls homes for sale
- Cumberland homes for sale
- Cumberland Hill homes for sale
- Greenville homes for sale
- Lincoln homes for sale
- Manville homes for sale
- North Attleboro homes for sale
- North Attleborough Town homes for sale
- North Providence homes for sale
- North Smithfield homes for sale
- Pawtucket homes for sale
- Plainville homes for sale
- Rumford homes for sale
- Smithfield homes for sale
- Valley Falls homes for sale
- Woonsocket homes for sale
- Wrentham homes for sale
02864, RI - homes for sale
80 of 80 results displayed
- New
 $649,000Active8 beds 5 baths3,690 sq. ft.
88 Mill Street, Cumberland, RI 02864
MLS# 1408751Listed by: NORTHEAST REALTY ASSSOCIATES
- New
 $1,150,000Active4 beds 4 baths3,290 sq. ft.
14 Longbrook Dr, Cumberland, RI 02864
MLS# 73493331Listed by: HomeSmart Professionals Real Estate - New
 $529,777Active3 beds 2 baths1,576 sq. ft.
39 Streamview Drive #39, Cumberland, RI 02864
MLS# 1408527Listed by: CENTURY 21 TOPSAIL REALTY - New
 $650,000Active3 beds 3 baths2,176 sq. ft.
141 Leigh Road, Cumberland, RI 02864
MLS# 1408281Listed by: RESIDENTIAL PROPERTIES LTD. - New
 $858,000Active3 beds 3 baths3,097 sq. ft.
74 Hillside Road, Cumberland, RI 02864
MLS# 1408426Listed by: REAL BROKER, LLC - New
 $479,000Active3 beds 1 baths1,790 sq. ft.
81 Orchard Drive, Cumberland, RI 02864
MLS# 1407114Listed by: KELLER WILLIAMS LEADING EDGE - New
 $539,000Active4 beds 2 baths1,600 sq. ft.
94 Kay Street, Cumberland, RI 02864
MLS# 1408329Listed by: COMPASS  $825,000Pending4 beds 3 baths3,416 sq. ft.
33 Old Meadow Lane, Cumberland, RI 02864
MLS# 1408274Listed by: RE/MAX PROFESSIONALS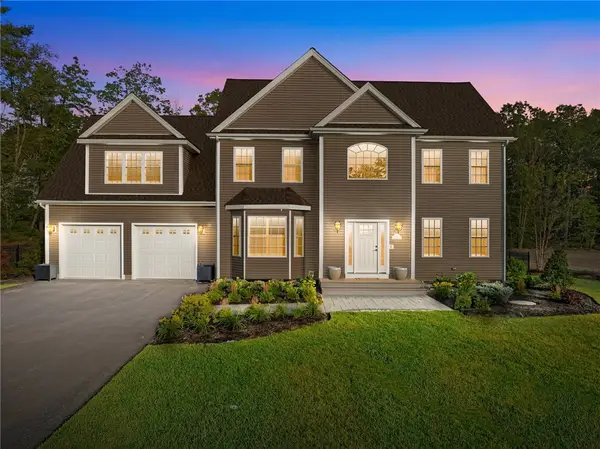 $1,299,900Pending4 beds 3 baths3,640 sq. ft.
3 Kelsey Eden Way, Cumberland, RI 02864
MLS# 1407104Listed by: BHHS PINNACLE REALTY- New
 $525,000Active3 beds 2 baths2,190 sq. ft.
40 Forestdale Drive, Cumberland, RI 02864
MLS# 1407030Listed by: KELLER WILLIAMS REALTY - New
 $649,900Active3 beds 3 baths2,361 sq. ft.
3 Lise Drive, Cumberland, RI 02864
MLS# 1407048Listed by: RE/MAX TOWN & COUNTRY - Open Sat, 11am to 12:30pm
 $659,000Active3 beds 2 baths2,172 sq. ft.
14 Metcalf Drive, Cumberland, RI 02864
MLS# 1406534Listed by: MOTT & CHACE SOTHEBY'S INTL.  $799,900Active5 beds 4 baths3,056 sq. ft.
136 Roland Street, Cumberland, RI 02864
MLS# 1406641Listed by: REMAX REVOLUTION $699,900Active3 beds 4 baths2,170 sq. ft.
1551 Diamond Hill Road, Cumberland, RI 02864
MLS# 1406735Listed by: J. CHRISTOPHER REAL ESTATE GRP $414,900Active2 beds 1 baths1,243 sq. ft.
202 Marshall Avenue, Cumberland, RI 02864
MLS# 1406710Listed by: REMAX REVOLUTION $524,900Active3 beds 1 baths1,608 sq. ft.
27 Linwood Road, Cumberland, RI 02864
MLS# 1406574Listed by: EDGE REALTY RI $369,900Active3 beds 2 baths1,078 sq. ft.
44 Eddy Street, Cumberland, RI 02864
MLS# 1406531Listed by: RE/MAX REAL ESTATE CENTER $375,000Pending3 beds 2 baths1,568 sq. ft.
60 Highland Avenue, Cumberland, RI 02864
MLS# 1406512Listed by: RE/MAX PROPERTIES $650,000Pending6 beds 3 baths5,331 sq. ft.
22 Eli Street, Cumberland, RI 02864
MLS# 1405336Listed by: CUSTODIO REALTORS- Open Thu, 6 to 7pm
 $899,900Active4 beds 4 baths2,433 sq. ft.
15 Bourque Road, Cumberland, RI 02864
MLS# 1405581Listed by: COLDWELL BANKER REALTY  $795,000Active6 beds 5 baths3,828 sq. ft.
407-409 Broad St, Cumberland, RI 02864
MLS# 73485639Listed by: Century 21 Mario Real Estate $734,900Active4 beds 3 baths3,850 sq. ft.
6 New Clark Road, Cumberland, RI 02864
MLS# 1406074Listed by: EXP REALTY $385,000Active3 beds 1 baths1,308 sq. ft.
71 Branch Avenue, Cumberland, RI 02864
MLS# 1406193Listed by: KELLER WILLIAMS COASTAL $199,900Active0.14 Acres
311 High Street, Cumberland, RI 02864
MLS# 1406178Listed by: RE/MAX REVOLUTION $475,000Active2 beds 3 baths2,010 sq. ft.
2970 Mendon Road #149, Cumberland, RI 02864
MLS# 1406087Listed by: SPITZ-WEISS, REALTORS $499,000Pending3 beds 1 baths1,136 sq. ft.
26 Country Hill Road, Cumberland, RI 02864
MLS# 1405877Listed by: COMPASS $799,900Pending4 beds 4 baths3,597 sq. ft.
15 Susan Drive, Cumberland, RI 02864
MLS# 1405855Listed by: COLDWELL BANKER REALTY $359,900Pending8 beds 3 baths2,896 sq. ft.
15 E Earle Street, Cumberland, RI 02864
MLS# 1405589Listed by: KELLER WILLIAMS REALTY $590,000Active2 beds 2 baths1,893 sq. ft.
500 Mendon Road #320, Cumberland, RI 02864
MLS# 1405528Listed by: COLDWELL BANKER REALTY $660,000Pending4 beds 3 baths2,312 sq. ft.
6 Wyoming Drive Drive, Cumberland, RI 02864
MLS# 1405417Listed by: KELLER WILLIAMS REALTY $549,000Pending3 beds 2 baths1,652 sq. ft.
789 High Street, Cumberland, RI 02864
MLS# 1404851Listed by: COMPASS $1,100,000Pending4 beds 4 baths3,108 sq. ft.
47 Austin Drive, Cumberland, RI 02864
MLS# 1404821Listed by: STONE & VALE $625,000Pending6 beds 3 baths2,962 sq. ft.
54 Sulyma Street, Cumberland, RI 02864
MLS# 1404673Listed by: MEDIA REALTY LLC $549,999Pending6 beds 2 baths3,200 sq. ft.
33 Kent Street, Cumberland, RI 02864
MLS# 1405022Listed by: CENTURY 21 GONSALVES - PASTORE $505,000Pending2 beds 3 baths2,010 sq. ft.
2970 Mendon Road #187, Cumberland, RI 02864
MLS# 1404354Listed by: RE/MAX TOWN & COUNTRY $499,900Pending4 beds 2 baths2,800 sq. ft.
48 Nate Whipple Highway, Cumberland, RI 02864
MLS# 1404601Listed by: COMPASS $300,000Pending2 beds 2 baths1,184 sq. ft.
40 Heroux Boulevard, Cumberland, RI 02864
MLS# 1404708Listed by: CENTURY 21 LIMITLESS $265,000Pending2 beds 1 baths918 sq. ft.
200 Manville Hill Unit 41 Bldg B Road #41, Cumberland, RI 02864
MLS# 1404494Listed by: RE/MAX TOWN & COUNTRY $675,000Pending4 beds 3 baths4,024 sq. ft.
1 Barway Lane, Cumberland, RI 02864
MLS# 1404439Listed by: EXP REALTY $645,000Active4 beds 4 baths3,564 sq. ft.
20 Mount Pleasant View Avenue, Cumberland, RI 02864
MLS# 1404436Listed by: KELLER WILLIAMS LEADING EDGE $370,000Pending3 beds 1 baths1,878 sq. ft.
30 Bear Hill Road, Cumberland, RI 02864
MLS# 1404384Listed by: MY DREAM HOME REALTY $639,900Active8 beds 3 baths3,462 sq. ft.
3 Barrett Street, Cumberland, RI 02864
MLS# 1404195Listed by: NOEL REALTY COMPANY $415,000Pending2 beds 2 baths1,794 sq. ft.
154 Bear Hill Road #401, Cumberland, RI 02864
MLS# 1404107Listed by: RE/MAX TOWN & COUNTRY $449,000Pending4 beds 1 baths1,363 sq. ft.
50 Blackstone Street, Cumberland, RI 02864
MLS# 1403961Listed by: EXP REALTY $580,000Pending6 beds 2 baths2,512 sq. ft.
36 Dexter Street, Cumberland, RI 02864
MLS# 1404044Listed by: REAL BROKER, LLC $225,000Pending1 beds 1 baths532 sq. ft.
51 Pequot Avenue, Cumberland, RI 02864
MLS# 1403644Listed by: RE/MAX TOWN & COUNTRY $595,000Active2 beds 3 baths1,582 sq. ft.
43 Massachusetts Avenue, Cumberland, RI 02864
MLS# 1403492Listed by: ENGEL & VOLKERS OCEANSIDE $675,000Active6 beds 3 baths4,206 sq. ft.
97 Angell Road, Cumberland, RI 02864
MLS# 1403536Listed by: KELLER WILLIAMS LEADING EDGE $799,900Active3 beds 3 baths2,160 sq. ft.
172 Pine Swamp Road, Cumberland, RI 02864
MLS# 1406441Listed by: KELLER WILLIAMS LEADING EDGE $535,000Pending3 beds 1 baths2,000 sq. ft.
45 Valley View Drive, Cumberland, RI 02864
MLS# 1402816Listed by: COMPASS $589,900Pending3 beds 3 baths1,774 sq. ft.
25 Prospect Street, Cumberland, RI 02864
MLS# 1399725Listed by: BOUCHER REAL ESTATE $589,900Pending3 beds 3 baths1,774 sq. ft.
27 Prospect Street, Cumberland, RI 02864
MLS# 1399728Listed by: BOUCHER REAL ESTATE $439,900Active2 beds 2 baths1,588 sq. ft.
31 Prospect Street #1, Cumberland, RI 02864
MLS# 1399742Listed by: BOUCHER REAL ESTATE $439,900Active2 beds 2 baths1,588 sq. ft.
29 Prospect Street #2, Cumberland, RI 02864
MLS# 1399743Listed by: BOUCHER REAL ESTATE $1,799,000Active4 beds 5 baths4,226 sq. ft.
365 West Wrentham Road, Cumberland, RI 02864
MLS# 1402395Listed by: LILA DELMAN COMPASS $649,900Active3 beds 3 baths2,005 sq. ft.
18 Narragansett Road, Cumberland, RI 02864
MLS# 1402202Listed by: OAKMONT REALTY GROUP $199,900Active0.11 Acres
24 Narragansett Road, Cumberland, RI 02864
MLS# 1402203Listed by: OAKMONT REALTY GROUP $40,000Active0.11 Acres
150 Leigh Road, Cumberland, RI 02864
MLS# 1401366Listed by: RE/MAX REVOLUTION $325,000Active3 beds 1 baths1,080 sq. ft.
27 Norman Street, Cumberland, RI 02864
MLS# 1401304Listed by: RE/MAX TOWN & COUNTRY $1,250,000Active4 beds 3 baths3,321 sq. ft.
164 Scott Road, Cumberland, RI 02864
MLS# 1406844Listed by: KELLER WILLIAMS LEADING EDGE $550,000Active2 beds 2 baths1,755 sq. ft.
11 Woodside Avenue, Cumberland, RI 02864
MLS# 1404833Listed by: KELLER WILLIAMS LEADING EDGE $150,000Active0.49 Acres
63 Carpenter Street, Cumberland, RI 02864
MLS# 1400215Listed by: COLDWELL BANKER REALTY $39,000Active0.11 Acres
0 Narragansett Road, Cumberland, RI 02864
MLS# 1399619Listed by: KELLER WILLIAMS COASTAL $515,000Pending3 beds 2 baths1,620 sq. ft.
98 Iroquois Road, Cumberland, RI 02864
MLS# 1401986Listed by: RESIDENTIAL PROPERTIES LTD. $125,900Active6.66 Acres
180 Pine Swamp Road, Cumberland, RI 02864
MLS# 1397683Listed by: SIRY REALTY $649,900Active2 beds 3 baths2,270 sq. ft.
1504 Hunting Hill Drive, Cumberland, RI 02864
MLS# 1397443Listed by: ENGEL & VOLKERS OCEANSIDE $639,900Active2 beds 3 baths2,270 sq. ft.
1503 Hunting Hill Drive, Cumberland, RI 02864
MLS# 1397444Listed by: ENGEL & VOLKERS OCEANSIDE $679,900Pending3 beds 4 baths2,170 sq. ft.
1551 Diamond Hill Road, Cumberland, RI 02864
MLS# 1397450Listed by: J. CHRISTOPHER REAL ESTATE GRP $1,985,000Pending7 beds 12 baths14,060 sq. ft.
3070 Diamond Hill Road, Cumberland, RI 02864
MLS# 1402786Listed by: SERHANT RHODE ISLAND $650,000Active4 beds 3 baths3,576 sq. ft.
1251 Mendon Road, Cumberland, RI 02864
MLS# 1397083Listed by: CENTURY 21 LIMITLESS $285,000Active2 beds 1 baths944 sq. ft.
163 Woodside Avenue, Cumberland, RI 02864
MLS# 1404595Listed by: RI REAL ESTATE SERVICES $629,000Pending8 beds 3 baths3,304 sq. ft.
3889 Mendond Road, Cumberland, RI 02864
MLS# 1402150Listed by: REAL BROKER, LLC $205,000Pending0.11 Acres
15 Standring Street, Cumberland, RI 02864
MLS# 1392312Listed by: RE/MAX REAL ESTATE CENTER $649,900Active2 beds 3 baths2,270 sq. ft.
1501 Hunting Hill Drive, Cumberland, RI 02864
MLS# 1398942Listed by: ENGEL & VOLKERS OCEANSIDE $639,900Active2 beds 3 baths2,270 sq. ft.
1502 Hunting Hill Drive, Cumberland, RI 02864
MLS# 1401810Listed by: ENGEL & VOLKERS OCEANSIDE $320,000Active3 beds 1 baths912 sq. ft.
3 Quail Street, Cumberland, RI 02864
MLS# 1399025Listed by: QUINSIGAMOND REALTY $599,900Pending2 beds 3 baths2,270 sq. ft.
1302 Hunting Hill Drive, Cumberland, RI 02864
MLS# 1351292Listed by: OWNERENTRY.COM $349,900Pending3 beds 2 baths1,766 sq. ft.
200 Old Mendon Road, Cumberland, RI 02864
MLS# 1333056Listed by: KELLER WILLIAMS REALTY $200,000Pending1.84 Acres
4 Carnation Street, Cumberland, RI 02864
MLS# 1320173Listed by: KELLER WILLIAMS LEADING EDGE $100,000Pending0.27 Acres
27 Oxford Road, Cumberland, RI 02864
MLS# 1327981Listed by: RE/MAX PROPERTIES
Local realty services provided by:CENTURY 21 Signature Properties, CENTURY 21 Professionals
The data relating to real estate for sale on this web site comes in part from the IDX Program of the State-Wide Multiple Listing Service, Inc. Real estate listings held by brokerage firms other than CENTURY 21 Signature Properties are marked with the MLS logo and detailed information about them includes the name of the listing brokers. Information deemed reliable but not guaranteed. Copyright 2026 State-Wide MLS, Inc. All rights reserved. Date Last Update: March 19, 2026
Popular searches near 02864
Popular neighborhoods near 02864
- Blackstone, Providence homes for sale
- Charles, Providence homes for sale
- College Hill, Providence homes for sale
- Darlington, Pawtucket homes for sale
- Downtown Pawtucket, Pawtucket homes for sale
- East Side, Providence homes for sale
- Elmhurst, Providence homes for sale
- Fairlawn, Pawtucket homes for sale
- Hope, Providence homes for sale
- Mount Hope, Providence homes for sale
- Mount Pleasant, Providence homes for sale
- Oak Hill, Pawtucket homes for sale
- Pine Crest, Pawtucket homes for sale
- Pleasant View, Pawtucket homes for sale
- Quality Hill, Pawtucket homes for sale
- Smith Hill, Providence homes for sale
- Valley, Providence homes for sale
- Wanskuck, Providence homes for sale
- Wayland, Providence homes for sale
- Woodlawn, Pawtucket homes for sale
Counties near Cumberland, 02864
- Barnstable County homes for sale
- Bristol County homes for sale
- Bristol County homes for sale
- Capitol County homes for sale
- Dukes County homes for sale
- Essex County homes for sale
- Kent County homes for sale
- Middlesex County homes for sale
- New London County homes for sale
- Newport County homes for sale
- Norfolk County homes for sale
- Northeastern Connecticut County homes for sale
- Plymouth County homes for sale
- Providence County homes for sale
- Southeastern Connecticut County homes for sale
- Suffolk County homes for sale
- Tolland County homes for sale
- Washington County homes for sale
- Windham County homes for sale
- Worcester County homes for sale
Protect your home and budget from life's surprises with an Assurant Home Warranty, backed by a partner that supports you through every step of homeownership. Explore Plans.
©2026 Century 21 Real Estate LLC. All rights reserved. CENTURY 21®, the CENTURY 21 Logo and C21® are service marks owned by Century 21 Real Estate LLC. Century 21 Real Estate LLC fully supports the principles of the Fair Housing Act and the Equal Opportunity Act. Each office is independently owned and operated. Listing information is deemed reliable but not guaranteed accurate.