- Azalea District, Tyler homes for sale
- Brick Streets District, Tyler homes for sale
- Bullard Place, Tyler homes for sale
- Butler College, Tyler homes for sale
- Cambridge, Tyler homes for sale
- Cascades, Tyler homes for sale
- Charnwood District, Tyler homes for sale
- Connally Heights, Tyler homes for sale
- Cumberland Ridge, Bullard homes for sale
- Downtown Tyler, Tyler homes for sale
- Eagle's Bluff, Bullard homes for sale
- East Side, Tyler homes for sale
- Emerald Bay, Bullard homes for sale
- Hollytree, Tyler homes for sale
- Lakeway Harbor, Flint homes for sale
- Pecan Valley Ranch, Bullard homes for sale
- The Cumberland Estates, Tyler homes for sale
- The Highlands, Tyler homes for sale
- The Villages, Flint homes for sale
- The Woods, Tyler homes for sale
Cuney, TX - homes for sale
4 of 4 results displayed
- New
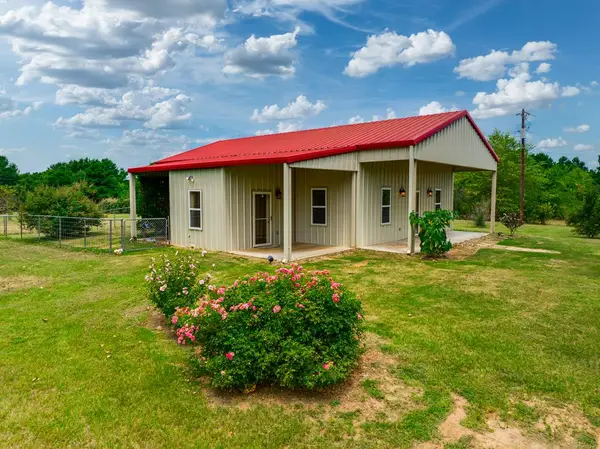 $280,000Active2 beds 2 baths1,295 sq. ft.
531 Cr 3501, Cuney, TX 75759
MLS# 112568Listed by: RE/MAX BENCHMARK  $18,500Active0.78 Acres
Lot 4 CR 3502, Cuney, TX 75759
MLS# 25014830Listed by: EBBY HALLIDAY, REALTORS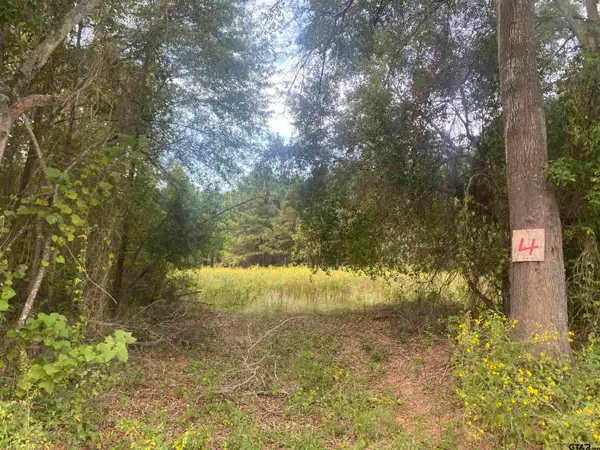 $18,500Active1 Acres
lot 2 CR 3526, Cuney, TX 75759
MLS# 25014828Listed by: EBBY HALLIDAY, REALTORS $18,500Active0.78 Acres
lot 3 CR 3502, Cuney, TX 75759
MLS# 25014829Listed by: EBBY HALLIDAY, REALTORS
Local realty services provided by:CENTURY 21 Judge Fite Company
Neighborhoods near Cuney, TX
Zip codes near Cuney, TX
- 75701 homes for sale
- 75702 homes for sale
- 75703 homes for sale
- 75707 homes for sale
- 75709 homes for sale
- 75752 homes for sale
- 75756 homes for sale
- 75757 homes for sale
- 75758 homes for sale
- 75759 homes for sale
- 75762 homes for sale
- 75763 homes for sale
- 75766 homes for sale
- 75770 homes for sale
- 75785 homes for sale
- 75789 homes for sale
- 75791 homes for sale
- 75801 homes for sale
- 75803 homes for sale
- 75853 homes for sale
Popular searches near Cuney, TX
- Berryville homes for sale
- Bullard homes for sale
- Bullard homes for sale
- Chandler homes for sale
- Chandler-Brownsboro homes for sale
- Coffee City homes for sale
- Emerald Bay homes for sale
- Flint homes for sale
- Frankston homes for sale
- Jacksonville homes for sale
- Larue homes for sale
- LaRue-Poynor homes for sale
- Mt Selman homes for sale
- Neches homes for sale
- Noonday homes for sale
- Shadybrook homes for sale
- Sunrise Shores homes for sale
- Troup homes for sale
- Troup homes for sale
- Whitehouse homes for sale
Protect your home and budget from life's surprises with an Assurant Home Warranty, backed by a partner that supports you through every step of homeownership. Explore Plans.
©2026 Century 21 Real Estate LLC. All rights reserved. CENTURY 21®, the CENTURY 21 Logo and C21® are service marks owned by Century 21 Real Estate LLC. Century 21 Real Estate LLC fully supports the principles of the Fair Housing Act and the Equal Opportunity Act. Each office is independently owned and operated. Listing information is deemed reliable but not guaranteed accurate.