- Autumn Woods, Palm Harbor homes for sale
- Baywood Village, Palm Harbor homes for sale
- Beacon Groves, Palm Harbor homes for sale
- Bentley Park, Palm Harbor homes for sale
- Citizens Alliance For Progress, Tarpon Springs homes for sale
- Cobbs Landing, Palm Harbor homes for sale
- Cove Springs, Palm Harbor homes for sale
- Dove Hollow, Palm Harbor homes for sale
- Eniswood, Palm Harbor homes for sale
- Fox Chase, Palm Harbor homes for sale
- Gleneagles, Palm Harbor homes for sale
- Grassy Pointe, Tarpon Springs homes for sale
- Innisbrook, Palm Harbor homes for sale
- Lake Shores Estates, Palm Harbor homes for sale
- Lake Tarpon Community, Tarpon Springs homes for sale
- Lansbrook, Palm Harbor homes for sale
- Rolling Oaks, Tarpon Springs homes for sale
- Tarpon Shores, Tarpon Springs homes for sale
- Tarpon Springs Historic District, Tarpon Springs homes for sale
- Woods At Anderson Park, Tarpon Springs homes for sale
Cypress Pointe, Palm Harbor, FL - homes for sale
12 of 12 results displayed
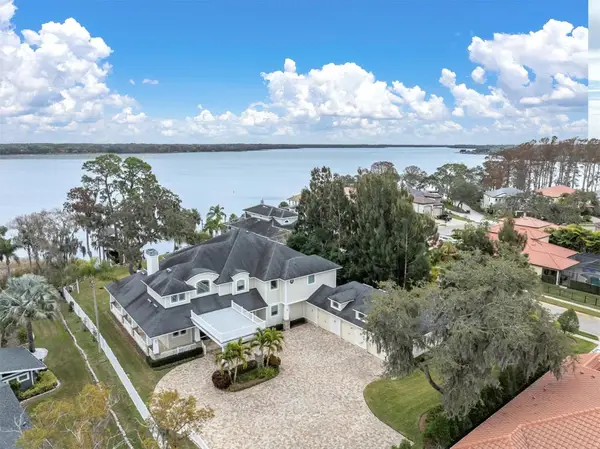 $5,200,000Active4 beds 7 baths7,836 sq. ft.
4650 Ridge View Road, PALM HARBOR, FL 34684
MLS# TB8482036Listed by: RE/MAX REALTEC GROUP INC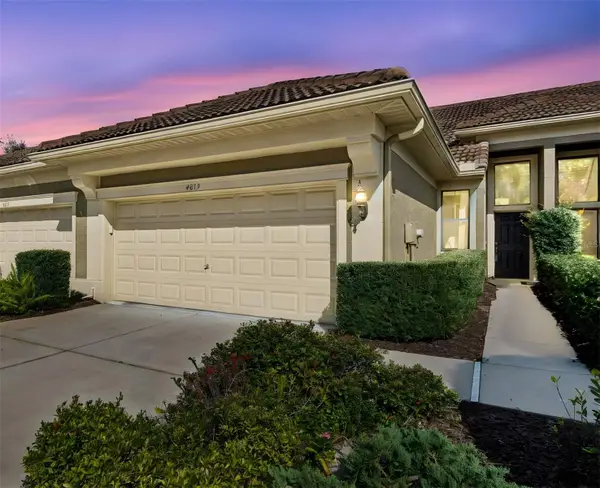 $350,000Pending2 beds 2 baths1,234 sq. ft.
4813 Michelle Lane, PALM HARBOR, FL 34684
MLS# TB8482198Listed by: FUTURE HOME REALTY INC $1,200,000Active5 beds 4 baths3,733 sq. ft.
2630 Grand Lakeside Drive, PALM HARBOR, FL 34684
MLS# TB8480712Listed by: SMITH & ASSOCIATES REAL ESTATE $429,900Active3 beds 3 baths2,215 sq. ft.
4739 Silverking Way, PALM HARBOR, FL 34684
MLS# TB8465180Listed by: COLDWELL BANKER REALTY $434,000Active3 beds 4 baths2,215 sq. ft.
2524 Tranquility Drive, PALM HARBOR, FL 34684
MLS# TB8448686Listed by: DALTON WADE INC $919,000Active4 beds 3 baths2,463 sq. ft.
2550 Grand Lakeside Drive, PALM HARBOR, FL 34684
MLS# TB8447126Listed by: CHARLES RUTENBERG REALTY INC $509,900Active3 beds 3 baths2,250 sq. ft.
2539 Silverback Court, PALM HARBOR, FL 34684
MLS# TB8440591Listed by: HOMEFRONT REALTY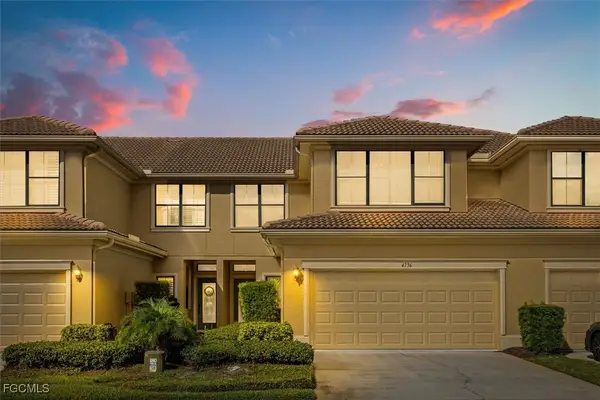 $399,000Active3 beds 3 baths2,215 sq. ft.
4736 Swordfish Way, Palm Harbor, FL 34684
MLS# 2025012220Listed by: HOOK & LADDER REALTY OF CENTRAL FLORIDA LLC $499,900Active3 beds 3 baths2,250 sq. ft.
2567 Gloriosa Drive, PALM HARBOR, FL 34684
MLS# TB8473040Listed by: PARADISE LIFE REALTY $470,900Pending3 beds 3 baths2,046 sq. ft.
4717 Osprey Ridge Circle, PALM HARBOR, FL 34684
MLS# TB8386291Listed by: FUTURE HOME REALTY INC $972,000Active5 beds 4 baths3,358 sq. ft.
4611 Grand Preserve Place, PALM HARBOR, FL 34684
MLS# TB8386100Listed by: KELLER WILLIAMS ST PETE REALTY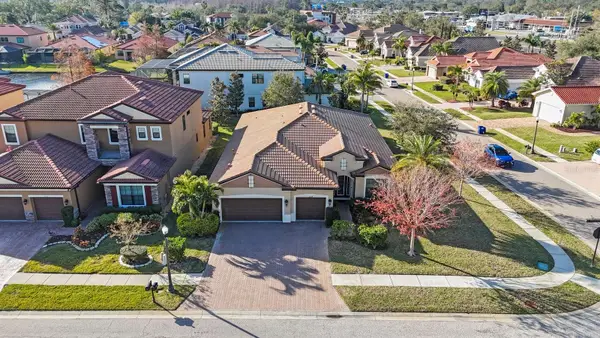 $699,900Active3 beds 3 baths2,755 sq. ft.
2564 Grand Cypress Boulevard, PALM HARBOR, FL 34684
MLS# TB8343321Listed by: RE/MAX REALTEC GROUP INC
Local realty services provided by:CENTURY 21 Affiliates, CENTURY 21 AllPoints Realty
The information being provided by Stellar Mls is for the consumer's personal, non-commercial use and may not be used for any purpose other than to identify prospective properties consumer may be interested in purchasing. Any information relating to real estate for sale referenced on this web site comes from the Internet Data Exchange (IDX) program of the Stellar Mls. CENTURY 21 Affiliates is not a Multiple Listing Service (MLS), nor does it offer MLS access. This website is a service of CENTURY 21 Affiliates, a broker participant of Stellar Mls. This web site may reference real estate listing(s) held by a brokerage firm other than the broker and/or agent who owns this web site.
The accuracy of all information, regardless of source, including but not limited to open house information, square footages and lot sizes, is deemed reliable but not guaranteed and should be personally verified through personal inspection by and/or with the appropriate professionals. The data contained herein is copyrighted by Stellar Mls and is protected by all applicable copyright laws. Any unauthorized dissemination of this information is in violation of copyright laws and is strictly prohibited.
Properties in listings may have been sold or may no longer be available.
Copyright 2026 Stellar Mls. All rights reserved.
Popular neighborhoods near Cypress Pointe, Palm Harbor, FL
Zip codes near Cypress Pointe, Palm Harbor, FL
- 33556 homes for sale
- 33626 homes for sale
- 33635 homes for sale
- 33761 homes for sale
- 33763 homes for sale
- 33767 homes for sale
- 34652 homes for sale
- 34653 homes for sale
- 34655 homes for sale
- 34677 homes for sale
- 34681 homes for sale
- 34683 homes for sale
- 34684 homes for sale
- 34685 homes for sale
- 34688 homes for sale
- 34689 homes for sale
- 34690 homes for sale
- 34691 homes for sale
- 34695 homes for sale
- 34698 homes for sale
Counties near Cypress Pointe, Palm Harbor, FL
- Charlotte County homes for sale
- Citrus County homes for sale
- DeSoto County homes for sale
- Hardee County homes for sale
- Hernando County homes for sale
- Hillsborough County homes for sale
- Lake County homes for sale
- Levy County homes for sale
- Manatee County homes for sale
- Marion County homes for sale
- Orange County homes for sale
- Osceola County homes for sale
- Pasco County homes for sale
- Pinellas County homes for sale
- Polk County homes for sale
- Sarasota County homes for sale
- Sumter County homes for sale
Protect your home and budget from life's surprises with an Assurant Home Warranty, backed by a partner that supports you through every step of homeownership. Explore Plans.
©2026 Century 21 Real Estate LLC. All rights reserved. CENTURY 21®, the CENTURY 21 Logo and C21® are service marks owned by Century 21 Real Estate LLC. Century 21 Real Estate LLC fully supports the principles of the Fair Housing Act and the Equal Opportunity Act. Each office is independently owned and operated. Listing information is deemed reliable but not guaranteed accurate.