- Bennettsville homes for sale
- Bethune homes for sale
- Bishopville homes for sale
- Cheraw homes for sale
- Chesterfield homes for sale
- Coward homes for sale
- Darlington homes for sale
- Effingham homes for sale
- Florence homes for sale
- Hartsville homes for sale
- Lake City homes for sale
- Lake Swamp homes for sale
- Lamar homes for sale
- Latta homes for sale
- Marion homes for sale
- Pamplico homes for sale
- Patrick homes for sale
- Quinby homes for sale
- Scranton homes for sale
- Timmonsville homes for sale
Darlington County, SC - homes for sale
15 of 15 results displayed
- New
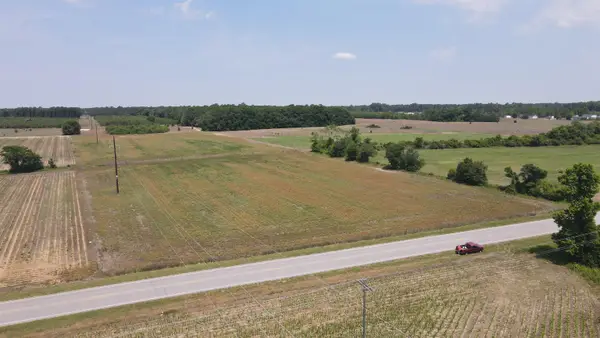 $145,000Active25.1 Acres
25.10 Acres - Society Hill Rd, Darlington, SC 29532
MLS# 2617523Listed by: TIDEWATER PROPERTIES 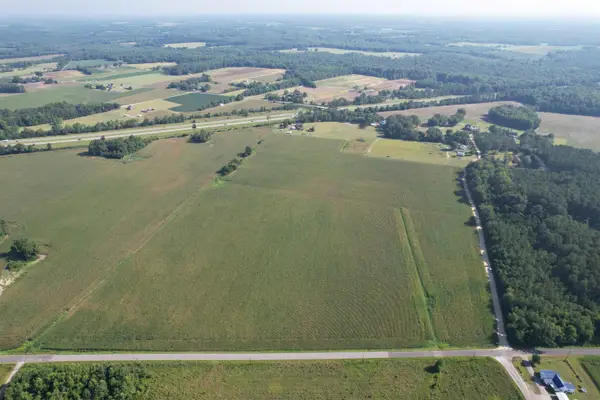 $164,000Pending24.36 Acres
24.36 Acres - Newman Swamp Rd, Lamar, SC 29069
MLS# 2617128Listed by: TIDEWATER PROPERTIES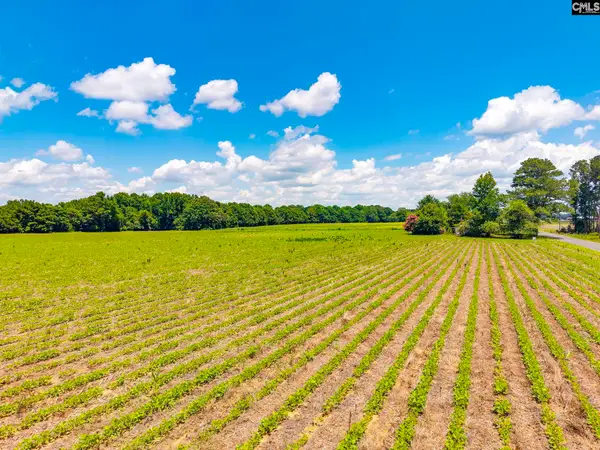 $185,000Pending30.6 Acres
420 Windhamtown Road, Lamar, SC 29069
MLS# 637878Listed by: HOME ADVANTAGE REALTY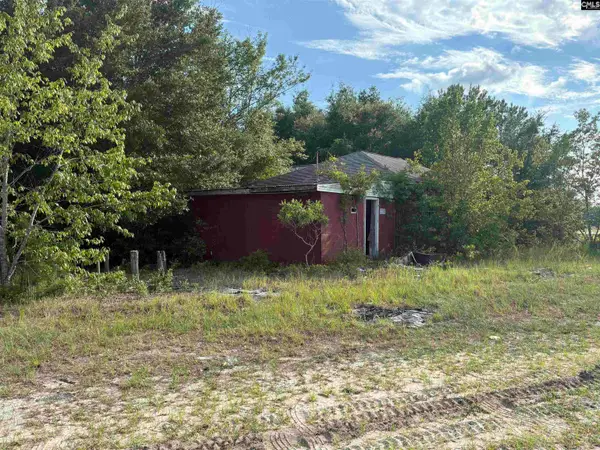 $75,000Active1.26 Acres
545 Flinns Road, Hartsville, SC 29550
MLS# 636589Listed by: COLDWELL BANKER REALTY $180,000Active13.33 Acres
0 Bethel, Hartsville, SC 29550
MLS# 635546Listed by: COLDWELL BANKER REALTY $34,900Pending4.3 Acres
415 Hawkins Road, Hartsville, SC 29550
MLS# 4375951Listed by: LEWIS REALTY $235,000Active39 Acres
0 0 East Old Camden Hwy, Darlington, SC 29550
MLS# 631387Listed by: PEACE SOTHEBY'S INTERNATIONAL REALTY $21,497Active2.6 Acres
0 Us Route 1 Highway #Lot 92, McBee, SC 29550
MLS# 4347525Listed by: CHOSEN REALTY OF NC LLC
 $39,000Pending2.22 Acres
2700 Persimmons Drive, Hartsville, SC 29550
MLS# 626598Listed by: CENTURY 21 VANGUARD $29,999Active1.87 Acres
0 Off Center Road #403, Timmonsville, SC 29161
MLS# 25030408Listed by: CAROLINA ONE REAL ESTATE- $20,000Active1.87 Acres
3929 Fieldmaster Drive, Timmonsville, SC 29161
MLS# 25030408Listed by: CAROLINA ONE REAL ESTATE  $89,000Pending19.6 Acres
19.6 Acres Case St., Darlington, SC 29532
MLS# 2513770Listed by: NORTHGROUP REAL ESTATE LLC $62,000Active3.14 Acres
0 Ruby Road, Hartsville, SC 29550
MLS# 4266159Listed by: EXP REALTY LLC ROCK HILL $140,000Pending21.91 Acres
TBD Gallowaytown Road, Hartsville, SC 29550
MLS# 606940Listed by: GUNTER & ASSOCIATES REALTY $12,000Active0.72 Acres
00 Greenleaf Road, Hartsville, SC 29550
MLS# 625877Listed by: SOUTHERN PROPERTIES REALTY
Local realty services provided by:CENTURY 21 Thomas Realty, Inc., CENTURY 21 803, CENTURY 21 First Choice Realty, CENTURY 21 Triangle Group
Provided courtesy of the Coastal Carolinas MLS. © 2026 of the Coastal Carolinas MLS. All rights reserved. Information is provided exclusively for consumers' personal, non-commercial use, and may not be used for any purpose other than to identify prospective properties consumers may be interested in purchasing. Data is deemed reliable but is not guaranteed accurate by the Coastal Carolinas MLS. SC_CCAR Member Broker: Harry Thomas
Last Updated: July 16, 2026 The data relating to real estate on this Web site derive in part from the Carolina Multiple Listing Services, Inc. IDX program. Brokers make an effort to deliver accurate information, but buyers should independently verify any information on which they will rely in a transaction. All properties are subject to prior sale, change or withdrawal. Neither CENTURY 21 803nor any listing broker shall be responsible for any typographical errors, misinformation, or misprints, and they shall be held totally harmless from any damages arising from reliance upon this data. This data is provided exclusively for consumers' personal, non-commercial use and may not be used for any purpose other than to identify prospective properties they may be interested in purchasing. Copyright 2026 Carolina Multiple Listing Services, Inc.
Listings courtesy of Canopy MLS as distributed by MLS GRID. Copyright 2021 Canopy MLS. All rights reserved. Canopy MLS, provides content displayed here (“provided content”) on an “as is” basis and makes no representations or warranties regarding the provided content, including, but not limited to those of non-infringement, timeliness, accuracy, or completeness. Individuals and companies using information presented are responsible for verification and validation of information they utilize and present to their customers and clients. Canopy MLS will not be liable for any damage or loss resulting from use of the provided content or the products available through Portals, IDX, VOW, and/or Syndication. Recipients of this information shall not resell, redistribute, reproduce, modify, or otherwise copy any portion thereof without the expressed written consent of Canopy MLS.
Copyright 2026 Charleston Trident MLS. Information is being provided is for consumers' personal, non-commercial use and may not be used for any purpose other than to identify prospective properties consumers may be interested in purchasing. Information deemed reliable but not guaranteed.
Popular searches near Darlington County, SC
Popular neighborhoods near Darlington County, SC
- Ashcroft, Columbia homes for sale
- Candlewood, Columbia homes for sale
- Carriage Oaks, Columbia homes for sale
- Catawba Hill, Pontiac homes for sale
- Crickentree, Blythewood homes for sale
- Crossbridge, Pontiac homes for sale
- Fishers Wood, Columbia homes for sale
- Homes of Polo, Columbia homes for sale
- Lake Carolina, Columbia homes for sale
- Lake Pointe, Columbia homes for sale
- Liberty Ridge, Pontiac homes for sale
- Royal Pines Estates, Columbia homes for sale
- Summit Ridge, Columbia homes for sale
- The Falls, Blythewood homes for sale
- The Park, Pontiac homes for sale
- The Summit, Columbia homes for sale
- The Valley, Pontiac homes for sale
- Wildewood, Columbia homes for sale
- Winchester, Columbia homes for sale
- Woodcreek Farms, Pontiac homes for sale
Zip codes near Darlington County, SC
- 29009 homes for sale
- 29010 homes for sale
- 29069 homes for sale
- 29161 homes for sale
- 29501 homes for sale
- 29505 homes for sale
- 29506 homes for sale
- 29512 homes for sale
- 29520 homes for sale
- 29530 homes for sale
- 29532 homes for sale
- 29536 homes for sale
- 29541 homes for sale
- 29550 homes for sale
- 29565 homes for sale
- 29571 homes for sale
- 29583 homes for sale
- 29584 homes for sale
- 29591 homes for sale
- 29709 homes for sale
Protect your home and budget from life's surprises with an Assurant Home Warranty, backed by a partner that supports you through every step of homeownership. Explore Plans.
©2026 Century 21 Real Estate LLC. All rights reserved. CENTURY 21®, the CENTURY 21 Logo and C21® are service marks owned by Century 21 Real Estate LLC. Century 21 Real Estate LLC fully supports the principles of the Fair Housing Act and the Equal Opportunity Act. Each office is independently owned and operated. Listing information is deemed reliable but not guaranteed accurate.