- Boone homes for sale
- Conrad Hill homes for sale
- Cotton Grove homes for sale
- Denton homes for sale
- East Spencer homes for sale
- Emmons homes for sale
- Healing Spring homes for sale
- Lexington homes for sale
- Lexington township homes for sale
- Linwood homes for sale
- Providence homes for sale
- Reedy Creek homes for sale
- Silver Hill homes for sale
- Southmont homes for sale
- Spencer homes for sale
- Thomasville township homes for sale
- Thomasville homes for sale
- Tyro township homes for sale
- Tyro homes for sale
- Welcome homes for sale
Davidson County, NC - homes for sale
261 of 261 results displayed
- New
 $37,000Active-- Acres
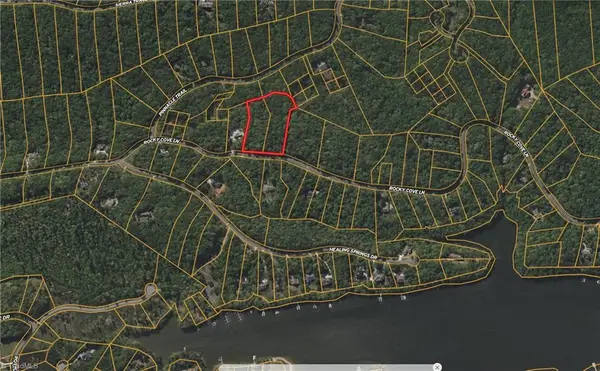
532 Rocky Cove Lane, Denton, NC 27239
MLS# 1214083Listed by: REAL BROKER LLC
- New
 $59,900Active-- Acres
2171 Sierra Trace Road, Denton, NC 27239
MLS# 1213200Listed by: CHARLES JONES REALTY, INC. - New
 $110,000Active-- Acres
0000 Tilden Nursery Road, Lexington, NC 27295
MLS# 1213869Listed by: UNITED COUNTRY CAROLINA PROPERTIES - New
 $112,500Active-- Acres
538 E Holly Grove Road, Lexington, NC 27292
MLS# 1213981Listed by: LEONARD CRAVER REALTY INC - New
 $35,000Active-- Acres
150 Kyle Smith Court, Winston-Salem, NC 27127
MLS# 1213484Listed by: HILLCREST REALTY GROUP - New
 $200,000Active-- Acres
337 Starboard Reach, Lexington, NC 27292
MLS# 1213809Listed by: COLDWELL BANKER REALTY BALLANTYNE - New
 $150,000Active-- Acres
0 Cunningham Road, Thomasville, NC 27360
MLS# 1213715Listed by: ALLRED & COMPANY, REALTORS - New
 $30,000Active0.37 Acres
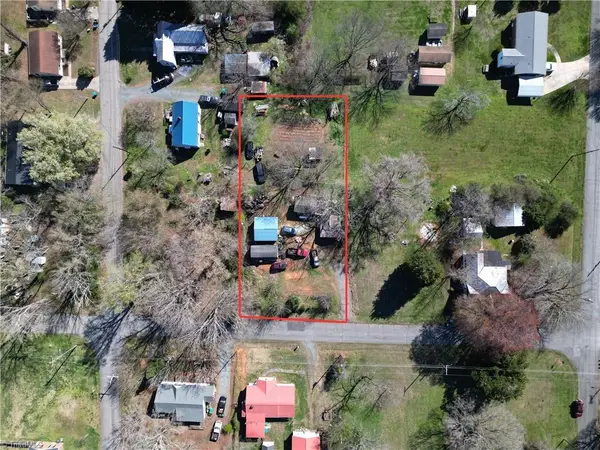
411 Poplar Drive, Lexington, NC 27292
MLS# 10155337Listed by: NORTHGROUP REAL ESTATE, INC. - New
 $45,000Active-- Acres
3623 Greystone Drive, Winston-Salem, NC 27107
MLS# 1213582Listed by: COLDWELL BANKER ADVANTAGE - New
 $70,000Active-- Acres
2893 Saint Giles Court, High Point, NC 27262
MLS# 1212169Listed by: PRICE REALTORS - ARCHDALE - New
 $59,900Active1.7 Acres
2243 Sierra Trace Road, Denton, NC 27239
MLS# 4361249Listed by: CHARLES JONES REALTY INC - New
 $39,900Active1.55 Acres
863 Sierra Trace Road, Denton, NC 27239
MLS# 4361219Listed by: CHARLES JONES REALTY INC - New
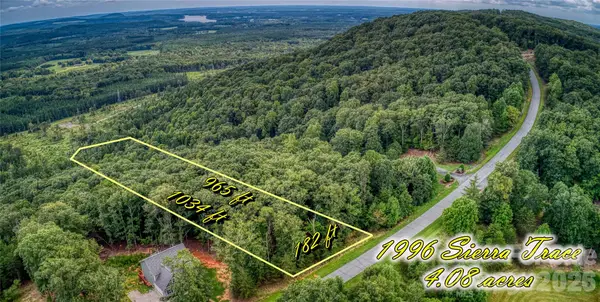 $54,900Active4.08 Acres
1996 Sierra Trace Road, Denton, NC 27239
MLS# 4361234Listed by: CHARLES JONES REALTY INC - New
 $70,000Active4.69 Acres
1026 Sierra Trace Road, Denton, NC 27239
MLS# 4360952Listed by: CHARLES JONES REALTY INC - New
 $29,900Active2.73 Acres
388 Palisade Trace, Denton, NC 27239
MLS# 4360949Listed by: CHARLES JONES REALTY INC - New
 $42,000Active-- Acres
367 Rocky Cove Lane, Denton, NC 27239
MLS# 1213145Listed by: UNITED COUNTRY CAROLINA PROPERTIES - New
 $165,000Active-- Acres
141 Old Heritage Drive, Winston-Salem, NC 27107
MLS# 1212665Listed by: COLDWELL BANKER ADVANTAGE 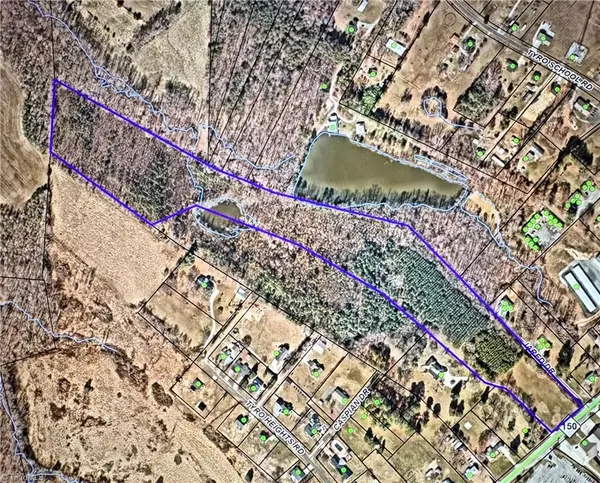 $500,000Pending-- Acres
0 S Nc Highway 150, Lexington, NC 27295
MLS# 1213004Listed by: CENTER TOWNE REALTORS- New
 $15,000Active-- Acres
187 Eastside Drive, Denton, NC 27239
MLS# 1213117Listed by: HOME STAR REALTY - New
 $130,000Active-- Acres
00 Tilden Nursery Road, Lexington, NC 27295
MLS# 1213128Listed by: UNITED COUNTRY CAROLINA PROPERTIES - New
 $55,000Active-- Acres
0 S Jones Street, Denton, NC 27239
MLS# 1213132Listed by: HOME STAR REALTY - New
 $415,000Active-- Acres
6696 Nc Highway 49, Denton, NC 27239
MLS# 1213103Listed by: NEW POINTE REALTY - New
 $565,000Active1.39 Acres
10 Burler Street, Lexington, NC 27292
MLS# LP758913Listed by: FRANKLIN JOHNSON COMMERCIAL REAL ESTATE - New
 $49,000Active1.44 Acres
162 Houstons Hideaway None, Lexington, NC 27292
MLS# 4359679Listed by: YADKIN REAL ESTATE LLC - New
 $72,000Active-- Acres
516 Widaustin Drive, Winston-Salem, NC 27127
MLS# 1212924Listed by: KELLER WILLIAMS REALTY - New
 $300,000Active-- Acres
0 Pine Woods Church Road, Thomasville, NC 27360
MLS# 1212659Listed by: BROADLEAF REALTY  $99,900Pending-- Acres
208 Aberdeen Drive, Lexington, NC 27292
MLS# 1212740Listed by: LEONARD CRAVER REALTY INC $39,900Active-- Acres
125 Outrigger Landing, Denton, NC 27239
MLS# 1212730Listed by: ANDERSON ROBBINS & ASSOCIATES REALTY $55,000Pending-- Acres
495 Perryman Road, Lexington, NC 27295
MLS# 1212556Listed by: PINK MAGNOLIA REALTY $100,000Pending-- Acres
612 Arvin Hill Lane, Lexington, NC 27295
MLS# 1212649Listed by: MANTLE LLC $35,000Pending-- Acres
109 Fox Trace Court, Thomasville, NC 27360
MLS# 1212293Listed by: WATFORD REALTY INC. $75,000Active-- Acres
11 Kirkwood Avenue, Lexington, NC 27292
MLS# 1212298Listed by: J. MARSHALL REALTY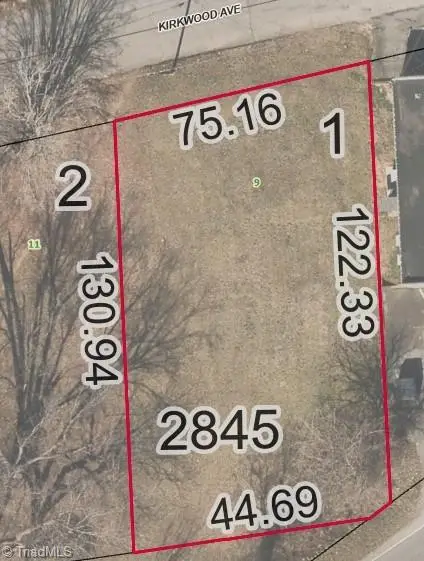 $75,000Active-- Acres
9 Kirkwood Avenue, Lexington, NC 27292
MLS# 1212303Listed by: J. MARSHALL REALTY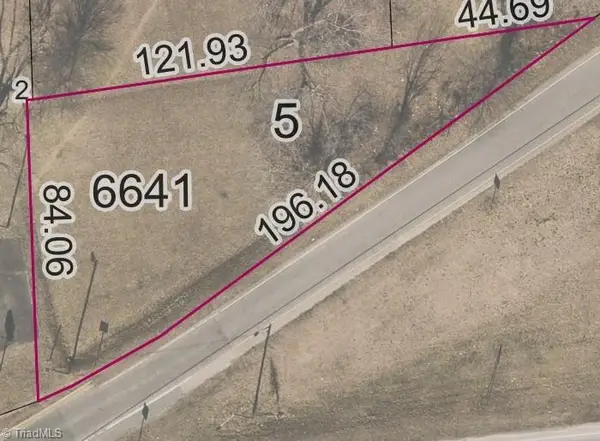 $75,000Active-- Acres
0 Kirkwood Avenue, Lexington, NC 27292
MLS# 1212304Listed by: J. MARSHALL REALTY $1,715,500Active-- Acres
421 Burl Owens Road, Lexington, NC 27292
MLS# 1212240Listed by: LEONARD CRAVER REALTY INC $5,000Pending-- Acres
175 & 195 Twin Creeks Road, Clemmons, NC 27012
MLS# 1212263Listed by: REALTY ONE GROUP RESULTS $25,000Pending-- Acres
0 Lowell Street, Lexington, NC 27295
MLS# 1212222Listed by: COLDWELL BANKER ADVANTAGE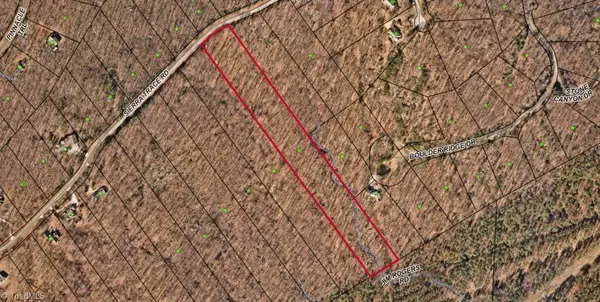 $90,000Active-- Acres
2320 Sierra Trace Road, Denton, NC 27239
MLS# 1212126Listed by: WORTH CLARK REALTY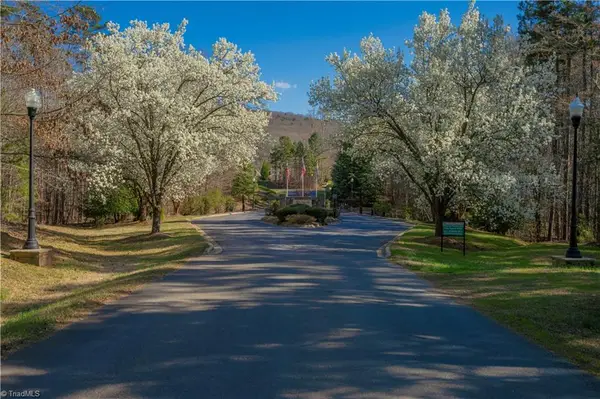 $87,000Active-- Acres
288 Emerald Isle Court, Lexington, NC 27292
MLS# 1211900Listed by: PRICE REALTORS - NC HWY 8 $25,000Active-- Acres
593 Boulder Ridge Drive, Denton, NC 27239
MLS# 1211760Listed by: THREE REALTY GROUP LLC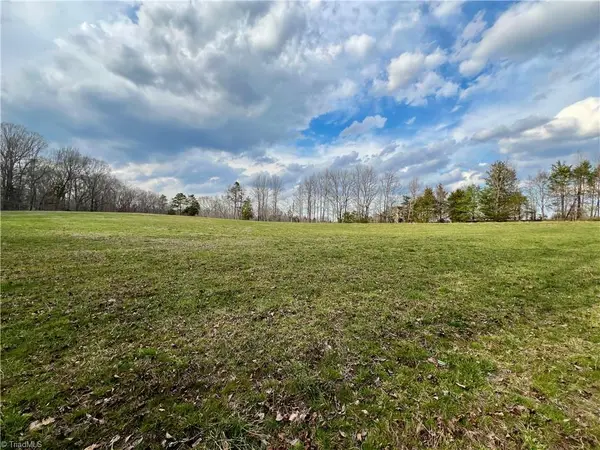 $399,999Active-- Acres
0 Old Greensboro Road, Thomasville, NC 27360
MLS# 1211367Listed by: CAPSTONE REALTY CONSULTANTS, INC $95,000Active-- Acres
199 Rose Of Sharon Lane, Lexington, NC 27292
MLS# 1210427Listed by: PRICE REALTORS - NC HWY 8 $40,000Active1.83 Acres
1197 Briggstown Road, Lexington, NC 27292
MLS# 4354282Listed by: NESTLEWOOD REALTY, LLC $1,999,900Active34.8 Acres
1347 Newsome Road, Denton, NC 27239
MLS# 4353367Listed by: MOSSY OAK PROPERTIES LAND AND FARMS REALTY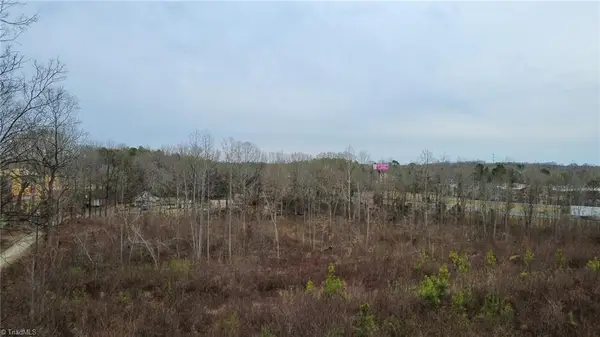 $489,900Active-- Acres
0 Bill Medlin Road, Lexington, NC 27292
MLS# 1210612Listed by: OAK & ELM REALTY GROUP LLC $26,900Active3.02 Acres
750 Palisade Trail, Denton, NC 27239
MLS# 4352842Listed by: CHARLES JONES REALTY INC $47,000Pending-- Acres
1688 Turner Road, Lexington, NC 27292
MLS# 1210638Listed by: EVANS PROPERTIES $45,000Active-- Acres
174 Mistral Lane, Denton, NC 27239
MLS# 1210433Listed by: HOWARD HANNA ALLEN TATE HIGH POINT $400,000Active0.98 Acres
0000 S Main Street, Lexington, NC 27292
MLS# 4336133Listed by: EXP REALTY LLC BALLANTYNE $49,000Active-- Acres
615 Burning Tree Circle, High Point, NC 27265
MLS# 1210150Listed by: COLDWELL BANKER ADVANTAGE $85,000Active-- Acres
151 Kyle Smith Court #1059, Winston-Salem, NC 27127
MLS# 1210468Listed by: TLS REALTY LLC $31,900Active0.72 Acres
177 Cove Wood Drive, Denton, NC 27239
MLS# 4351373Listed by: EMERALD POINTE REALTY $337,500Active-- Acres
0 New Jersey Church Road, Lexington, NC 27292
MLS# 1210366Listed by: COLTRANE & COMPANY $74,900Pending-- Acres
1191 Scout Road, Lexington, NC 27292
MLS# 1210297Listed by: LEONARD CRAVER REALTY INC $220,000Active-- Acres
164 Mae Kennedy Road, Thomasville, NC 27360
MLS# 1209332Listed by: REDFIN CORPORATION $795,000Active-- Acres
8015 E Us Highway 64, Thomasville, NC 27360
MLS# 1209286Listed by: DELILLE HOME $39,900Active-- Acres
863 Sierra Trace Road, Denton, NC 27239
MLS# 1209172Listed by: CHARLES JONES REALTY, INC. $30,000Pending-- Acres
0 Regalwood Drive, Winston-Salem, NC 27107
MLS# 1209325Listed by: BERKSHIRE HATHAWAY HOMESERVICES CAROLINAS REALTY $39,000Pending-- Acres
0 Regalwood Drive, Winston-Salem, NC 27107
MLS# 1209330Listed by: BERKSHIRE HATHAWAY HOMESERVICES CAROLINAS REALTY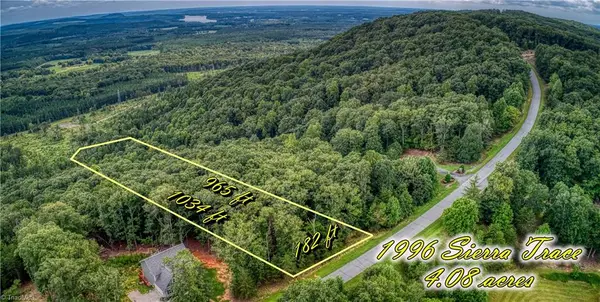 $54,900Active-- Acres
1996 Sierra Trace Road, Denton, NC 27239
MLS# 1209258Listed by: CHARLES JONES REALTY, INC. $70,000Active-- Acres
1026 Sierra Trace Road, Denton, NC 27239
MLS# 1209143Listed by: CHARLES JONES REALTY, INC. $59,900Active2.21 Acres
430 Sierra Trace Road, Denton, NC 27239
MLS# 4346448Listed by: CHARLES JONES REALTY INC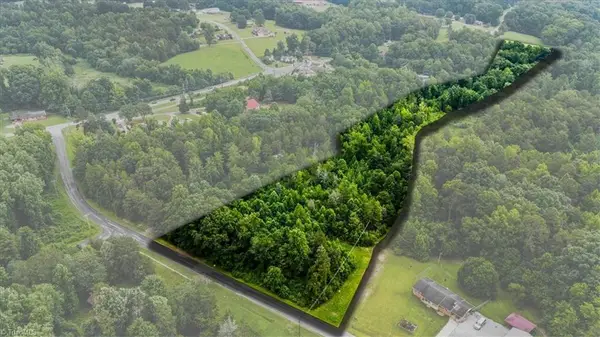 $179,900Pending-- Acres
00 Weavil Road, Winston-Salem, NC 27107
MLS# 1208718Listed by: EXP REALTY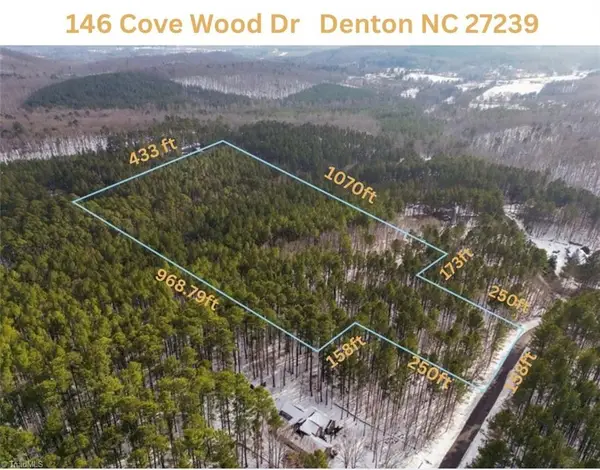 $119,000Active-- Acres
146 Cove Wood Drive, Denton, NC 27239
MLS# 1208424Listed by: SOUTHERN KEY REALTY $30,000Active0.64 Acres
0 Gate Drive, Thomasville, NC 27360
MLS# 4343300Listed by: EXP REALTY LLC $84,500Active1.43 Acres
229 Houstons Hideaway Court, Lexington, NC 27292
MLS# 4342174Listed by: 1ST CHOICE PROPERTIES INC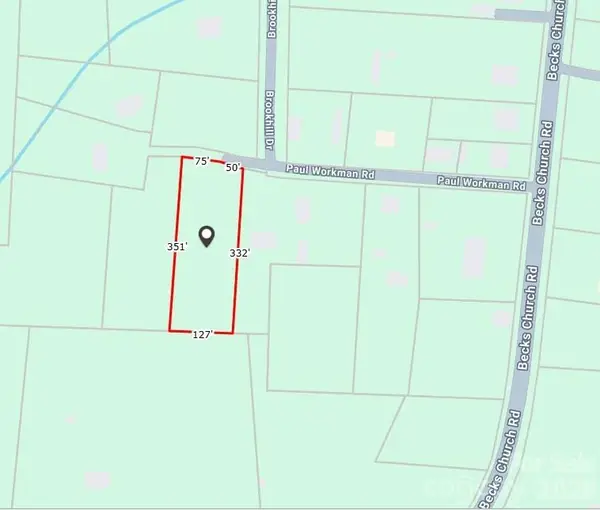 $24,000Active1 Acres
211 Paul Workman Road, Lexington, NC 27292
MLS# 4341895Listed by: MATHERS REALTY.COM $110,000Active3.14 Acres
1303 Burton Avenue, High Point, NC 27262
MLS# 10143951Listed by: EXP REALTY $9,500Active-- Acres
439 Boulder Ridge Drive, Denton, NC 27239
MLS# 1207990Listed by: CAROLINA HOME PARTNERS BY EXP REALTY $53,900Active0.79 Acres
0000 Lake Ridge Trail, Denton, NC 27239
MLS# 4341924Listed by: MATHERS REALTY.COM $125,000Active-- Acres
1349 Hickory Point Drive, Lexington, NC 27292
MLS# 1207933Listed by: COMPASS CAROLINAS, LLC $32,000Active-- Acres
284 Sirocco Drive E, Denton, NC 27239
MLS# 1207956Listed by: TODD SMITH AND ASSOCIATES $30,000Active-- Acres
174 Sirocco Drive E, Denton, NC 27239
MLS# 1207960Listed by: TODD SMITH AND ASSOCIATES $185,000Pending-- Acres
00 Mae Kennedy Road, Thomasville, NC 27360
MLS# 1207569Listed by: REDFIN CORPORATION $205,000Active-- Acres
1001 Us Highway 64, Lexington, NC 27295
MLS# 1207094Listed by: PRICE REALTORS - ARCHDALE $49,000Active-- Acres
000 Trading Ford Way, Linwood, NC 27299
MLS# 1207131Listed by: HOME SWEET HOME REAL ESTATE, LLC $65,000Active-- Acres
188 Starboard Reach, Lexington, NC 27292
MLS# 1206885Listed by: LOCAL R.E. INC. $55,000Pending-- Acres
112 Highgate Lane #1049, Lexington, NC 27292
MLS# 1206760Listed by: TLS REALTY LLC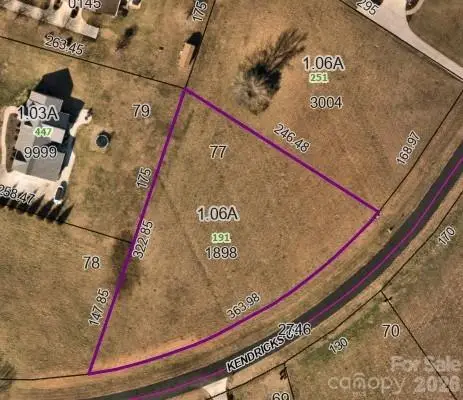 $85,000Active1.06 Acres
191 Kendricks Cove, Lexington, NC 27292
MLS# 4335721Listed by: OMB REAL ESTATE LLC $1,473,500Active-- Acres
0 Scout Road, Lexington, NC 27292
MLS# 1206387Listed by: RE/MAX PREFERRED PROPERTIES $3,803,400Active-- Acres
0 Old Mountain Road, Lexington, NC 27292
MLS# 1206395Listed by: RE/MAX PREFERRED PROPERTIES $4,007,016Active-- Acres
0 Bringle Ferry Road, Denton, NC 27239
MLS# 1206403Listed by: RE/MAX PREFERRED PROPERTIES $803,875Active54 Acres
438 Pine River Trail, Clemmons, NC 27012
MLS# 4299764Listed by: YADKIN REAL ESTATE LLC $64,900Active5.27 Acres
1644 Sierra Trace Road, Denton, NC 27239
MLS# 4332928Listed by: CHARLES JONES REALTY INC $59,900Active1.78 Acres
338 Sierra Trace Road, Denton, NC 27239
MLS# 4332934Listed by: CHARLES JONES REALTY INC $69,000Active-- Acres
117 Starboard Reach, Lexington, NC 27292
MLS# 1206116Listed by: REAL BROKER LLC $35,000Active-- Acres
280 NW Elementary Road, Lexington, NC 27295
MLS# 1206023Listed by: COLDWELL BANKER ADVANTAGE $1,020,000Active-- Acres
0 Nc Highway 8, Denton, NC 27239
MLS# 1206006Listed by: BOGGS REALTY $765,000Active-- Acres
0 Lee Wilson Road, Denton, NC 27239
MLS# 1206015Listed by: BOGGS REALTY $70,000Pending-- Acres
200 Harbor Drive E, Lexington, NC 27295
MLS# 1205282Listed by: MOSSY OAK PROPERTIES LAND AND FARM REALTY $92,500Active1.29 Acres
000 Manteo Road, Lexington, NC 27295
MLS# 4318010Listed by: RE/MAX EXECUTIVE- New
 $59,000Active1.14 Acres
314 Scout Road, Lexington, NC 27292
MLS# 4359685Listed by: YADKIN REAL ESTATE LLC  $85,000Pending-- Acres
192 Swans Way, Lexington, NC 27295
MLS# 1204602Listed by: HOWARD HANNA ALLEN TATE HIGH POINT $50,000Active-- Acres
00 New Bowers Road, Lexington, NC 27292
MLS# 1204533Listed by: JOSHUA MITCHELL REAL ESTATE $25,500Active2.97 Acres
2389 Sierra Trace Road, Denton, NC 27239
MLS# 100544815Listed by: RIGGS REALTY GROUP $38,000Active-- Acres
926 Greensboro Street Extension, Lexington, NC 27292
MLS# 1203878Listed by: RE/MAX REVOLUTION $279,900Active-- Acres
7515 Old Us Highway 64, Lexington, NC 27292
MLS# 1203930Listed by: ANN BLACK REALTY, INC $12,000Active-- Acres
0 Anns Drive, Thomasville, NC 27360
MLS# 1203825Listed by: HOME STAR REALTY $16,000Active-- Acres
180 Plateau Lane, Denton, NC 27239
MLS# 1203351Listed by: HOWARD HANNA ALLEN TATE - WINSTON SALEM $26,000Active-- Acres
207 Craver Drive, Winston-Salem, NC 27107
MLS# 1202908Listed by: COLDWELL BANKER ADVANTAGE $30,000Active-- Acres
346 Palisade Trail, Denton, NC 27239
MLS# 1202996Listed by: HOWARD HANNA ALLEN TATE - WINSTON SALEM $40,000Active-- Acres
4835 Regalwood Drive #Lot 52, Winston-Salem, NC 27107
MLS# 1202976Listed by: REAL BROKER LLC $35,000Active-- Acres
0 Regalwood Drive #Lot 57, Winston-Salem, NC 27107
MLS# 1202972Listed by: REAL BROKER LLC $45,000Active-- Acres
4817 Regalwood Drive #Lot 56, Winston-Salem, NC 27107
MLS# 1202973Listed by: REAL BROKER LLC $28,000Active0.31 Acres
166 S Main Street, Denton, NC 27239
MLS# 4324344Listed by: RE/MAX CENTRAL REALTY $59,999Active-- Acres
900 Starboard Reach, Lexington, NC 27292
MLS# 1202367Listed by: COLDWELL BANKER ADVANTAGE $175,000Active-- Acres
0 Frye Bridge Road, Clemmons, NC 27012
MLS# 1202070Listed by: RING THE BELL REALTY $98,500Active-- Acres
502 Jim Bell Road, Lexington, NC 27292
MLS# 1201648Listed by: KELLER WILLIAMS REALTY ELITE $675,000Active-- Acres
205 Alex Hayes Road, Clemmons, NC 27012
MLS# 1202251Listed by: SHANNON CONRAD & ASSOCIATES, INC. $27,000Active-- Acres
1378 Jubilee Road, Linwood, NC 27299
MLS# 1202245Listed by: LEONARD CRAVER REALTY $40,000Active-- Acres
400 Pinnacle Trail, Denton, NC 27239
MLS# 1200903Listed by: HOWARD HANNA ALLEN TATE KERNERSVILLE $35,000Active-- Acres
480 Avenue I, Lexington, NC 27292
MLS# 1201222Listed by: HOME SWEET HOME REAL ESTATE, LLC $60,000Active-- Acres
114 Harborgate Drive, Denton, NC 27239
MLS# 1200212Listed by: REAL BROKER LLC $60,000Active-- Acres
120 Harborgate Drive, Denton, NC 27239
MLS# 1200222Listed by: REAL BROKER LLC $67,000Active-- Acres
456 Starboard Reach, Lexington, NC 27292
MLS# 1199904Listed by: UWHARRIE REAL ESTATE $20,000Pending0.67 Acres
000 Pinecrest Drive, Lexington, NC 27295
MLS# 4313088Listed by: TERRI BIAS & ASSOCIATES INC $35,000Active-- Acres
106 Carolina Avenue, Thomasville, NC 27360
MLS# 1199018Listed by: SOLID ROCK REALTY & ASSOCIATES $59,000Active-- Acres
0 Pilgrim Court, Lexington, NC 27295
MLS# 1197613Listed by: SOUTHERN KEY REALTY $20,000Active-- Acres
1582 Rocky Cove Lane, Denton, NC 27239
MLS# 1197514Listed by: REAL BROKER LLC $299,000Active-- Acres
190 Point View Court, Denton, NC 27239
MLS# 1197105Listed by: REAL BROKER LLC $29,000Pending-- Acres
148 Garner Street, Denton, NC 27239
MLS# 1197091Listed by: PRICE REALTORS - NC HWY 8 $60,000Active-- Acres
0 N Nc Highway 109 #Tract 2, Winston-Salem, NC 27107
MLS# 1195794Listed by: SOUTHERN SIGNATURE PROPERTIES $30,000Pending-- Acres
0 N Nc Highway 109 #Tract 1, Winston-Salem, NC 27107
MLS# 1195805Listed by: SOUTHERN SIGNATURE PROPERTIES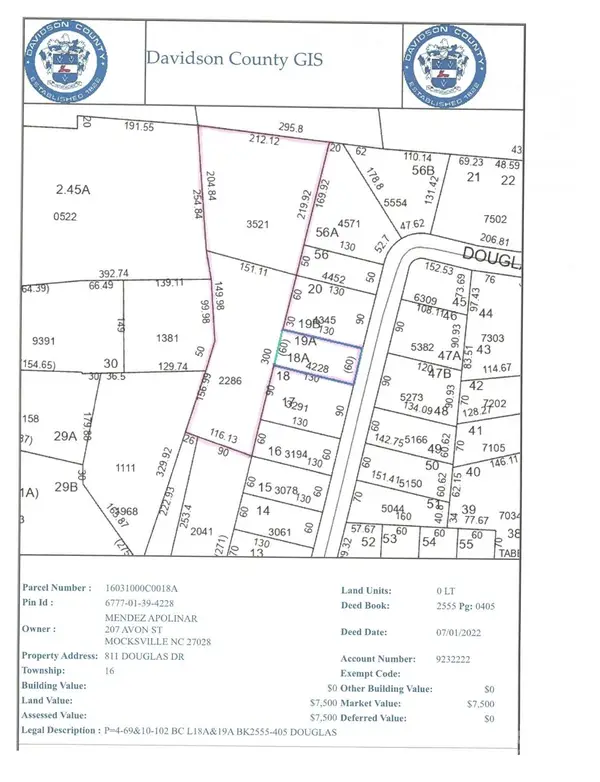 $45,900Active1.88 Acres
811 Douglas Drive, Thomasville, NC 27360
MLS# 4296528Listed by: TOTAL REAL ESTATE LLC $599,000Pending-- Acres
1670 Frank Hulin Road, Lexington, NC 27295
MLS# 1194795Listed by: COLDWELL BANKER ADVANTAGE $150,000Active6 Acres
1099 Kapstone Crossing, Lexington, NC 27295
MLS# 4295852Listed by: REAL BROKER, LLC $75,000Active-- Acres
195 H L Palmer Road, Lexington, NC 27292
MLS# 1194147Listed by: EVERHOME REAL ESTATE $65,000Active4.95 Acres
0 Smith Drive, Thomasville, NC 27360
MLS# 4296179Listed by: CAROLINA REALTY ADVISORS $130,000Pending-- Acres
225 Hidden Acres Drive, Thomasville, NC 27360
MLS# 1193469Listed by: COLDWELL BANKER ADVANTAGE $187,500Pending-- Acres
0 Alvis Lane, Winston-Salem, NC 27107
MLS# 1191936Listed by: KB REALTY $149,900Active-- Acres
0000 Old Lexington Road, Thomasville, NC 27360
MLS# 1191586Listed by: RUSSELL REALTY, INC. $1,125,000Active-- Acres
2619 S Nc Highway 109, Thomasville, NC 27360
MLS# 1191477Listed by: PRICE REALTORS - NC HWY 8 $71,000Active-- Acres
3759 Fuller Mill Road N, Thomasville, NC 27360
MLS# 1191141Listed by: CAROLINA HOMES FOR SALE $423,000Active-- Acres
1 Towhee Trail, Lexington, NC 27295
MLS# 1190910Listed by: WARE REALTY $299,900Active-- Acres
0 Coral Lane, Thomasville, NC 27360
MLS# 1190767Listed by: ELITE PRO PROPERTIES $14,000Active-- Acres
00 Sir Abbott Lane, Lexington, NC 27292
MLS# 1190489Listed by: UWHARRIE REAL ESTATE $40,000Active-- Acres
0 E Holly Grove Road, Lexington, NC 27292
MLS# 1190158Listed by: DELAPP PROPERTIES $185,000Active-- Acres
163 Emily Court, High Point, NC 27265
MLS# 1190015Listed by: COLDWELL BANKER ADVANTAGE $60,000Active-- Acres
344 Blythe Drive, Thomasville, NC 27360
MLS# 1151144Listed by: UWHARRIE REAL ESTATE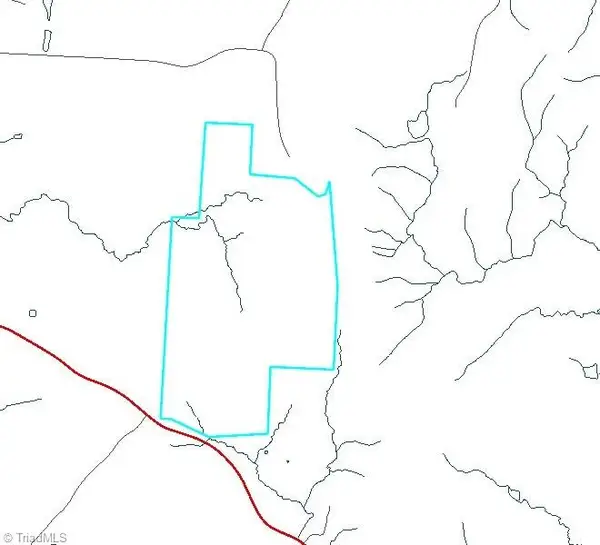 $1,036,350Active-- Acres
0 Nc Highway 47, Denton, NC 27239
MLS# 1187763Listed by: DELAPP PROPERTIES $299,900Active-- Acres
452 S Old Greensboro Road, Thomasville, NC 27360
MLS# 1188945Listed by: HEPLER REALTY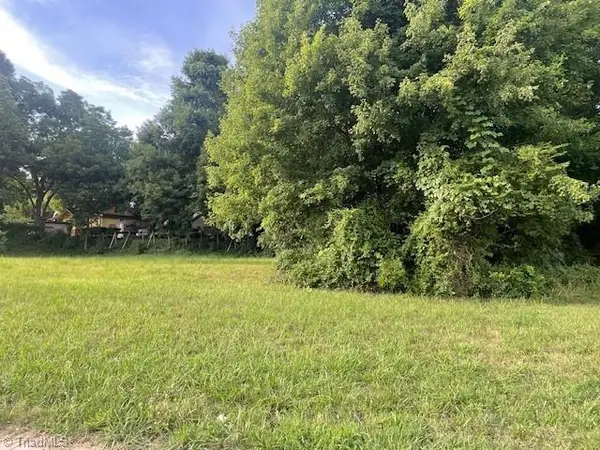 $95,000Active-- Acres
402 Martin Luther King Jr Boulevard, Lexington, NC 27292
MLS# 1188507Listed by: LEONARD CRAVER REALTY INC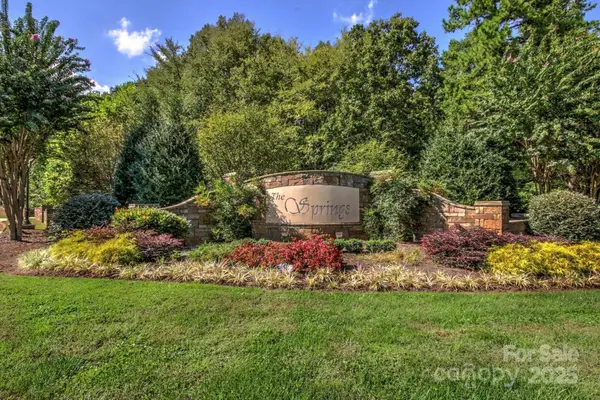 $16,500Active0.99 Acres
350 Pinnacle Trail, Denton, NC 27239
MLS# 4283519Listed by: TMR REALTY, INC. $445,000Active-- Acres
0 Ralph Craver Road, Lexington, NC 27295
MLS# 1187363Listed by: KELLER WILLIAMS REALTY ELITE $15,000Active-- Acres
390 Tranquility Lakes Drive, Denton, NC 27239
MLS# 1187725Listed by: UWHARRIE REAL ESTATE $29,500Active-- Acres
1953 Sierra Trace Road, Denton, NC 27239
MLS# 1185142Listed by: UWHARRIE REAL ESTATE $752,712Active-- Acres
000 Hickory Tree Road, Winston-Salem, NC 27127
MLS# 1187848Listed by: HUBBARD REALTY $50,000Active4.26 Acres
1695 Sierra Trace Road, Denton, NC 27239
MLS# 4281471Listed by: TMR REALTY, INC. $22,000Active-- Acres
000 Harborgate Drive, Denton, NC 27239
MLS# 1187390Listed by: ALL ABOUT YOU REALTY TEAM $25,000Active0.46 Acres
251 Bowers Road #10, Thomasville, NC 27360
MLS# 4279665Listed by: TOTAL REAL ESTATE LLC $125,000Active2.29 Acres
255 Bowers Road, Thomasville, NC 27360
MLS# 4101026Listed by: TOTAL REAL ESTATE LLC $25,000Active-- Acres
251 Bowers Road, Thomasville, NC 27360
MLS# 1142927Listed by: TOTAL REAL ESTATE, LLC $29,900Active1.65 Acres
1560 Rocky Cove Lane, Denton, NC 27239
MLS# 4278022Listed by: CHARLES JONES REALTY INC $34,900Active-- Acres
2874 Sierra Trace Road, Denton, NC 27239
MLS# 1185391Listed by: EPIQUE REALTY $750Pending0.31 Acres
0 Bowers Road, Lexington, NC 27292
MLS# 10094393Listed by: CAROLINA LAND EXPERTS $275Pending0.26 Acres
0 Linwood-southmont Rd Road, Linwood, NC 27299
MLS# 10094461Listed by: CAROLINA LAND EXPERTS $115,000Active-- Acres
0 Laura Lane, High Point, NC 27262
MLS# 1182651Listed by: HOWARD HANNA ALLEN TATE HIGH POINT $55,500Active-- Acres
335 Healing Springs Drive, Denton, NC 27239
MLS# 1182311Listed by: PRICE REALTORS - NC HWY 8 $1,600,000Active-- Acres
1409 Winston Road, Lexington, NC 27292
MLS# 1182352Listed by: PRICE REALTORS - NC HWY 8 $99,900Active-- Acres
202 Belle Arbor Drive, Winston-Salem, NC 27107
MLS# 1182073Listed by: SOUTHERN KEY REALTY $1,360,000Active-- Acres
2164 Holly Grove Road, Lexington, NC 27292
MLS# 1182099Listed by: DELAPP PROPERTIES $500Pending0.54 Acres
0 American Way, Lexington, NC 27295
MLS# 10094395Listed by: CAROLINA LAND EXPERTS $172,200Active-- Acres
0 Julia Avenue, Thomasville, NC 27360
MLS# 1177844Listed by: COLDWELL BANKER ADVANTAGE $130,000Pending-- Acres
219 Dot Street, Denton, NC 27239
MLS# 1177034Listed by: PRICE REALTORS - THOMASVILLE $233,000Active-- Acres
1301 Cotton Grove Road, Lexington, NC 27292
MLS# 1175864Listed by: PRICE REALTORS - NC HWY 8 $59,000Active0.64 Acres
0 Hillcrest Drive #90, Thomasville, NC 27360
MLS# 4240649Listed by: KELLER WILLIAMS BALLANTYNE AREA $84,900Active-- Acres
853 Gumtree Road, Winston-Salem, NC 27107
MLS# 1174679Listed by: SB HOGAN DEVELOPMENT LLC $167,000Active-- Acres
874 Scout Road, Lexington, NC 27292
MLS# 1174156Listed by: PRICE REALTORS - NC HWY 8 $45,900Pending-- Acres
0 Wesley Street, Lexington, NC 27295
MLS# 1174039Listed by: QUALITY MANAGEMENT & REALTY $99,000Active1.17 Acres
240 Houstons Hideaway Court, Lexington, NC 27292
MLS# 4233760Listed by: EXP REALTY LLC BALLANTYNE $45,000Active3.1 Acres
2410 Summerville Church Road, Denton, NC 27239
MLS# 4350499Listed by: EXP REALTY LLC $79,500Active2.04 Acres
1355 Rocky Cove Lane, Denton, NC 27239
MLS# 4228110Listed by: AUSTIN-BARNETT REALTY LLC $130,000Active2.83 Acres
352 Fisher Farm Road, Lexington, NC 27292
MLS# 4228139Listed by: CELIA ESTRADA, REALTORS $250,000Pending-- Acres
1903 Cotton Grove Road, Lexington, NC 27292
MLS# 1171842Listed by: PRICE REALTORS - NC HWY 8 $57,000Active1.79 Acres
156 Sailors Rest Drive, Lexington, NC 27292
MLS# 4221621Listed by: JOHN CHRISTIAN LUXURY REAL ESTATE $524,000Active1.35 Acres
219 Sailors Rest Drive, Lexington, NC 27292
MLS# 4221684Listed by: JOHN CHRISTIAN LUXURY REAL ESTATE $474,000Active2.05 Acres
245 Sailors Rest Drive, Lexington, NC 27292
MLS# 4221699Listed by: JOHN CHRISTIAN LUXURY REAL ESTATE $20,000Pending-- Acres
00 Oriole Drive, Lexington, NC 27292
MLS# 1169503Listed by: REAL BROKER LLC $149,900Pending-- Acres
00 Old Linwood Road, Lexington, NC 27292
MLS# 1166846Listed by: ACTION REALTY OF N.C. $27,000Active-- Acres
5870 Zinzendorf Road, Winston-Salem, NC 27127
MLS# 832114Listed by: HUBBARD REALTY $27,000Active-- Acres
2991 Spangenberg Road, Winston-Salem, NC 27127
MLS# 832146Listed by: HUBBARD REALTY $6,700,000Active-- Acres
144 Brown Street, Lexington, NC 27292
MLS# 1165847Listed by: REALTY ONE GROUP RESULTS $75,000Pending-- Acres
1146 Fern Creek, Lexington, NC 27292
MLS# 1166604Listed by: KELLER WILLIAMS REALTY ELITE $140,000Active-- Acres
00 New Cut Road, Lexington, NC 27292
MLS# 1165928Listed by: ALL ABOUT YOU REALTY TEAM $210,000Pending-- Acres
2223 Nc Highway 47, Lexington, NC 27292
MLS# 1165839Listed by: TRI COUNTY REAL ESTATE $795,000Pending868 Acres
166 Panther Lane, Ellenburg, NY 12933
MLS# 4999731Listed by: LANDVEST, INC-BURLINGTON $95,000Active5.33 Acres
609 Copperfield Lane, Lexington, NC 27292
MLS# 4205591Listed by: BELLCO HOMES LLC $66,100Active-- Acres
126 Harborgate Drive, Denton, NC 27239
MLS# 1200164Listed by: REAL BROKER LLC $69,000Active-- Acres
102 Harborgate Drive, Denton, NC 27239
MLS# 1200172Listed by: REAL BROKER LLC $100,600Active-- Acres
144 Harborgate Drive, Denton, NC 27239
MLS# 1203532Listed by: REAL BROKER LLC $71,800Pending-- Acres
108 Harborgate Drive, Denton, NC 27239
MLS# 1164579Listed by: PRICE REALTORS - NC HWY 8 $119,900Pending-- Acres
338 River Pines Trail, Clemmons, NC 27012
MLS# 1163590Listed by: MARY ELIZABETH PRICE $59,500Active6.11 Acres
2274 Sierra Trace Road #44, Denton, NC 27239
MLS# 4196523Listed by: UNITED COUNTRY REAL ESTATE - THE MCLEMORE GROUP $9,000Pending-- Acres
0 Denton Road, Denton, NC 27239
MLS# 1161078Listed by: YADKIN REAL ESTATE LLC $39,900Pending-- Acres
302 Pineywood Road, Thomasville, NC 27360
MLS# 1158982Listed by: SINCERELY YOURS REAL ESTATE $32,500Pending-- Acres
0 Jones Court, Winston-Salem, NC 27107
MLS# 1156849Listed by: ALLEN TATE WINSTON SALEM $22,000Active1.2 Acres
635 Rocky Cove Lane, Denton, NC 27239
MLS# 4182294Listed by: DEBBIE C REALTY LLC $65,000Active-- Acres
222 Starboard Reach, Lexington, NC 27292
MLS# 1155652Listed by: THOMASON REALTY GROUP, LLC $72,900Pending-- Acres
313 Yountz Road, Lexington, NC 27292
MLS# 1155195Listed by: REALTY ONE GROUP RESULTS $145,000Active-- Acres
1050 Medinah Drive, Winston-Salem, NC 27107
MLS# 1206672Listed by: COLDWELL BANKER ADVANTAGE $1,150,000Active-- Acres
5150 Nc Highway 8, Lexington, NC 27292
MLS# 1151862Listed by: PRICE REALTORS - NC HWY 8 $5,899,000Active434.5 Acres
13290 Nc 8 Highway, Lexington, NC 27292
MLS# 4167057Listed by: PREMIER SOTHEBY'S INTERNATIONAL REALTY $55,000Pending-- Acres
686 Palisade Trail, Denton, NC 27239
MLS# 1148457Listed by: UNITED COUNTRY CAROLINA PROPERTIES $37,500Active1.27 Acres
14 Arbor Drive, Lexington, NC 27292
MLS# 4271914Listed by: UNITED COUNTRY REAL ESTATE - THE MCLEMORE GROUP $19,900Active-- Acres
Lot 18 Sec2 Fieldstone Drive, Winston-Salem, NC 27127
MLS# 1145983Listed by: HOWARD HANNA ALLEN TATE - WINSTON SALEM $19,900Active-- Acres
Lot19 Sec2 Fieldstone Drive, Winston-Salem, NC 27127
MLS# 1145985Listed by: HOWARD HANNA ALLEN TATE - WINSTON SALEM $26,500Active-- Acres
160 George Landing, Denton, NC 27239
MLS# 1144791Listed by: THOMASON REALTY GROUP, LLC $26,500Active0.53 Acres
167 George Landing, Denton, NC 27239
MLS# 4147770Listed by: THOMASON REALTY GROUP, LLC $26,500Active0.45 Acres
160 George Landing, Thomasville, NC 27239
MLS# 4147780Listed by: THOMASON REALTY GROUP, LLC $26,500Active0.46 Acres
126 Potters Landing, Denton, NC 27239
MLS# 4147782Listed by: THOMASON REALTY GROUP, LLC $26,500Active0.49 Acres
123 Catfish Landing, Denton, NC 27239
MLS# 4147785Listed by: THOMASON REALTY GROUP, LLC $26,500Active0.56 Acres
145 George Landing, Denton, NC 27239
MLS# 4147787Listed by: THOMASON REALTY GROUP, LLC $28,500Active0.51 Acres
212 Potters Landing, Denton, NC 27239
MLS# 4147793Listed by: THOMASON REALTY GROUP, LLC $28,500Active0.5 Acres
238 Potters Landing, Denton, NC 27239
MLS# 4147796Listed by: THOMASON REALTY GROUP, LLC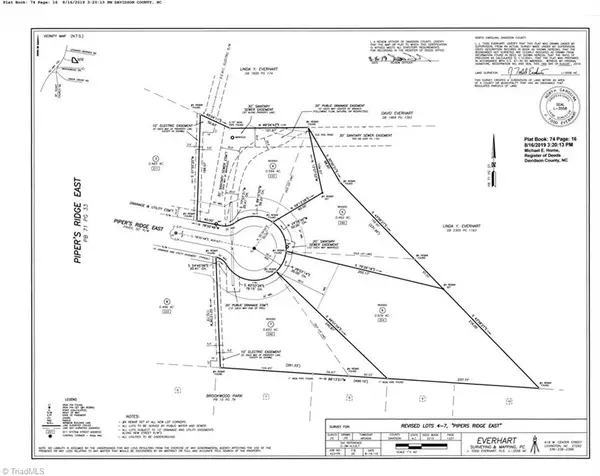 $65,000Active-- Acres
249 Pipers Ridge East, Clemmons, NC 27127
MLS# 1142957Listed by: ROBERTSON REALTY $133,900Active5.29 Acres
253 N Urban Street, Thomasville, NC 27360
MLS# 4141999Listed by: HOWARD HANNA ALLEN TATE WINSTON SALEM $20,000Active1.35 Acres
00 Rocky Cove Lane, Denton, NC 27239
MLS# 4134117Listed by: THE LAKE TEAM LLC $105,555Pending-- Acres
752 Mcdowell Road, Winston Salem, NC 27107
MLS# 1141761Listed by: WEST MAPLE REALTY $100,000Pending-- Acres
00 Swicegood Road, Linwood, NC 27299
MLS# 1140441Listed by: SLOAN REALTY $100,000Active-- Acres
883 Kapstone Crossing, Lexington, NC 27295
MLS# 1187358Listed by: TRIAD HOME REAL ESTATE LLC $21,995Pending-- Acres
352 Shell Road, Thomasville, NC 27360
MLS# 1139243Listed by: KELLER WILLIAMS REALTY $18,000Pending-- Acres
00 Wildwood Lane, Winston Salem, NC 27107
MLS# 1136381Listed by: KELLER WILLIAMS REALTY ELITE $49,900Active-- Acres
3361 N Goat Pasture Road, Lexington, NC 27295
MLS# 1136673Listed by: LEONARD CRAVER REALTY INC $1,250,000Active-- Acres
0 Sells Farm Road, Kernersville, NC 27284
MLS# 1133581Listed by: BERKSHIRE HATHAWAY HOMESERVICES CAROLINAS REALTY $59,999Pending-- Acres
924 Horseshoe Neck Road, Lexington, NC 27295
MLS# 1132960Listed by: MOVA REALTY GROUP $39,000Pending-- Acres
124 Holiday Drive, Lexington, NC 27295
MLS# 1132877Listed by: JPAR LEGACY GROUP $65,000Active1.32 Acres
175 Harborgate Drive #201, Denton, NC 27239
MLS# 4296001Listed by: UNITED COUNTRY REAL ESTATE - THE MCLEMORE GROUP $65,000Pending-- Acres
2724 Croquet Circle, High Point, NC 27262
MLS# 1132501Listed by: PRICE REALTORS $65,000Pending-- Acres
2722 Croquet Circle, High Point, NC 27262
MLS# 1132503Listed by: PRICE REALTORS $20,000Pending-- Acres
2225 Sierra Trace Road, Denton, NC 27239
MLS# 1129905Listed by: REAL BROKER LLC $680,000Pending-- Acres
0000 Bombay Road, Denton, NC 27239
MLS# 1128354Listed by: NORTHGROUP REAL ESTATE $45,000Pending-- Acres
526 - Lot 1 Arthur Kepley Road, Lexington, NC 27292
MLS# 1126145Listed by: THOMASON REALTY GROUP, LLC $43,000Pending-- Acres
526 - Lot 2 Arthur Kepley Road, Lexington, NC 27292
MLS# 1126146Listed by: THOMASON REALTY GROUP, LLC $47,000Pending-- Acres
526 - Lot 3 Arthur Kepley Road, Lexington, NC 27292
MLS# 1126147Listed by: THOMASON REALTY GROUP, LLC $25,900Pending-- Acres
2627 Sierra Trace Road, Denton, NC 27239
MLS# 1123424Listed by: UWHARRIE REAL ESTATE $15,400Pending-- Acres
0 Denton Road, Denton, NC 27239
MLS# 1115361Listed by: YADKIN REAL ESTATE LLC $35,000Active-- Acres
618 Widaustin Drive, Winston-Salem, NC 27127
MLS# 1114927Listed by: HUBBARD REALTY $49,500Active-- Acres
348 Reedy Creek Court, Lexington, NC 27295
MLS# 1108112Listed by: HUBBARD REALTY $44,900Active-- Acres
190 Reedy Creek Court, Lexington, NC 27295
MLS# 1109067Listed by: HUBBARD REALTY $250,000Active33.15 Acres
00 Harborgate Drive, Denton, NC 27239
MLS# 4147739Listed by: THOMASON REALTY GROUP, LLC $45,000Pending-- Acres
00 W Lexington Avenue #10763 NC Hwy 8, High Point, NC 27265
MLS# 1106095Listed by: UWHARRIE REAL ESTATE $60,000Active-- Acres
3 Linwood Road, Lexington, NC 27292
MLS# 1096365Listed by: PRICE REALTORS - NC HWY 8 $15,000Pending-- Acres
0 Myers Drive, Thomasville, NC 27360
MLS# 1101252Listed by: SINCERELY YOURS REAL ESTATE $39,000Active-- Acres
1527 Sierra Trace Road, Denton, NC 27239
MLS# 1204912Listed by: LAKE FRONT PROPERTIES $495,000Active-- Acres
1 Harb Drive, Lexington, NC 27295
MLS# 1095617Listed by: PRICE REALTORS - NC HWY 8 $19,000Pending-- Acres
820 Shoreline Drive, Lexington, NC 27292
MLS# 1097783Listed by: PRICE REALTORS - NC HWY 8 $95,000Pending-- Acres
0 Mount Calvary Road, Thomasville, NC 27360
MLS# 1096578Listed by: EXP REALTY $1,500,000Pending49 Acres
1014 E Center Street, Lexington, NC 27292
MLS# 2018484Listed by: NORTH CAROLINA ESTATES $35,000Active1.15 Acres
159 Wyle Wood Loop #38, Denton, NC 27239
MLS# 3708569Listed by: RAM REALTY LLC $210,000Active2.76 Acres
630 Potters Landing, Denton, NC 27239
MLS# 4147747Listed by: THOMASON REALTY GROUP, LLC $175,000Active0.92 Acres
606 Potters Landing, Denton, NC 27239
MLS# 4147759Listed by: THOMASON REALTY GROUP, LLC $125,000Active0.92 Acres
568 Potters Landing, Denton, NC 27239
MLS# 4147764Listed by: THOMASON REALTY GROUP, LLC $110,000Pending-- Acres
929 Kapstone Crossing, Lexington, NC 27295
MLS# 1052168Listed by: JOHN KENNEDY REALTY LLC $37,000Active-- Acres
185 Valley Hill Lane, Lexington, NC 27295
MLS# 1059011Listed by: HUBBARD REALTY $37,000Pending-- Acres
172 Crossfield Court, Lexington, NC 27295
MLS# 1059020Listed by: HUBBARD REALTY $39,000Pending-- Acres
232 W Jefferson Road, Lexington, NC 27292
MLS# 1084180Listed by: HUBBARD REALTY $24,950Pending-- Acres
00 Old Highway 29, Thomasville, NC 27360
MLS# 1087983Listed by: SELL YOUR HOME SERVICES LLC $28,000Pending-- Acres
185 S Main Street, Denton, NC 27239
MLS# 1090483Listed by: PRICE REALTORS - NC HWY 8 $160,000Active-- Acres
330 Old Heritage Drive, Winston-Salem, NC 27107
MLS# 798821Listed by: COLDWELL BANKER ADVANTAGE $159,900Pending-- Acres
655 Ed Sink Road, Thomasville, NC 27360
MLS# 980159Listed by: TIM TAYLOR REALTY $350,000Pending-- Acres
0 Old Greensboro Road, Thomasville, NC 27360
MLS# 992884Listed by: HEARTHSTONE REAL ESTATE
Local realty services provided by:CENTURY 21 The Harrelson Group, CENTURY 21 Total Real Estate Solutions, CENTURY 21 Rucker Real Estate, CENTURY 21 Triangle Group, CENTURY 21 Gold Key Realty
2026 Triad MLS, Inc. All rights reserved. IDX information is provided exclusively for personal, non-commercial use, and may not be used for any purpose other than to identify prospective properties consumers may be interested in purchasing. Information is deemed reliable but not guaranteed. This site will be monitored for ‘scraping’ and any use of search facilities of data on the site other than by potential buyers/sellers is prohibited. All Sale data is for informational purposes only and is not an indication of a market analysis or appraisal. Properties marked with the Triad MLS, Inc. icon are provided courtesy of the Triad MLS, Inc.’s, Internet Data Exchange Database.
Listings marked with a Doorify MLS icon are provided courtesy of the Doorify MLS, of North Carolina, Internet Data Exchange Database. Brokers make an effort to deliver accurate information, but buyers should independently verify any information on which they will rely in a transaction. The listing broker shall not be responsible for any typographical errors, misinformation, or misprints, and they shall be held totally harmless from any damages arising from reliance upon this data. This data is provided exclusively for consumers’ personal, non-commercial use. Copyright 2026 Doorify MLS of North Carolina. All rights reserved.
Listings courtesy of Canopy MLS as distributed by MLS GRID. Copyright 2021 Canopy MLS. All rights reserved. Canopy MLS, provides content displayed here (“provided content”) on an “as is” basis and makes no representations or warranties regarding the provided content, including, but not limited to those of non-infringement, timeliness, accuracy, or completeness. Individuals and companies using information presented are responsible for verification and validation of information they utilize and present to their customers and clients. Canopy MLS will not be liable for any damage or loss resulting from use of the provided content or the products available through Portals, IDX, VOW, and/or Syndication. Recipients of this information shall not resell, redistribute, reproduce, modify, or otherwise copy any portion thereof without the expressed written consent of Canopy MLS.
Copyright 2026 Prime MLS, Inc. All rights reserved. This information is deemed reliable, but not guaranteed. The data relating to real estate displayed on this Site comes in part from the IDX Program of Prime MLS. The information being provided is for consumers’ personal, noncommercial use and may not be used for any purpose other than to identify prospective properties consumers may be interested in purchasing. Data last updated March 30, 2026
Popular searches near Davidson County, NC
Popular neighborhoods near Davidson County, NC
- British Woods, Winston Salem homes for sale
- Caroline Village, Winston Salem homes for sale
- Clemmons West, Clemmons homes for sale
- Crosswinds, Winston Salem homes for sale
- Easton, Winston Salem homes for sale
- Forest Glen, Salisbury homes for sale
- Green Needles Park, Lexington homes for sale
- Hampton Stead, Winston Salem homes for sale
- Heather Hills, Winston Salem homes for sale
- Hillcrest Towne Center, Winston Salem homes for sale
- Huntington Woods, Winston Salem homes for sale
- Janita Lakes Estates, Winston Salem homes for sale
- Kingstree, Winston Salem homes for sale
- Konnoak, Winston Salem homes for sale
- Meadowlands, Wallburg homes for sale
- Mountain Brook, Winston Salem homes for sale
- South View, Winston Salem homes for sale
- Steeplegate, Trinity homes for sale
- Twin Cedars Laurel Park, Winston Salem homes for sale
- Union Ridge, Winston Salem homes for sale
Zip codes near Davidson County, NC
- 27006 homes for sale
- 27012 homes for sale
- 27014 homes for sale
- 27054 homes for sale
- 27107 homes for sale
- 27127 homes for sale
- 27239 homes for sale
- 27262 homes for sale
- 27292 homes for sale
- 27295 homes for sale
- 27299 homes for sale
- 27360 homes for sale
- 27370 homes for sale
- 28039 homes for sale
- 28071 homes for sale
- 28137 homes for sale
- 28144 homes for sale
- 28146 homes for sale
- 28147 homes for sale
- 28159 homes for sale
Protect your home and budget from life's surprises with an Assurant Home Warranty, backed by a partner that supports you through every step of homeownership. Explore Plans.
©2026 Century 21 Real Estate LLC. All rights reserved. CENTURY 21®, the CENTURY 21 Logo and C21® are service marks owned by Century 21 Real Estate LLC. Century 21 Real Estate LLC fully supports the principles of the Fair Housing Act and the Equal Opportunity Act. Each office is independently owned and operated. Listing information is deemed reliable but not guaranteed accurate.