- Bayside, Everett homes for sale
- Boulevard Bluffs, Everett homes for sale
- Cascade View, Everett homes for sale
- Crosswater, Lake Stevens homes for sale
- East Sunnyside, Marysville homes for sale
- Evergreen, Everett homes for sale
- Getchell, Marysville homes for sale
- Glacier View, Everett homes for sale
- Harborview, Everett homes for sale
- Hat Island, Everett homes for sale
- Jennings Park, Marysville homes for sale
- Kellogg Marsh, Marysville homes for sale
- Lowell, Everett homes for sale
- Northwest Everett, Everett homes for sale
- Pinehurst, Everett homes for sale
- Pinewood, Marysville homes for sale
- Port Gardner, Everett homes for sale
- Riverside, Everett homes for sale
- South Forest Park, Everett homes for sale
- View Ridge Madison, Everett homes for sale
Delta, Everett, WA - homes for sale
2 of 2 results displayed
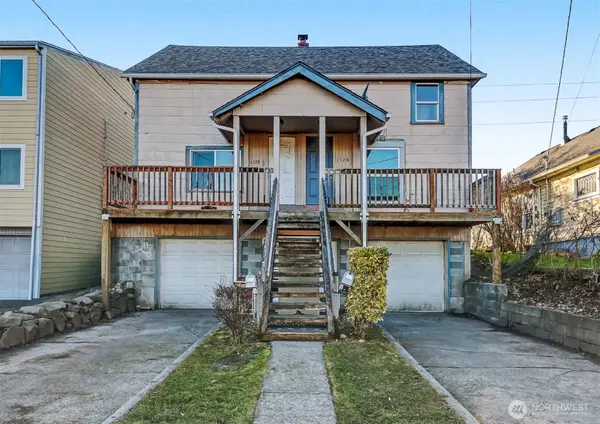 $599,950Pending-- beds -- baths1,824 sq. ft.
1328 Chestnut Street, Everett, WA 98201
MLS# 2483131Listed by: WINDERMERE REAL ESTATE CO.
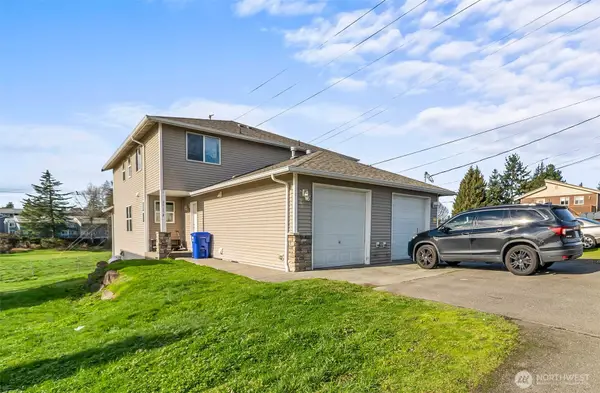 $825,000Pending-- beds -- baths3,172 sq. ft.
2905 11th Street #C & D, Everett, WA 98201
MLS# 2477562Listed by: THE PREVIEW GROUP
Local realty services provided by:CENTURY 21 Tri-Cities
Listings courtesy of Northwest MLS as distributed by MLS GRID. Based on information submitted to the MLS GRID as of April 1, 2026. All data is obtained from various sources and may not have been verified by broker or MLS GRID. Supplied Open House Information is subject to change without notice. All information should be independently reviewed and verified for accuracy. Properties may or may not be listed by the office/agent presenting the information. Listing information is provided for consumers' personal, non-commercial use, solely to identify prospective properties for potential purchase; all other use is strictly prohibited and may violate relevant federal and state law. Information deemed reliable but not guaranteed. Copyright © 2026 MLS GRID. All Rights Reserved.
Popular neighborhoods near Delta, Everett, WA
Zip codes near Delta, Everett, WA
- 98012 homes for sale
- 98021 homes for sale
- 98026 homes for sale
- 98036 homes for sale
- 98037 homes for sale
- 98087 homes for sale
- 98201 homes for sale
- 98203 homes for sale
- 98204 homes for sale
- 98206 homes for sale
- 98208 homes for sale
- 98236 homes for sale
- 98258 homes for sale
- 98260 homes for sale
- 98270 homes for sale
- 98271 homes for sale
- 98275 homes for sale
- 98290 homes for sale
- 98292 homes for sale
- 98296 homes for sale
Counties near Delta, Everett, WA
- Chelan County homes for sale
- Clallam County homes for sale
- Grays Harbor County homes for sale
- Island County homes for sale
- Jefferson County homes for sale
- King County homes for sale
- Kitsap County homes for sale
- Kittitas County homes for sale
- Lewis County homes for sale
- Mason County homes for sale
- Pierce County homes for sale
- San Juan County homes for sale
- Skagit County homes for sale
- Snohomish County homes for sale
- Thurston County homes for sale
- Whatcom County homes for sale
Protect your home and budget from life's surprises with an Assurant Home Warranty, backed by a partner that supports you through every step of homeownership. Explore Plans.
©2026 Century 21 Real Estate LLC. All rights reserved. CENTURY 21®, the CENTURY 21 Logo and C21® are service marks owned by Century 21 Real Estate LLC. Century 21 Real Estate LLC fully supports the principles of the Fair Housing Act and the Equal Opportunity Act. Each office is independently owned and operated. Listing information is deemed reliable but not guaranteed accurate.