- Buenna, Federal Way homes for sale
- Camelot, Auburn homes for sale
- Lake Dolloff, Auburn homes for sale
- Lakota, Federal Way homes for sale
- Marine Hills, Federal Way homes for sale
- McVan, Seattle homes for sale
- Mill Creek, Kent homes for sale
- Mirror Lake, Federal Way homes for sale
- North Hill, Seattle homes for sale
- O'Brien, Kent homes for sale
- Pacific Ridge, Seattle homes for sale
- Redondo, Seattle homes for sale
- Redondo, Federal Way homes for sale
- Riverview, Kent homes for sale
- Scenic Hill, Kent homes for sale
- Steel Lake, Federal Way homes for sale
- The Lakes, Kent homes for sale
- West Hill, Kent homes for sale
- Woodmont Beach, Seattle homes for sale
- Zenith, Seattle homes for sale
Des Moines, WA - homes for sale
7 of 7 results displayed
- New
 $299,000Active0.44 Acres
950 Woodmont Beach Road S, Des Moines, WA 98198
MLS# 2498197Listed by: REALOGICS SOTHEBY'S INT'L RLTY
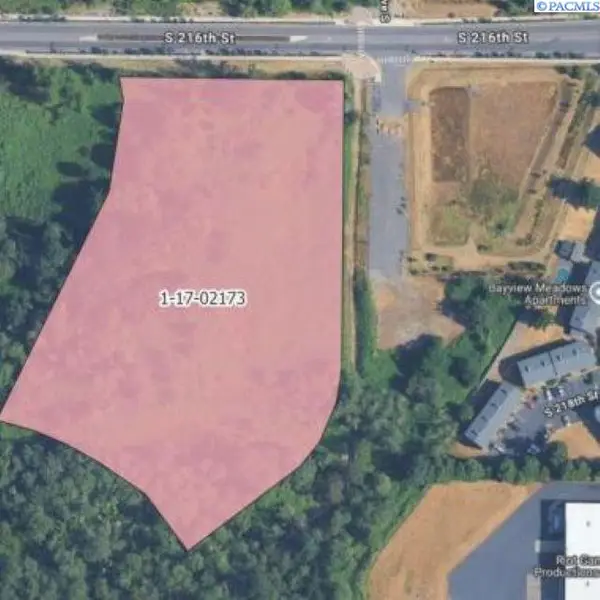 $5,350,000Active6.15 Acres
NKA 216th St, Des Moines, WA
MLS# 291293Listed by: PROFESSIONAL REALTY SERVICES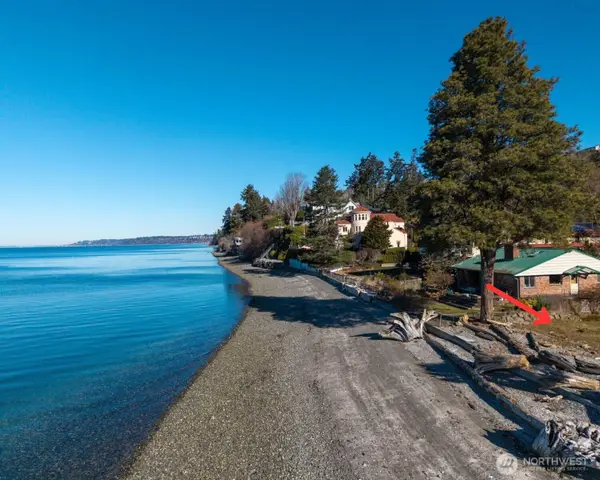 $999,950Active0.17 Acres
702 S 280th St, Des Moines, WA 98198
MLS# 2486127Listed by: JOHN L. SCOTT, INC. $149,500Active0.16 Acres
0 9th Avenue S, Des Moines, WA 98198
MLS# 2470667Listed by: WINDERMERE RE WEST CAMPUS INC $525,000Active0.19 Acres
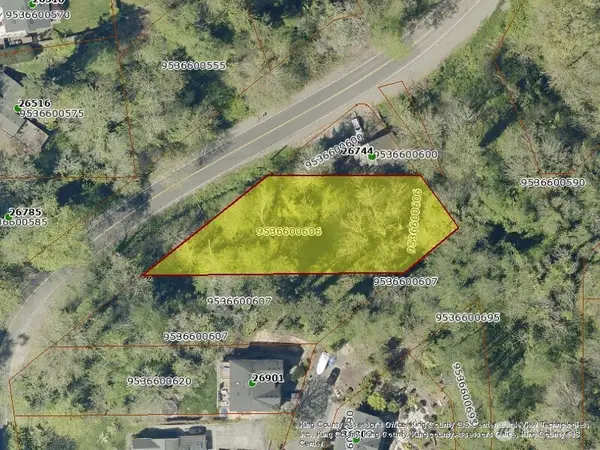
26409 7th Avenue S, Des Moines, WA 98198
MLS# 2406657Listed by: WINDERMERE RE WEST CAMPUS INC $325,000Active0.32 Acres
206 1st Place S #6-9, Des Moines, WA 98198
MLS# 2398111Listed by: RE/MAX ALL CITY $2,900,000Pending2.86 Acres
26505 Pacific Highway S, Des Moines, WA 98198
MLS# 2167753Listed by: CITY CLOSERS REAL ESTATE
Local realty services provided by:CENTURY 21 Real Estate Center, CENTURY 21 Tri-Cities
Listings courtesy of Northwest MLS as distributed by MLS GRID. Based on information submitted to the MLS GRID as of April 1, 2026. All data is obtained from various sources and may not have been verified by broker or MLS GRID. Supplied Open House Information is subject to change without notice. All information should be independently reviewed and verified for accuracy. Properties may or may not be listed by the office/agent presenting the information. Listing information is provided for consumers' personal, non-commercial use, solely to identify prospective properties for potential purchase; all other use is strictly prohibited and may violate relevant federal and state law. Information deemed reliable but not guaranteed. Copyright © 2026 MLS GRID. All Rights Reserved.
Neighborhoods near Des Moines, WA
Zip codes near Des Moines, WA
- 98001 homes for sale
- 98002 homes for sale
- 98003 homes for sale
- 98023 homes for sale
- 98030 homes for sale
- 98031 homes for sale
- 98032 homes for sale
- 98047 homes for sale
- 98055 homes for sale
- 98057 homes for sale
- 98070 homes for sale
- 98146 homes for sale
- 98148 homes for sale
- 98166 homes for sale
- 98168 homes for sale
- 98178 homes for sale
- 98188 homes for sale
- 98198 homes for sale
- 98354 homes for sale
- 98422 homes for sale
Popular searches near Des Moines, WA
- Algona homes for sale
- Auburn homes for sale
- Boulevard Park homes for sale
- Browns Point homes for sale
- Bryn Mawr-Skyway homes for sale
- Burien homes for sale
- Dash Point homes for sale
- Federal Way homes for sale
- Federal Way-Auburn homes for sale
- Fife Heights homes for sale
- Kent homes for sale
- Lakeland North homes for sale
- Lakeland South homes for sale
- Normandy Park homes for sale
- Renton homes for sale
- Seatac homes for sale
- Tukwila homes for sale
- Vashon homes for sale
- Vashon Island homes for sale
- White Center homes for sale
Protect your home and budget from life's surprises with an Assurant Home Warranty, backed by a partner that supports you through every step of homeownership. Explore Plans.
©2026 Century 21 Real Estate LLC. All rights reserved. CENTURY 21®, the CENTURY 21 Logo and C21® are service marks owned by Century 21 Real Estate LLC. Century 21 Real Estate LLC fully supports the principles of the Fair Housing Act and the Equal Opportunity Act. Each office is independently owned and operated. Listing information is deemed reliable but not guaranteed accurate.