Devers, TX - homes for sale
3 of 3 results displayed
 $125,000Active3 beds 2 baths1,415 sq. ft.
415 County Road 105, Devers, TX 77538
MLS# 2591937Listed by: VANDEVENTER, REALTORS $424,999Active3 beds 3 baths2,504 sq. ft.
203 Woodard S, Devers, TX 77538
MLS# 72950572Listed by: JLA REALTY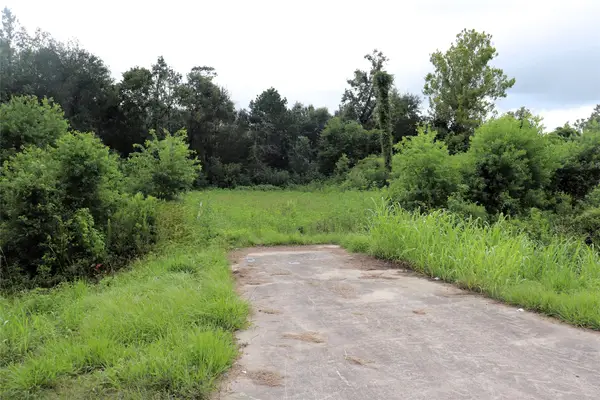
 $199,500Active2.89 Acres
2.8 ac Hwy 90, Devers, TX 77575
MLS# 20682986Listed by: CENTURY 21 PATTERSON AGENCY
Local realty services provided by:CENTURY 21 Lucky Money Real Estate, CENTURY 21 Gold Coat Realtors
Copyright 2025, Houston Realtors Information Service, Inc. All information provided is deemed reliable but is not guaranteed and should be independently verified. IDX information is provided exclusively for consumers' personal, non-commercial use, it may not be used for any purpose other than to identify prospective properties consumers may be interested in purchasing, and the data is deemed reliable but is not guaranteed accurate by the MLS.
Information provided, in part, by North Texas Real Estate Information Systems, Inc. Last Updated December 18, 2025 Listings with the NTREIS logo are listed by brokerages other than CENTURY 21 Gold Coat Realtors.
©2025 Century 21 Real Estate LLC. All rights reserved. CENTURY 21®, the CENTURY 21 Logo and C21® are service marks owned by Century 21 Real Estate LLC. Century 21 Real Estate LLC fully supports the principles of the Fair Housing Act and the Equal Opportunity Act. Each office is independently owned and operated. Listing information is deemed reliable but not guaranteed accurate.
©2025 Century 21 Real Estate LLC. All rights reserved. CENTURY 21®, the CENTURY 21 Logo and C21® are service marks owned by Century 21 Real Estate LLC. Century 21 Real Estate LLC fully supports the principles of the Fair Housing Act and the Equal Opportunity Act. Each office is independently owned and operated. Listing information is deemed reliable but not guaranteed accurate.