- Belle Meade Links, Nashville homes for sale
- Bellevue, Nashville homes for sale
- Centenary, Nashville homes for sale
- Charlotte Park, Nashville homes for sale
- Eagle Ridge at the Reserve, Nashville homes for sale
- Fieldstone Farms, Franklin homes for sale
- Harpeth Valley Park, Nashville homes for sale
- Hillwood, Nashville homes for sale
- Marrowbone, Joelton homes for sale
- Poplar Creek Estates, Nashville homes for sale
- Riverwalk, Nashville homes for sale
- Robertson, Nashville homes for sale
- Scottsboro, Nashville homes for sale
- South Harpeth Area, Nashville homes for sale
- Temple Hills, Franklin homes for sale
- West Meade, Nashville homes for sale
- West Meade Park, Nashville homes for sale
- Westhaven, Franklin homes for sale
- White Bridge, Nashville homes for sale
- Whites Bend, Nashville homes for sale
Dickson, TN - homes for sale
147 of 147 results displayed
- New
 $429,900Active3 beds 3 baths2,072 sq. ft.
108 Lake Valley Road, Dickson, TN 37055
MLS# 3165762Listed by: PARKER PEERY PROPERTIES - New
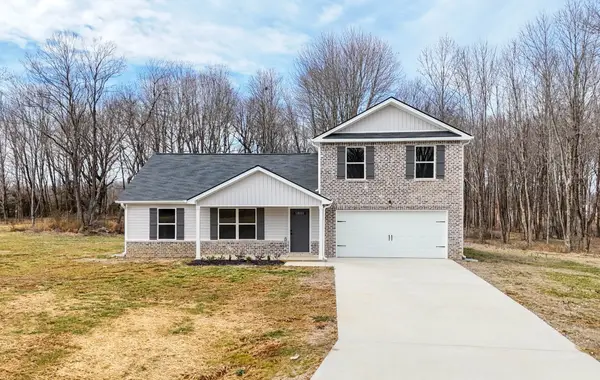 $426,900Active4 beds 3 baths1,887 sq. ft.
103 Cherry Blossom Way, Dickson, TN 37055
MLS# 3164874Listed by: TENNESSEE FAMILY ONE REAL ESTATE - New
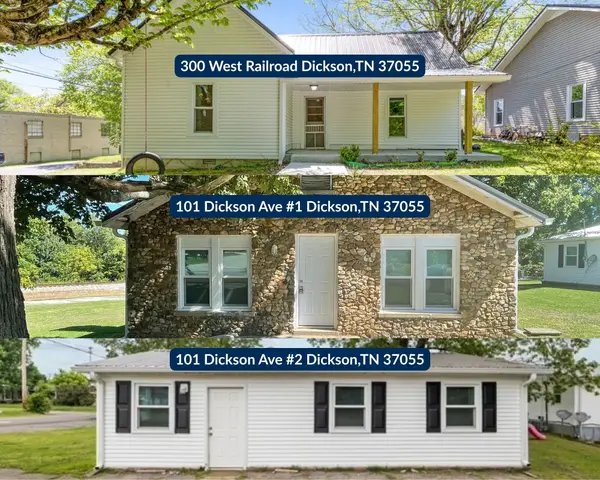 $675,000Active3 beds 2 baths1,132 sq. ft.
300 W Railroad St, Dickson, TN 37055
MLS# 3164597Listed by: REALTY EXECUTIVES HOMETOWN LIVING - Coming Soon
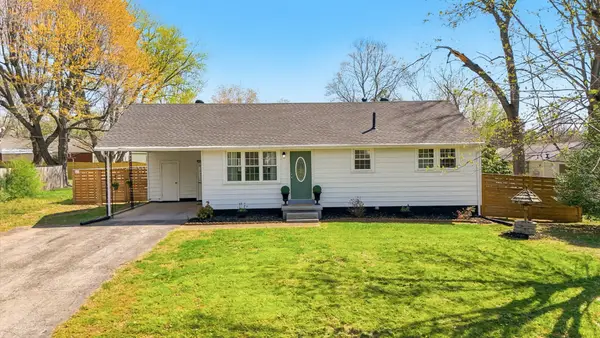 $259,900Coming Soon3 beds 1 baths
1012 N Charlotte St, Dickson, TN 37055
MLS# 3164433Listed by: SIMPLIHOM - New
 $939,000Active5 beds 3 baths3,055 sq. ft.
524 Country Club Dr, Dickson, TN 37055
MLS# 3164183Listed by: THE LUXE COLLECTIVE - Open Fri, 11am to 1pmNew
 $390,000Active3 beds 3 baths1,971 sq. ft.
714 Monarchos Bnd, Burns, TN 37029
MLS# 3164000Listed by: BENCHMARK REALTY, LLC - New
 $289,900Active3 beds 2 baths1,050 sq. ft.
123 Hogin Rd, Dickson, TN 37055
MLS# 3160184Listed by: E4 REAL ESTATE GROUP, LLC - New
 $185,000Active2 beds 1 baths930 sq. ft.
116 Skyline Dr, Dickson, TN 37055
MLS# 3160091Listed by: REALTY EXECUTIVES HOMETOWN LIVING - New
 $314,900Active3 beds 2 baths1,188 sq. ft.
1450 Pomona Rd, Dickson, TN 37055
MLS# 3159254Listed by: RED BIRD REALTY - New
 $339,900Active3 beds 3 baths2,018 sq. ft.
110 Redbud Dr, Dickson, TN 37055
MLS# 3159455Listed by: REALTY EXECUTIVES HOMETOWN LIVING  $488,900Pending4 beds 3 baths2,350 sq. ft.
114 Cherry Blossom Way, Dickson, TN 37055
MLS# 3159572Listed by: TENNESSEE FAMILY ONE REAL ESTATE- New
 $679,900Active4 beds 3 baths2,618 sq. ft.
414 West College Street, Dickson, TN 37055
MLS# 3159234Listed by: PARKER PEERY PROPERTIES - New
 $420,000Active3 beds 2 baths1,743 sq. ft.
1001 Stonebrook Dr, Dickson, TN 37055
MLS# 3159236Listed by: THE HUFFAKER GROUP, LLC - New
 $365,000Active3 beds 2 baths1,398 sq. ft.
1016 Northside Dr, Dickson, TN 37055
MLS# 3156436Listed by: EXP REALTY - New
 $299,900Active3 beds 2 baths1,260 sq. ft.
116 Friar Tuck Drive, Dickson, TN 37055
MLS# 3158421Listed by: RAGAN'S FIVE RIVERS REALTY &  $210,000Active2 beds 1 baths932 sq. ft.
1155 Westfield Rd, Dickson, TN 37055
MLS# 3155418Listed by: PARKER PEERY PROPERTIES $474,990Pending3 beds 4 baths2,364 sq. ft.
412 E Rickert Ave, Dickson, TN 37055
MLS# 3155265Listed by: COMPASS RE $99,000Pending-- beds -- baths1,209 sq. ft.
503 Old Highway 46 S, Dickson, TN 37055
MLS# 3154835Listed by: COLDWELL BANKER CONROY, MARABLE & HOLLEMAN $259,900Active3 beds 1 baths1,050 sq. ft.
115 Spanish Ct, Dickson, TN 37055
MLS# 3153237Listed by: KELLER WILLIAMS REALTY - MURFREESBORO $335,000Active3 beds 2 baths1,256 sq. ft.
2061/2 S Hummingbird Ln, Dickson, TN 37055
MLS# 3152827Listed by: COMPASS RE $279,000Active3 beds 1 baths1,175 sq. ft.
104 W Chestnut St, Dickson, TN 37055
MLS# 3149728Listed by: BENCHMARK REALTY, LLC $295,500Active4 beds 2 baths2,000 sq. ft.
420 High St, Dickson, TN 37055
MLS# 3149637Listed by: CRYE-LEIKE, INC., REALTORS $319,900Active3 beds 2 baths1,088 sq. ft.
110 Old Pond Ln, Dickson, TN 37055
MLS# 3149257Listed by: ROLLING HILLS REALTY $1,500,000Active3 beds 5 baths3,930 sq. ft.
1585 Jones Creek Rd, Dickson, TN 37055
MLS# 3149261Listed by: BENCHMARK REALTY, LLC $329,000Active3 beds 2 baths1,346 sq. ft.
206 Hickory Pointe, Dickson, TN 37055
MLS# 3148469Listed by: REDFIN $337,000Active3 beds 2 baths1,510 sq. ft.
218 Quail Ct, Dickson, TN 37055
MLS# 3148203Listed by: BEYCOME BROKERAGE REALTY, LLC $1,800,000Active2 beds 1 baths748 sq. ft.
112 Cowan Road, Dickson, TN 37055
MLS# 3147455Listed by: BENCHMARK REALTY, LLC $350,000Active4 beds 2 baths1,328 sq. ft.
402 W Railroad St, Dickson, TN 37055
MLS# 3146709Listed by: BE HOME REALTY, LLC $254,900Active2 beds 2 baths1,000 sq. ft.
152 Eno Rd, Dickson, TN 37055
MLS# 3145939Listed by: SIMPLIHOM- Open Sat, 1 to 3pm
 $249,000Active2 beds 1 baths891 sq. ft.
103 Freeman Ave, Dickson, TN 37055
MLS# 3145777Listed by: SIMPLIHOM  $454,900Active3 beds 3 baths1,900 sq. ft.
640 Whirlaway Dr, Burns, TN 37029
MLS# 3145797Listed by: SIMPLIHOM $395,000Active3 beds 2 baths2,099 sq. ft.
2015 Highway 70 W, Dickson, TN 37055
MLS# 3145530Listed by: PARKER PEERY PROPERTIES $985,000Active4 beds 3 baths3,212 sq. ft.
990 E Piney Rd, Dickson, TN 37055
MLS# 3145380Listed by: ATWOOD REALTY LLC $319,000Active3 beds 2 baths1,300 sq. ft.
103C Oak Park Dr, Dickson, TN 37055
MLS# 3143445Listed by: THE BAKER BROKERAGE $235,000Active3 beds 1 baths1,050 sq. ft.
108 Nottingham Rd, Dickson, TN 37055
MLS# 3143430Listed by: ADVANTAGE AUCTIONS $334,990Pending3 beds 3 baths1,401 sq. ft.
118 Florence Cove, Burns, TN 37029
MLS# 3139200Listed by: DSLD HOMES (SOUTHEAST), LLC $250,000Active2 beds 1 baths864 sq. ft.
100 Oak Dr, Dickson, TN 37055
MLS# 3138822Listed by: ORCHARD BROKERAGE, LLC $256,000Pending3 beds 2 baths1,736 sq. ft.
1003 Edgewood Dr, Dickson, TN 37055
MLS# 3138625Listed by: CUMBERLAND REAL ESTATE LLC $424,900Active4 beds 3 baths2,088 sq. ft.
833 Blakemore Rd, Dickson, TN 37055
MLS# 3138173Listed by: THE BAKER BROKERAGE $385,000Active3 beds 3 baths2,072 sq. ft.
611 Whirlaway Dr, Burns, TN 37029
MLS# 3137680Listed by: REALTY EXECUTIVES HOMETOWN LIVING $395,400Active3 beds 2 baths1,546 sq. ft.
126 Robin Hood Rd, Dickson, TN 37055
MLS# 3137364Listed by: CRYE-LEIKE, INC., REALTORS $659,900Active3 beds 2 baths1,303 sq. ft.
150 Sylvis Rd, Dickson, TN 37055
MLS# 3136800Listed by: AVENUE REALTY GROUP $249,000Active3 beds 2 baths1,650 sq. ft.
120 Ravenwood Cir, Dickson, TN 37055
MLS# 3136668Listed by: CRYE-LEIKE, INC., REALTORS $388,000Active3 beds 2 baths1,512 sq. ft.
1007 Edgewood Dr, Dickson, TN 37055
MLS# 3135861Listed by: ZEITLIN SOTHEBY'S INTERNATIONAL REALTY $319,999Active3 beds 2 baths1,196 sq. ft.
116 Eno Rd, Dickson, TN 37055
MLS# 3135623Listed by: CRYE-LEIKE, INC., REALTORS $349,999Active4 beds 2 baths1,700 sq. ft.
121 Marilyn Dr, Dickson, TN 37055
MLS# 3068542Listed by: REALTY ONE GROUP MUSIC CITY $774,900Active4 beds 3 baths2,800 sq. ft.
534 Country Club Dr, Dickson, TN 37055
MLS# 3112040Listed by: PARKER PEERY PROPERTIES $699,900Active3 beds 3 baths2,988 sq. ft.
202A West College Street #4, Dickson, TN 37055
MLS# 3128933Listed by: PARKER PEERY PROPERTIES $1,050,000Active3 beds 4 baths3,060 sq. ft.
445 Old Pond Ln, Dickson, TN 37055
MLS# 3119314Listed by: PARKER PEERY PROPERTIES $784,900Active3 beds 1 baths1,394 sq. ft.
155 W Piney Rd, Dickson, TN 37055
MLS# 3134547Listed by: MOSSY OAK PROPERTIES CLARKSVILLE, TN LAND & FARM $439,999Active3 beds 3 baths2,202 sq. ft.
212 Wyburn Pl, Burns, TN 37029
MLS# 3132625Listed by: KELLER WILLIAMS REALTY NASHVILLE/FRANKLIN $394,900Active3 beds 2 baths1,528 sq. ft.
1135 High Lake Dr, Dickson, TN 37055
MLS# 3132638Listed by: SIMPLIHOM $714,000Active3 beds 4 baths3,196 sq. ft.
228 Druid Hills Dr, Dickson, TN 37055
MLS# 3133921Listed by: BENCHMARK REALTY, LLC $389,000Active3 beds 3 baths2,036 sq. ft.
614 Whirlaway Dr, Burns, TN 37029
MLS# 3133682Listed by: CRYE-LEIKE, INC., REALTORS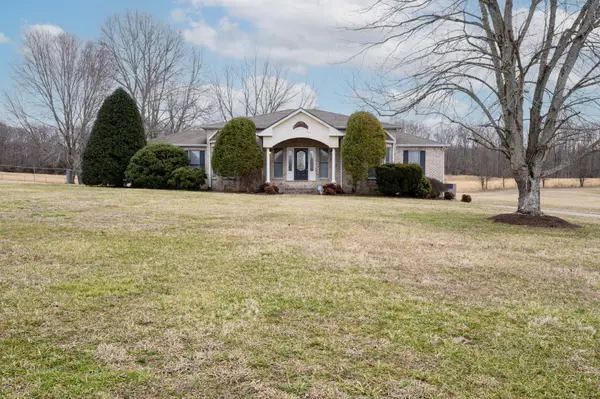 $399,900Active3 beds 3 baths1,991 sq. ft.
205 Meadowlark Ct, Dickson, TN 37055
MLS# 3133270Listed by: MATT SARGENT HOMES $365,000Pending3 beds 2 baths1,589 sq. ft.
101 Jessikas Pl, Dickson, TN 37055
MLS# 3133182Listed by: COMPASS $299,900Active3 beds 2 baths1,215 sq. ft.
105 Sherry Ln, Dickson, TN 37055
MLS# 3133076Listed by: REALTY EXECUTIVES HOMETOWN LIVING $429,900Pending3 beds 2 baths1,888 sq. ft.
507 Mandalorian Way, Dickson, TN 37055
MLS# 3131027Listed by: REYES REAL ESTATE GROUP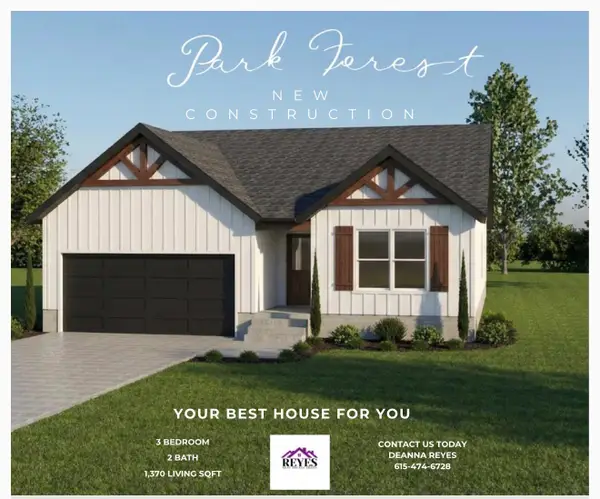 $379,900Active3 beds 2 baths1,370 sq. ft.
509 Mandalorian Way, Dickson, TN 37055
MLS# 3131028Listed by: REYES REAL ESTATE GROUP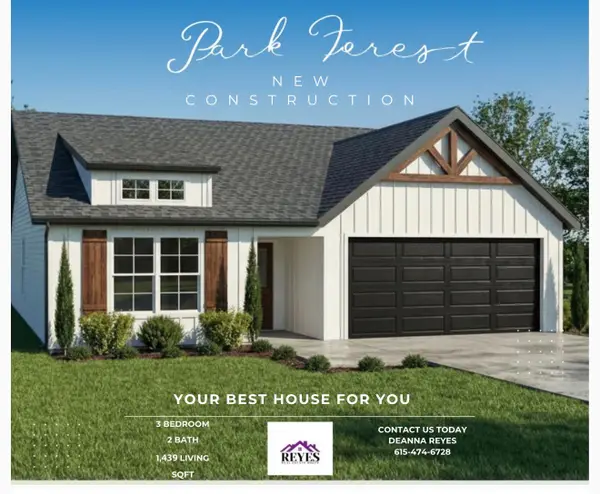 $379,900Pending3 beds 2 baths1,439 sq. ft.
503 Mandalorian Way, Dickson, TN 37055
MLS# 3131029Listed by: REYES REAL ESTATE GROUP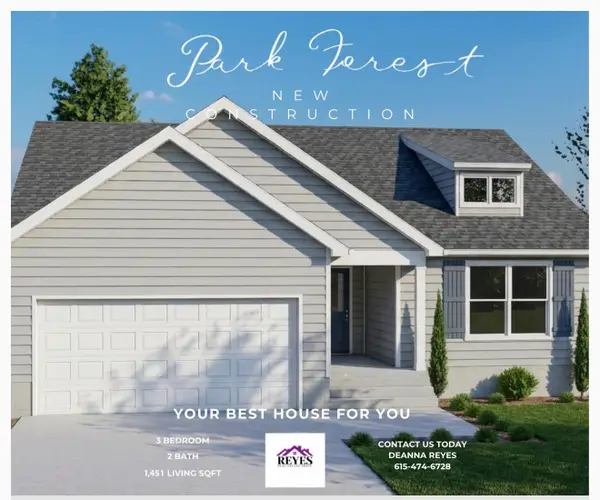 $379,900Active3 beds 2 baths1,451 sq. ft.
505 Mandalorian Way, Dickson, TN 37055
MLS# 3131030Listed by: REYES REAL ESTATE GROUP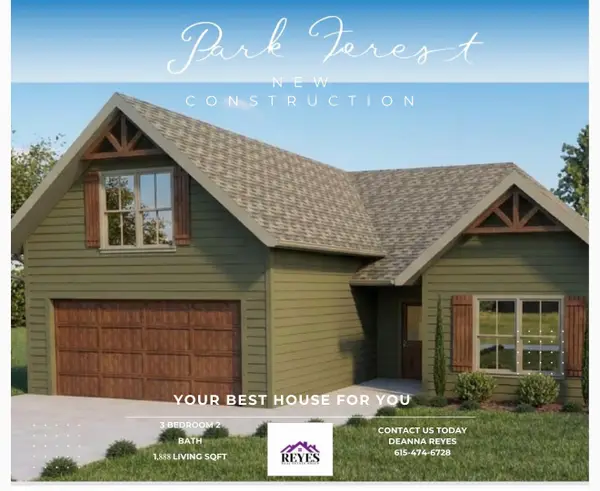 $429,900Active3 beds 2 baths1,888 sq. ft.
501 Mandalorian Way, Dickson, TN 37055
MLS# 3131031Listed by: REYES REAL ESTATE GROUP $254,900Active2 beds 1 baths1,023 sq. ft.
402 S Mulberry St, Dickson, TN 37055
MLS# 3129451Listed by: SIXONEFIVE REAL ESTATE ADVISORS $574,900Active3 beds 3 baths2,674 sq. ft.
1024 E Piney Rd, Dickson, TN 37055
MLS# 3130609Listed by: RELIANT REALTY ERA POWERED $319,900Active3 beds 2 baths1,198 sq. ft.
69 Truform Way, Dickson, TN 37055
MLS# 3130459Listed by: PARKER PEERY PROPERTIES $319,900Active3 beds 2 baths1,208 sq. ft.
57 Truform Way, Dickson, TN 37055
MLS# 3130463Listed by: PARKER PEERY PROPERTIES $315,000Active3 beds 2 baths1,082 sq. ft.
146 Eno Rd, Dickson, TN 37055
MLS# 3145204Listed by: BLUE DOOR REALTY GROUP $1,100,000Active3 beds 3 baths2,640 sq. ft.
712 Highway 48 S, Dickson, TN 37055
MLS# 3128026Listed by: CRYE-LEIKE, INC., REALTORS $429,900Active3 beds 2 baths1,790 sq. ft.
101 Morgan Lane, Dickson, TN 37055
MLS# 3127682Listed by: REYES REAL ESTATE GROUP $389,900Pending3 beds 2 baths1,564 sq. ft.
103 Morgan Lane, Dickson, TN 37055
MLS# 3127697Listed by: REYES REAL ESTATE GROUP $239,900Active3 beds 1 baths1,210 sq. ft.
2237 Highway 47 E, Dickson, TN 37055
MLS# 3113070Listed by: PARKER PEERY PROPERTIES $344,900Active3 beds 2 baths1,352 sq. ft.
1003 Autumnwood Dr, Dickson, TN 37055
MLS# 3122214Listed by: GATEWAY SOUTH REAL ESTATE $255,000Active3 beds 1 baths1,050 sq. ft.
105 Mae Cir, Dickson, TN 37055
MLS# 3122093Listed by: BERKSHIRE HATHAWAY HOMESERVICES WOODMONT REALTY $439,000Active3 beds 3 baths2,512 sq. ft.
161 Caraway Court, Dickson, TN 37055
MLS# 3121664Listed by: LEGG AND COMPANY $435,000Active3 beds 3 baths2,224 sq. ft.
101 W Hills Terrace, Dickson, TN 37055
MLS# 3119239Listed by: RAGAN'S FIVE RIVERS REALTY & $849,900Active3 beds 3 baths2,500 sq. ft.
0 Old Pond Lane, Dickson, TN 37055
MLS# 3118762Listed by: ROLLING HILLS REALTY $459,900Active3 beds 3 baths2,630 sq. ft.
251 Rouse Rd, Dickson, TN 37055
MLS# 3118732Listed by: E4 REAL ESTATE GROUP, LLC $369,900Pending3 beds 2 baths1,340 sq. ft.
504 Mandalorian Way, Dickson, TN 37055
MLS# 3112126Listed by: REYES REAL ESTATE GROUP $379,900Pending3 beds 2 baths1,425 sq. ft.
508 Mandalorian Way, Dickson, TN 37055
MLS# 3112127Listed by: REYES REAL ESTATE GROUP $1,225,000Active4 beds 4 baths3,285 sq. ft.
1000 Sendero Bad, Dickson, TN 37055
MLS# 3111153Listed by: EXP REALTY $350,000Active3 beds 2 baths1,281 sq. ft.
108 W Quail Hollow Way, Dickson, TN 37055
MLS# 3098712Listed by: COMPASS $318,900Active3 beds 2 baths1,207 sq. ft.
422 Shady Hill Road, Dickson, TN 37055
MLS# 3098391Listed by: CRYE-LEIKE, INC., REALTORS $339,900Active4 beds 3 baths2,338 sq. ft.
155 Ravenwood Cir, Dickson, TN 37055
MLS# 3098019Listed by: BENCHMARK REALTY, LLC $389,999Active4 beds 2 baths1,920 sq. ft.
103 Mack St, Dickson, TN 37055
MLS# 3079369Listed by: PARKER PEERY PROPERTIES $389,000Active3 beds 2 baths1,204 sq. ft.
1241 Harmon Springs Rd, Dickson, TN 37055
MLS# 3079296Listed by: PARKER PEERY PROPERTIES $315,000Active3 beds 2 baths1,100 sq. ft.
120 Robin Hood Road, Dickson, TN 37055
MLS# 3078443Listed by: CHARLES WOODARD & ASSOCIATES $438,500Active3 beds 2 baths3,443 sq. ft.
211 W Hills Ter, Dickson, TN 37055
MLS# 3073716Listed by: THE SAPPHIRE GROUP REAL ESTATE $318,000Active3 beds 2 baths1,198 sq. ft.
1118C W First Street, Dickson, TN 37055
MLS# 3144946Listed by: SIMPLIHOM $394,900Active3 beds 2 baths1,803 sq. ft.
115 Sherron Dr, Dickson, TN 37055
MLS# 3071014Listed by: CANNONTOWN REAL ESTATE $499,900Active4 beds 3 baths2,550 sq. ft.
1022 Belmont Dr, Dickson, TN 37055
MLS# 3069928Listed by: REALTY EXECUTIVES HOMETOWN LIVING $299,500Active2 beds 2 baths1,156 sq. ft.
501 Caraway Ct, Dickson, TN 37055
MLS# 3067818Listed by: PATRIOT REALTY USA CAMDEN $284,000Active2 beds 2 baths1,300 sq. ft.
202 Parkway W, Dickson, TN 37055
MLS# 3067333Listed by: RE/MAX CHOICE PROPERTIES $375,000Active3 beds 3 baths1,770 sq. ft.
2054 Ridgecrest Cir, Dickson, TN 37055
MLS# 3060143Listed by: PARKER PEERY PROPERTIES $675,000Active6 beds 5 baths3,634 sq. ft.
307 Crestview Dr, Dickson, TN 37055
MLS# 3057840Listed by: HAYDEN OUTDOORS LLC $282,000Active3 beds 2 baths1,510 sq. ft.
909 West 1st Street, Dickson, TN 37055
MLS# 3069159Listed by: BENCHMARK REALTY, LLC $275,000Active4 beds 2 baths2,319 sq. ft.
110 Mccreary Hts, Dickson, TN 37055
MLS# 3051380Listed by: COMPASS RE $349,900Active3 beds 2 baths1,271 sq. ft.
1021 Woodmont Dr, Dickson, TN 37055
MLS# 3147913Listed by: BENCHMARK REALTY, LLC $449,900Active4 beds 3 baths2,131 sq. ft.
101 Southwood Dr, Dickson, TN 37055
MLS# 3050884Listed by: RAGAN'S FIVE RIVERS REALTY & $457,900Active4 beds 3 baths2,403 sq. ft.
108 Cherry Blossom Way, Dickson, TN 37055
MLS# 3153000Listed by: TENNESSEE FAMILY ONE REAL ESTATE $415,000Active3 beds 3 baths1,901 sq. ft.
408 Barbaro Ct, Burns, TN 37029
MLS# 3047782Listed by: REALTY EXECUTIVES HOMETOWN LIVING $390,000Active3 beds 2 baths1,677 sq. ft.
303 Wyburn Pl, Burns, TN 37029
MLS# 3047726Listed by: MARK SPAIN REAL ESTATE $680,000Active4 beds 4 baths3,000 sq. ft.
2008 Oldham Ter, Dickson, TN 37055
MLS# 3045815Listed by: BENCHMARK REALTY, LLC $349,000Pending3 beds 2 baths1,470 sq. ft.
1345 Nails Creek Rd, Dickson, TN 37055
MLS# 3043078Listed by: NATCHEZ TRACE REALTY, LLC- Open Sat, 12 to 2pm
 $372,576Active3 beds 2 baths1,333 sq. ft.
213 Sandalwood Way, Dickson, TN 37055
MLS# 3041899Listed by: CRYE-LEIKE, INC., REALTORS - Open Sat, 12 to 2pm
 $359,900Active3 beds 2 baths1,352 sq. ft.
207 Sandalwood Way, Dickson, TN 37055
MLS# 3041861Listed by: CRYE-LEIKE, INC., REALTORS - Open Sat, 12 to 2pm
 $366,048Active3 beds 2 baths1,309 sq. ft.
211 Sandalwood Way, Dickson, TN 37055
MLS# 3041889Listed by: CRYE-LEIKE, INC., REALTORS - Open Sat, 12 to 2pm
 $398,208Active3 beds 2 baths1,464 sq. ft.
209 Sandalwood Way, Dickson, TN 37055
MLS# 3041830Listed by: CRYE-LEIKE, INC., REALTORS  $249,900Active4 beds 1 baths1,592 sq. ft.
122 Pond Rd, Dickson, TN 37055
MLS# 3041288Listed by: E4 REAL ESTATE GROUP, LLC $484,900Active4 beds 4 baths2,622 sq. ft.
207 Robinson Dr, Dickson, TN 37055
MLS# 3130384Listed by: BENCHMARK REALTY, LLC $649,999Active3 beds 3 baths2,720 sq. ft.
1222 Rock Church Rd, Dickson, TN 37055
MLS# 3123243Listed by: REALTY EXECUTIVES HOMETOWN LIVING $279,900Active3 beds 2 baths1,196 sq. ft.
108 Eno Rd, Dickson, TN 37055
MLS# 3033289Listed by: RELIANT REALTY ERA POWERED $785,000Active3 beds 3 baths2,712 sq. ft.
1381 Turkey Creek Rd, Dickson, TN 37055
MLS# 3014122Listed by: RAGAN'S FIVE RIVERS REALTY & $424,900Pending4 beds 3 baths1,887 sq. ft.
106 Cherry Blossom Way, Dickson, TN 37055
MLS# 3012943Listed by: TENNESSEE FAMILY ONE REAL ESTATE $464,900Active4 beds 3 baths2,350 sq. ft.
101 Cherry Blossom Way, Dickson, TN 37055
MLS# 3148794Listed by: TENNESSEE FAMILY ONE REAL ESTATE $299,000Active3 beds 2 baths1,120 sq. ft.
2305 Highway 47 E, Dickson, TN 37055
MLS# 3139456Listed by: REALTY EXECUTIVES HOMETOWN LIVING $619,000Active4 beds 2 baths2,120 sq. ft.
454 Gum Branch Rd, Burns, TN 37029
MLS# 3138213Listed by: PARKER PEERY PROPERTIES $200,000Pending3 beds 1 baths1,050 sq. ft.
118 Spanish Ct, Dickson, TN 37055
MLS# 2996469Listed by: KELLER WILLIAMS REALTY - MURFREESBORO $400,000Active4 beds 3 baths2,390 sq. ft.
1627 W Grab Creek Rd, Dickson, TN 37055
MLS# 3000868Listed by: ONWARD REAL ESTATE $394,900Pending4 beds 4 baths1,757 sq. ft.
1031 Northside Dr, Dickson, TN 37055
MLS# 3093585Listed by: EXIT REALTY ECLIPSE $295,000Pending3 beds 2 baths1,280 sq. ft.
701 W 5th Street, Dickson, TN 37055
MLS# 2995341Listed by: RAGAN'S FIVE RIVERS REALTY & $349,999Active3 beds 3 baths2,174 sq. ft.
422 High St, Dickson, TN 37055
MLS# 2975546Listed by: NEIGHBORHOOD REALTORS $989,900Active4 beds 4 baths3,867 sq. ft.
500 Country Club Dr, Dickson, TN 37055
MLS# 3136194Listed by: PARKER PEERY PROPERTIES $429,900Active4 beds 3 baths1,838 sq. ft.
102 Cherry Blossom Way, Dickson, TN 37055
MLS# 3143417Listed by: TENNESSEE FAMILY ONE REAL ESTATE $410,000Pending4 beds 2 baths2,605 sq. ft.
614 Jones Creek Rd, Dickson, TN 37055
MLS# 2964032Listed by: HISTORIC & DISTINCTIVE HOMES, LLC $205,000Pending3 beds 2 baths2,016 sq. ft.
501 High St #A, Dickson, TN 37055
MLS# 2945271Listed by: AVENUE REALTY GROUP $349,900Active3 beds 3 baths2,159 sq. ft.
101 Lake Circle Dr, Dickson, TN 37055
MLS# 3098468Listed by: DUE SOUTH REALTY, LLC $535,000Active4 beds 4 baths3,200 sq. ft.
103 Forrest Hills Dr, Dickson, TN 37055
MLS# 2884018Listed by: CRYE-LEIKE, INC., REALTORS $400,000Active3 beds 2 baths1,283 sq. ft.
1211 N Charlotte St, Dickson, TN 37055
MLS# 3097827Listed by: CLARKSVILLEHOMEOWNER.COM $342,000Active2 beds 2 baths1,531 sq. ft.
430 Center Ave, Dickson, TN 37055
MLS# 2796766Listed by: CHORD REAL ESTATE $308,000Active3 beds 2 baths1,100 sq. ft.
210 Hardin Ave, Dickson, TN 37055
MLS# 3098465Listed by: KELLER WILLIAMS REALTY NASHVILLE/FRANKLIN $650,000Active4 beds 2 baths2,984 sq. ft.
412 Kaiser Rd, Dickson, TN 37055
MLS# 2612653Listed by: REALTY EXECUTIVES HOMETOWN LIVING $329,900Active3 beds 2 baths1,271 sq. ft.
1021 Woodmont Dr, Dickson, TN 37055
MLS# 2610435Listed by: VISION REALTY PARTNERS, LLC $419,900Active3 beds 2 baths1,400 sq. ft.
204 Canary Drive Lot 2, Dickson, TN 37055
MLS# 2610142Listed by: PARKER PEERY PROPERTIES $1,049,000Active3 beds 3 baths2,640 sq. ft.
712 Hwy 48 South, Dickson, TN 37055
MLS# 2606287Listed by: PARKER PEERY PROPERTIES $439,900Active3 beds 2 baths1,745 sq. ft.
2855 Highway 70 E, Dickson, TN 37055
MLS# 2602473Listed by: CRYE-LEIKE, INC., REALTORS $295,000Active2 beds 2 baths1,256 sq. ft.
1465 W Grab Creek Rd, Dickson, TN 37055
MLS# 2602301Listed by: BERNIE GALLERANI REAL ESTATE $259,900Active4 beds 2 baths1,956 sq. ft.
201 Clement Dr, Dickson, TN 37055
MLS# 2594971Listed by: PARKER PEERY PROPERTIES $329,900Active3 beds 2 baths1,456 sq. ft.
116 Meadow Dr, Dickson, TN 37055
MLS# 2594735Listed by: BENCHMARK REALTY, LLC $424,900Active5 beds 3 baths2,529 sq. ft.
205 Valley Road, Dickson, TN 37055
MLS# 2591952Listed by: CRYE-LEIKE, INC., REALTORS $419,900Active3 beds 2 baths1,400 sq. ft.
204 Canary Drive Lot 2, Dickson, TN 37055
MLS# 2591588Listed by: PARKER PEERY PROPERTIES $355,000Active3 beds 2 baths1,323 sq. ft.
1268 Ridgecrest Drive, Dickson, TN 37055
MLS# 2588621Listed by: SIMPLIHOM $330,000Active3 beds 2 baths1,208 sq. ft.
1282 Ridgecrest Drive, Dickson, TN 37055
MLS# 2588624Listed by: SIMPLIHOM $299,998Active3 beds 3 baths1,167 sq. ft.
119 Batey Cir, Dickson, TN 37055
MLS# 2586138Listed by: REALTY EXECUTIVES HOMETOWN LIVING $339,999Active4 beds 3 baths1,625 sq. ft.
117 Silver Leaf Cir, Dickson, TN 37055
MLS# 2579702Listed by: RED BIRD REALTY $369,900Active3 beds 3 baths1,896 sq. ft.
2761 Highway 70 E, Dickson, TN 37055
MLS# 2573613Listed by: PARKER PEERY PROPERTIES $1,100,000Active3 beds 3 baths2,640 sq. ft.
712 Hwy 48 South, Dickson, TN 37055
MLS# 2570517Listed by: PARKER PEERY PROPERTIES $554,880Active3 beds 2 baths1,920 sq. ft.
656 East Piney Rd, Dickson, TN 37055
MLS# 2569209Listed by: THE REALTY ASSOCIATION
Local realty services provided by:CENTURY 21 Premier
Neighborhoods near Dickson, TN
Zip codes near Dickson, TN
- 37015 homes for sale
- 37025 homes for sale
- 37029 homes for sale
- 37036 homes for sale
- 37051 homes for sale
- 37052 homes for sale
- 37055 homes for sale
- 37061 homes for sale
- 37062 homes for sale
- 37082 homes for sale
- 37098 homes for sale
- 37101 homes for sale
- 37137 homes for sale
- 37143 homes for sale
- 37171 homes for sale
- 37181 homes for sale
- 37187 homes for sale
- 37221 homes for sale
- 38454 homes for sale
- 38476 homes for sale
Popular searches near Dickson, TN
- Ashland City homes for sale
- Bon Aqua homes for sale
- Bon Aqua Junction homes for sale
- Burns homes for sale
- Centerville homes for sale
- Charlotte homes for sale
- Cumberland Furnace homes for sale
- Cunningham homes for sale
- Fairview homes for sale
- Kingston Springs homes for sale
- Lyles homes for sale
- McEwen homes for sale
- Nunnelly homes for sale
- Pegram homes for sale
- Primm Springs homes for sale
- Slayden homes for sale
- Southside homes for sale
- Vanleer homes for sale
- Waverly homes for sale
- White Bluff homes for sale
Protect your home and budget from life's surprises with an Assurant Home Warranty, backed by a partner that supports you through every step of homeownership. Explore Plans.
©2026 Century 21 Real Estate LLC. All rights reserved. CENTURY 21®, the CENTURY 21 Logo and C21® are service marks owned by Century 21 Real Estate LLC. Century 21 Real Estate LLC fully supports the principles of the Fair Housing Act and the Equal Opportunity Act. Each office is independently owned and operated. Listing information is deemed reliable but not guaranteed accurate.