- Barham, San Marcos homes for sale
- Carlsbad Court, Carlsbad homes for sale
- College Area, San Marcos homes for sale
- Country Club, Escondido homes for sale
- East Richland, San Marcos homes for sale
- Harmony Grove Village, Escondido homes for sale
- Industrial San Marcos, San Marcos homes for sale
- La Costa, Carlsbad homes for sale
- La Costa Meadows, Carlsbad homes for sale
- La Costa Ridge, Carlsbad homes for sale
- Lake San Marcos, San Marcos homes for sale
- Rancho Carrillo, Carlsbad homes for sale
- Richmar, San Marcos homes for sale
- San Elijo Hills, San Marcos homes for sale
- San Marcos the Quorium, San Marcos homes for sale
- Shadowridge, Vista homes for sale
- University Commons, San Marcos homes for sale
- Vineyard, Escondido homes for sale
- West Richland, San Marcos homes for sale
- West Ridge, Escondido homes for sale
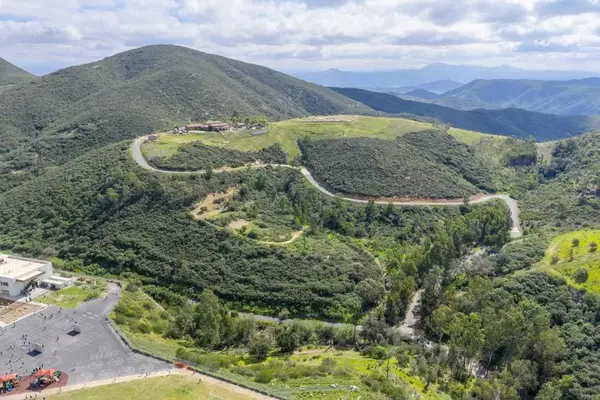
Discovery Hills, San Marcos, CA - homes for sale
31 of 31 results displayed
- New
 $650,000Active0 Acres
0 Attebury Road & Deadwood, San Marcos, CA 92078
MLS# NDP2602831Listed by: COMPASS - New
 $839,900Active3 beds 3 baths1,615 sq. ft.
324 Beaker Road, San Marcos, CA 92078
MLS# 260006934SDListed by: MARK SCHULTZ BROKER - New
 $699,900Active3 beds 3 baths1,378 sq. ft.
351 Beaker Rd, San Marcos, CA 92078
MLS# 260006938SDListed by: MARK SCHULTZ BROKER - New
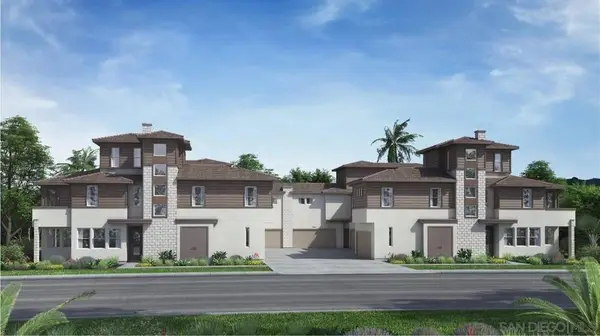
 $1,025,000Active3 beds 3 baths1,931 sq. ft.
477 Village Greens, San Marcos, CA 92078
MLS# 260006608SDListed by: REAL BROKER - Open Sun, 1 to 4pm
 $630,000Active2 beds 3 baths1,231 sq. ft.
1228 Sunrise View #101, San Marcos, CA 92078
MLS# PW26053794Listed by: FIRST TEAM REAL ESTATE  $399,000Pending3 beds 2 baths1,560 sq. ft.
1286 Discovery St #SPC 148, San Marcos, CA 92078
MLS# 260005443Listed by: REALTY ONE GROUP PACIFIC $720,000Active2 beds 3 baths1,243 sq. ft.
959 Slate, San Marcos, CA 92078
MLS# 260004896SDListed by: 33 PROPERTY MANAGEMENT INC. $229,000Pending2 beds 2 baths1,440 sq. ft.
1286 Discovery #82, San Marcos, CA 92078
MLS# NDP2601853Listed by: REAL BROKER- Open Sat, 12 to 2pm
 $765,000Active3 beds 3 baths1,615 sq. ft.
1209 Sunrise View #105, San Marcos, CA 92078
MLS# NDP2601824Listed by: COMPASS  $399,999Active3 beds 2 baths1,335 sq. ft.
1286 Discovery #130, San Marcos, CA 92078
MLS# NDP2601745Listed by: SEAN FEENEY, BROKER $799,000Active3 beds 3 baths1,549 sq. ft.
912 Slate St, San Marcos, CA 92078
MLS# 260003301Listed by: DOUGLAS ELLIMAN OF CALIFORNIA, INC. $715,000Active2 beds 2 baths1,251 sq. ft.
877 Blackstone Drive, San Marcos, CA 92078
MLS# CRNDP2601313Listed by: THE JAISWAL GROUP, INC. $1,489,000Pending5 beds 3 baths3,147 sq. ft.
1122 Via Vera Cruz, San Marcos, CA 92078
MLS# NDP2601293Listed by: COMPASS $990,000Active3 beds 2 baths1,482 sq. ft.
1027 Honeysuckle Dr, San Marcos, CA 92078
MLS# 260002976SDListed by: COMPASS $714,900Pending2 beds 3 baths1,378 sq. ft.
464 Caliper Way, San Marcos, CA 92078
MLS# 260002661SDListed by: MARK SCHULTZ BROKER
 $1,163,900Active4 beds 4 baths2,222 sq. ft.
1021 Partridge Court, San Marcos, CA 92078
MLS# SW26015994Listed by: CENTURY 21 MASTERS $774,999Active3 beds 3 baths1,389 sq. ft.
122 Diamante Road, San Marcos, CA 92078
MLS# NDP2600687Listed by: LPT REALTY $885,000Active3 beds 3 baths1,745 sq. ft.
815 Blackstone Dr, San Marcos, CA 92078
MLS# NDP2600530Listed by: THE LUND TEAM, INC $940,900Active3 beds 3 baths1,915 sq. ft.
350 Beaker Road, San Marcos, CA 92078
MLS# 2601110Listed by: MARK SCHULTZ BROKER $940,900Active3 beds 3 baths1,915 sq. ft.
350 Beaker Road, San Marcos, CA 92078
MLS# 2601110SDListed by: MARK SCHULTZ BROKER $849,900Active3 beds 3 baths1,933 sq. ft.
892 Slate Street, San Marcos, CA 92078
MLS# CRNDP2510639Listed by: REALTY ONE GROUP PACIFIC $855,900Active3 beds 3 baths1,615 sq. ft.
340 Beaker Road, San Marcos, CA 92078
MLS# 250043477SDListed by: MARK SCHULTZ BROKER $249,000Active0 Acres
0 Coronado Hills Dr #37, San Marcos, CA 92078
MLS# 250042504Listed by: CITYMARK REALTY $249,000Active3.27 Acres
0 Coronado Hills Dr, San Marcos, CA 92078
MLS# 250042504SDListed by: CITYMARK REALTY $1,549,000Active4 beds 3 baths2,971 sq. ft.
550 Echo Lane, San Marcos, CA 92078
MLS# 260004692Listed by: COMPASS $235,000Pending2 beds 2 baths1,440 sq. ft.
1286 Discovery #92, San Marcos, CA 92078
MLS# NDP2509445Listed by: LEAH COLE REALTY $249,000Pending2 beds 2 baths1,288 sq. ft.
1286 Discovery #16, San Marcos, CA 92078
MLS# NDP2601480Listed by: LEAH COLE REALTY $1,299,900Active0 Acres
0 Linda Vista, San Marcos, CA 92078
MLS# SW25112929Listed by: ALLISON JAMES ESTATES & HOMES $1,299,000Active0 Acres
0 Paradise Glen Way, San Marcos, CA 92078
MLS# NDP2503423Listed by: HOMESMART REALTY WEST $3,600,000Active0 Acres
Questhaven Road, San Marcos, CA 92078
MLS# NDP2501375Listed by: RE/MAX CONNECTIONS $1,990,000Active0 Acres
0 Las Posas, San Marcos, CA 92078
MLS# CV24107402Listed by: FIRST TEAM REAL ESTATE
Local realty services provided by:CENTURY 21 Affiliated, CENTURY 21 Allstars, CENTURY 21 Wildwood Properties, Inc.
This information is deemed reliable but not guaranteed. You should rely on this information only to decide whether or not to further investigate a particular property. BEFORE MAKING ANY OTHER DECISION, YOU SHOULD PERSONALLY INVESTIGATE THE FACTS (e.g. square footage and lot size) with the assistance of an appropriate professional. You may use this information only to identify properties you may be interested in investigating further. All uses except for personal, non-commercial use in accordance with the foregoing purpose are prohibited. Redistribution or copying of this information, any photographs or video tours is strictly prohibited. This information is derived from the Internet Data Exchange (IDX) service provided by San Diego MLS®. Displayed property listings may be held by a brokerage firm other than the broker and/or agent responsible for this display. The information and any photographs and video tours and the compilation from which they are derived is protected by copyright. Compilation © 2020 San Diego MLS®, Inc.
The information being provided by California Regional MLS (Southern California) is for the consumer's personal, non-commercial use and may not be used for any purpose other than to identify prospective properties consumer may be interested in purchasing. Any information relating to real estate for sale referenced on this web site comes from the Internet Data Exchange (IDX) program of the California Regional MLS (Southern California). CENTURY 21 Allstars is not a Multiple Listing Service (MLS), nor does it offer MLS access. This website is a service of CENTURY 21 Allstars, a broker participant of California Regional MLS (Southern California). This web site may reference real estate listing(s) held by a brokerage firm other than the broker and/or agent who owns this web site.
The accuracy of all information, regardless of source, including but not limited to open house information, square footages and lot sizes, is deemed reliable but not guaranteed and should be personally verified through personal inspection by and/or with the appropriate professionals. The data contained herein is copyrighted by California Regional MLS (Southern California) and is protected by all applicable copyright laws. Any unauthorized dissemination of this information is in violation of copyright laws and is strictly prohibited.
Copyright 2021 California Regional MLS (Southern California). All rights reserved.
Popular neighborhoods near Discovery Hills, San Marcos, CA
Zip codes near Discovery Hills, San Marcos, CA
- 92007 homes for sale
- 92008 homes for sale
- 92009 homes for sale
- 92010 homes for sale
- 92011 homes for sale
- 92024 homes for sale
- 92025 homes for sale
- 92026 homes for sale
- 92029 homes for sale
- 92056 homes for sale
- 92057 homes for sale
- 92067 homes for sale
- 92069 homes for sale
- 92075 homes for sale
- 92078 homes for sale
- 92081 homes for sale
- 92083 homes for sale
- 92084 homes for sale
- 92091 homes for sale
- 92127 homes for sale
Counties near Discovery Hills, San Marcos, CA
Protect your home and budget from life's surprises with an Assurant Home Warranty, backed by a partner that supports you through every step of homeownership. Explore Plans.
©2026 Century 21 Real Estate LLC. All rights reserved. CENTURY 21®, the CENTURY 21 Logo and C21® are service marks owned by Century 21 Real Estate LLC. Century 21 Real Estate LLC fully supports the principles of the Fair Housing Act and the Equal Opportunity Act. Each office is independently owned and operated. Listing information is deemed reliable but not guaranteed accurate.